This comprehensive guide provides professional analysis of Sonic (S) token price trajectory from 2026 to 2031, helping investors understand market dynamics and make informed decisions. The article covers S's current market position with a $244.51M market cap and $0.0849 trading price, combined with historical performance review and detailed price forecasts across conservative, neutral, and optimistic scenarios. Key sections include macroeconomic factors, institutional dynamics, technical analysis, and ecosystem developments affecting S's value. The guide offers practical investment strategies for different investor profiles—from beginners to institutional players—alongside comprehensive risk management frameworks and secure storage solutions via Gate Web3 Wallet. Essential reading for DeFi enthusiasts evaluating Sonic's EVM Layer 1 infrastructure and high-performance blockchain capabilities.
Introduction: S's Market Position and Investment Value
Sonic (S), positioned as an EVM Layer 1 platform offering attractive incentives and robust infrastructure for DeFi, has emerged as a notable player in the blockchain ecosystem since its launch. As of 2026, Sonic maintains a market capitalization of approximately $244.51 million, with a circulating supply of around 2.88 billion tokens and a current price hovering around $0.0849. This asset, recognized as a high-performance blockchain solution delivering 10,000 TPS and sub-second finality, is playing an increasingly important role in the decentralized finance landscape through its Sonic Gateway bridge to Ethereum.
This article will comprehensively analyze Sonic's price trajectory from 2026 to 2031, combining historical patterns, market supply-demand dynamics, ecosystem development, and macroeconomic conditions to provide investors with professional price forecasts and practical investment strategies.
I. S Price History Review and Market Status
S Historical Price Evolution Trajectory
- 2025: Token launched in early January with strong initial performance, reaching an all-time high of $1.03 on January 5, 2025, demonstrating significant market enthusiasm during the launch phase
- 2025: Market experienced a substantial correction throughout the year, with price declining from the peak of $1.03 to a low of $0.067 on December 24, 2025, representing an approximately 93% drawdown from the all-time high
- 2026: Early year showed signs of recovery, with the price rebounding to the $0.08-0.09 range by mid-January, reflecting a potential stabilization after the previous year's significant decline
S Current Market Dynamics
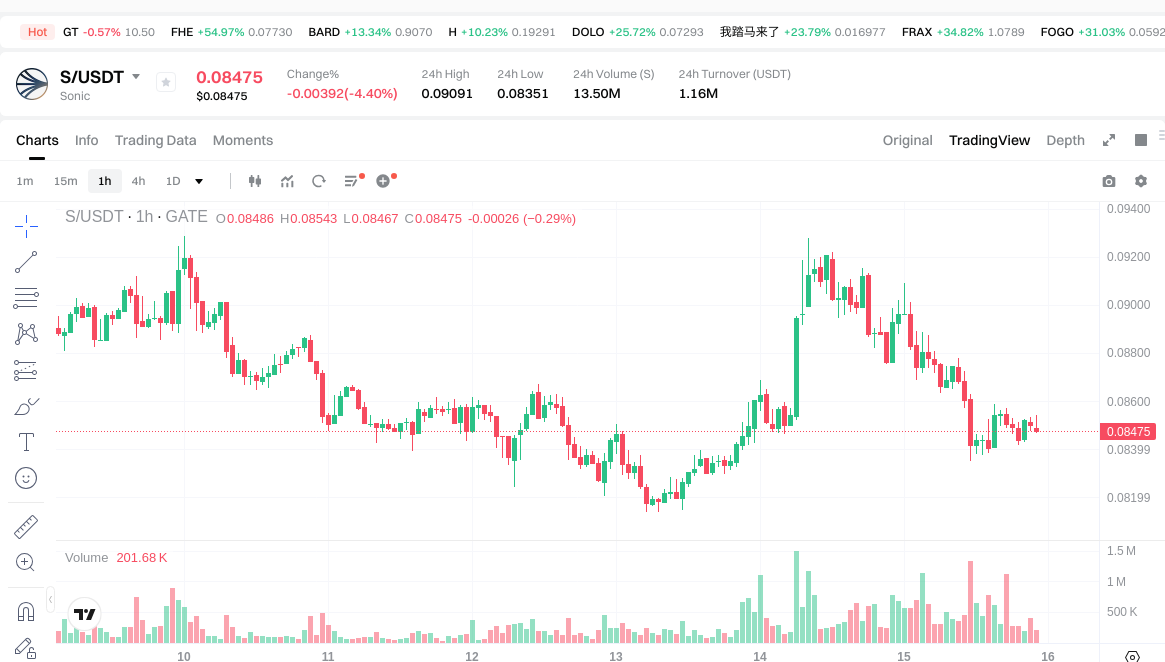
As of January 15, 2026, Sonic (S) is trading at $0.0849, positioning it at rank 211 in the cryptocurrency market by market capitalization. The token has experienced mixed short-term performance, with a 0.22% increase over the past hour, while facing a 4.08% decline over the last 24 hours. The weekly performance shows a 2.29% decrease, though the 30-day chart indicates a modest recovery with a 3.38% gain.
The current trading range shows a 24-hour high of $0.09091 and a low of $0.08351, with a total trading volume of $1,171,134.57. The market capitalization stands at approximately $244.51 million, with 2.88 billion tokens in circulation out of a total supply of 3.22 billion tokens, representing a circulating ratio of 74.04%. The fully diluted market cap is calculated at $273.60 million.
Sonic's market presence is supported by listings on 55 exchanges, with active trading on Gate.com. The platform's technical infrastructure features 10,000 TPS capacity, sub-second finality, and the Sonic Gateway, which serves as a secure bridge to Ethereum for enhanced liquidity and asset security. The current market sentiment index registers at 61, indicating a "Greed" level, suggesting relatively optimistic market positioning.
The token's price remains approximately 91.75% below its all-time high recorded on January 5, 2025, while trading roughly 26.14% above its historical low from December 24, 2025. The market share currently stands at 0.0079% of the total cryptocurrency market capitalization.
Click to view current S market price
S Market Sentiment Indicator
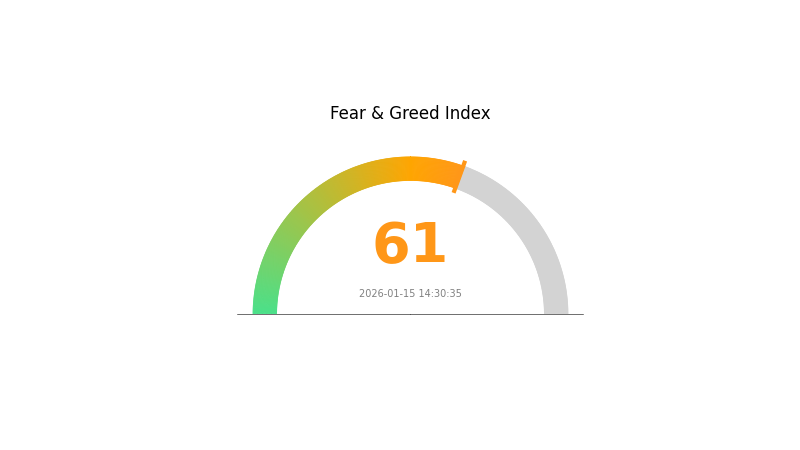
2026-01-15 Fear and Greed Index: 61 (Greed)
Click to view current Fear & Greed Index
The cryptocurrency market is currently exhibiting strong greed sentiment with an index reading of 61. This elevated level indicates that investors are becoming increasingly optimistic and risk-taking behavior is rising across the market. When greed sentiment prevails, traders tend to pursue aggressive positions and chase price rallies, often disregarding potential risks. Market participants should remain cautious during such periods, as excessive optimism can sometimes precede market corrections. It is advisable to maintain a balanced portfolio strategy and avoid overextending positions based solely on bullish market conditions. Professional risk management remains essential when sentiment indicators reach elevated levels.
S Address Distribution
The address distribution chart is a critical on-chain metric that reveals the concentration of token holdings across different wallet addresses. It provides insights into how decentralized or concentrated a cryptocurrency's supply is among holders, which directly impacts market dynamics and price stability.
Based on the current data, S exhibits a relatively concentrated distribution pattern. The top addresses collectively hold a significant portion of the total supply, suggesting that a small number of wallets control substantial market influence. This concentration level raises concerns about potential centralization risks, as large holders could theoretically coordinate actions that affect price movements or liquidity conditions.
Such concentrated holding structures can amplify market volatility. When major addresses execute large-scale transactions, the impact on price can be disproportionately significant compared to more evenly distributed tokens. This creates vulnerability to sudden price swings and potential market manipulation scenarios. From a decentralization perspective, this distribution pattern indicates that S has not yet achieved the broad-based holder base typically associated with mature, community-driven projects. The current on-chain structure suggests investors should monitor whale activity closely and consider the implications of concentrated holdings when evaluating position sizing and risk exposure.
Click to view current S Address Distribution

| Top |
Address |
Holding Qty |
Holding (%) |
II. Core Factors Influencing S's Future Price
Macroeconomic Environment
-
Monetary Policy Impact: The Federal Reserve's interest rate decisions represent a critical variable affecting market dynamics. According to CME Group's FedWatch tool, market participants are closely monitoring policy directions, with expectations of potential rate adjustments influencing asset valuations. Lower interest rates typically enhance the attractiveness of alternative assets by reducing opportunity costs.
-
Inflation Hedge Characteristics: Historical patterns demonstrate that certain assets perform favorably during periods of elevated inflation. Data from 2021-2025 indicates that when consumer price indices exceeded targets, allocations to inflation-resistant instruments increased, reflecting their perceived store-of-value properties during economic uncertainty.
-
Geopolitical Factors: International tensions, including trade policy developments and strategic competition between major economies, create market volatility. The World Gold Council's research indicates that geopolitical and geoeconomic pressures significantly influence investor sentiment and capital flows, with risk events historically correlating with shifts toward perceived safe-haven assets.
Institutional and Market Participant Dynamics
-
Institutional Positioning: Central banks and institutional investors have demonstrated sustained demand patterns. Available data suggests that reserve allocation strategies among global financial institutions have evolved, with diversification efforts contributing to structural support levels.
-
Market Sentiment: Investment demand responds dynamically to economic conditions. Analysis indicates that when economic data signals potential downturns, capital rotation from risk assets intensifies, while confidence in traditional growth scenarios may moderate demand for alternative stores of value.
Economic Cycle Considerations
-
Economic Growth Trajectories: Global economic performance indicators, including GDP growth rates and employment metrics, establish baseline expectations. Periods of economic deceleration historically correlate with increased allocation to assets with defensive characteristics.
-
Liquidity Conditions: Central bank balance sheet policies and global liquidity measures influence real interest rates, which serve as leading indicators for price movements. Historical periods of accommodative monetary policy have preceded notable valuation adjustments across multiple asset classes.
Technical and Analytical Factors
-
Price Momentum: Technical analysis frameworks identify that sustained directional movements, accompanied by volume patterns, contribute to medium-term trend establishment. Market participants utilizing these tools monitor key support and resistance levels to inform positioning strategies.
-
Volatility Characteristics: Short-term price fluctuations reflect immediate uncertainty responses, while longer-term volatility patterns align with structural economic transitions. Historical precedents from periods such as the 1970s energy crises and 2020 pandemic demonstrate elevated volatility during systemic uncertainty.
The interplay of these factors creates a complex environment where macroeconomic fundamentals, institutional behavior, and market sentiment collectively shape price trajectories. Investment strategies should account for both cyclical economic patterns and structural shifts in the global financial system.
III. 2026-2031 S Price Forecast
2026 Outlook
- Conservative forecast: $0.05424 - $0.06950
- Neutral forecast: $0.07500 - $0.08475
- Optimistic forecast: $0.08900 - $0.09746 (contingent on favorable market conditions and increased adoption)
2027-2029 Outlook
- Market stage expectation: Gradual growth phase with potential consolidation periods, reflecting broader cryptocurrency market cycles and project-specific developments
- Price range forecast:
- 2027: $0.0738 - $0.1157
- 2028: $0.05687 - $0.15407
- 2029: $0.11329 - $0.17766
- Key catalysts: Market sentiment shifts, technological advancements within the ecosystem, and potential partnerships that could drive increased utility and demand
2030-2031 Long-term Outlook
- Baseline scenario: $0.1195 - $0.17618 (assuming steady ecosystem growth and maintained market interest)
- Optimistic scenario: $0.15320 - $0.20586 (supported by strong adoption metrics and favorable regulatory environment)
- Transformative scenario: Beyond $0.20586 (conditional upon significant breakthrough developments or widespread institutional adoption)
- 2026-01-15: S price projections suggest potential growth trajectory with expected average price around $0.08475 (based on current market analysis)
| Year |
Predicted High Price |
Predicted Average Price |
Predicted Low Price |
Price Change |
| 2026 |
0.09746 |
0.08475 |
0.05424 |
0 |
| 2027 |
0.1157 |
0.09111 |
0.0738 |
7 |
| 2028 |
0.15407 |
0.10341 |
0.05687 |
21 |
| 2029 |
0.17766 |
0.12874 |
0.11329 |
51 |
| 2030 |
0.17618 |
0.1532 |
0.1195 |
80 |
| 2031 |
0.20586 |
0.16469 |
0.11858 |
93 |
IV. S Professional Investment Strategies and Risk Management
S Investment Methodology
(I) Long-term Holding Strategy
- Suitable for: DeFi enthusiasts and blockchain infrastructure believers who recognize the value of high-performance EVM L1 platforms
- Operational Recommendations:
- Consider accumulating positions during market corrections when S trades below key support levels
- Monitor the development progress of Sonic's ecosystem and DeFi protocol integrations
- Utilize Gate Web3 Wallet for secure storage, which supports EVM-compatible assets and provides convenient access to DeFi protocols
(II) Active Trading Strategy
- Technical Analysis Tools:
- Moving Averages: Observe 50-day and 200-day moving averages to identify potential trend reversals and momentum shifts
- Volume Analysis: Monitor 24-hour trading volume patterns, currently at approximately $1.17M, to gauge market interest and liquidity
- Swing Trading Key Points:
- Pay attention to the 24-hour high ($0.09091) and low ($0.08351) levels as potential resistance and support zones
- Consider the token's volatility patterns, noting recent price movements including a 1-hour gain of 0.22% and 24-hour decline of 4.08%
S Risk Management Framework
(I) Asset Allocation Principles
- Conservative Investors: 1-3% of crypto portfolio allocation
- Aggressive Investors: 5-10% of crypto portfolio allocation
- Professional Investors: Up to 15% with active position management
(II) Risk Hedging Solutions
- Diversification Strategy: Balance S holdings with established L1 platforms and stablecoins to reduce concentration risk
- Position Sizing: Implement gradual entry strategies rather than deploying full capital at once, especially given the token's price volatility
(III) Secure Storage Solutions
- Software Wallet Recommendation: Gate Web3 Wallet offers convenient access with built-in security features for EVM-compatible assets
- Multi-signature Approach: For larger holdings, consider implementing multi-signature security protocols
- Security Precautions: Never share private keys, enable two-factor authentication, and regularly verify wallet security settings
V. S Potential Risks and Challenges
S Market Risks
- Price Volatility: S has experienced significant price fluctuations, with a 1-year decline of 89.08%, indicating substantial market volatility
- Liquidity Concerns: With a 24-hour trading volume of approximately $1.17M and market cap of $244.5M, liquidity may be limited during high volatility periods
- Market Sentiment: As a relatively newer L1 platform, S remains susceptible to broader market sentiment shifts and competition from established blockchain networks
S Regulatory Risks
- DeFi Regulatory Uncertainty: Evolving global regulatory frameworks for DeFi platforms may impact Sonic's operations and token utility
- Cross-border Compliance: The Sonic Gateway bridge to Ethereum may face regulatory scrutiny regarding cross-chain asset transfers
- Jurisdictional Variations: Different regulatory approaches across regions may affect S token accessibility and trading options
S Technical Risks
- Network Security: While Sonic claims high performance specifications, the platform's security track record requires ongoing monitoring
- Bridge Vulnerabilities: The Sonic Gateway's security is critical, as cross-chain bridges have historically been targets for exploits
- Scalability Challenges: Maintaining claimed 10,000 TPS performance under high network demand conditions may present technical challenges
VI. Conclusion and Action Recommendations
S Investment Value Assessment
Sonic presents an interesting proposition as an EVM-compatible L1 platform focused on DeFi infrastructure with claimed high-performance capabilities (10,000 TPS and sub-second finality). The token's current market position, with a market cap of approximately $244.5M and market dominance of 0.0079%, suggests it remains a relatively smaller player in the L1 ecosystem. The circulating supply represents 74.04% of fully diluted valuation, indicating moderate token distribution. However, investors should carefully consider the significant price volatility, evidenced by the 89.08% decline over the past year and the gap between current price ($0.0849) and all-time high ($1.03). The platform's success will largely depend on ecosystem development, DeFi protocol adoption, and the competitive advantages of its technical infrastructure.
S Investment Recommendations
✅ Beginners: Start with minimal allocation (1-2% of crypto portfolio) to understand S token dynamics and Sonic ecosystem development before increasing exposure
✅ Experienced Investors: Consider strategic accumulation during favorable technical setups while maintaining strict risk management, limiting S exposure to 5-10% of crypto holdings
✅ Institutional Investors: Conduct thorough due diligence on Sonic's technical infrastructure, team credentials, and ecosystem growth metrics before considering meaningful allocation
S Trading Participation Methods
- Spot Trading: Purchase S tokens through Gate.com's spot markets for straightforward exposure to price movements
- DeFi Participation: Engage with Sonic's native DeFi protocols to explore potential yield opportunities while supporting ecosystem development
- Gradual Accumulation: Implement dollar-cost averaging strategies to build positions over time, reducing the impact of short-term volatility
Cryptocurrency investment carries extremely high risks, and this article does not constitute investment advice. Investors should make prudent decisions based on their own risk tolerance and are advised to consult professional financial advisors. Never invest more than you can afford to lose.
FAQ
What is the historical price trend of S?
S has experienced a 10.2% price decline, currently trading at 88.0 USDT. The all-time low stands at 88.0 USDT, while the historical stable price was 98.0 USDT. The overall price trend shows a downward movement.
What are the main factors affecting S price?
S price is primarily driven by market supply and demand dynamics, trading volume, market sentiment, regulatory developments, and broader cryptocurrency market trends. When demand exceeds supply, prices typically rise; conversely, oversupply with weak demand can lead to price declines.
What is the price prediction for S in 2024?
Based on available data, S price prediction for 2024 cannot be accurately determined. Current forecasts focus on 2026 and beyond. We recommend monitoring market trends and fundamental developments for more reliable price insights.
What analytical methods are commonly used for S price prediction?
S price prediction typically employs technical analysis, fundamental analysis, and machine learning models. Common methods include moving averages, trend analysis, ARIMA time series models, and neural networks combined with on-chain metrics and trading volume analysis.
What are S's price advantages compared to similar assets?
S offers streamlined trading processes with lower due diligence complexity, attracting more potential buyers. Its highly customized solutions provide stronger competitive advantages in the market.
What risks should investors be aware of when investing in S?
S investment risks include market maturity exposure, liquidity constraints during market downturns, GP performance variability, and underlying asset concentration. Consider diversifying portfolios and conducting thorough due diligence before committing capital.
* The information is not intended to be and does not constitute financial advice or any other recommendation of any sort offered or endorsed by Gate.