This comprehensive analysis examines AIV price trends and investment opportunities through 2031. AIV, the first MCP-powered generative AI gaming protocol on BNBChain, currently trades at $0.001779 with a market cap of $4.94 million. The article reviews historical price movements, current market sentiment (fear index 26), and tokenomics including concentrated holder distribution. Core price drivers include liquidity from Gate.com trading, macroeconomic factors, and ecosystem development. Predictions forecast consolidation in 2026 ($0.00113-$0.00197), recovery through 2027-2029, and significant growth potential reaching $0.00274-$0.00302 by 2031. Investment strategies span long-term holding to active trading, with detailed risk management frameworks addressing volatility, regulatory, and technical challenges. Recommended for investors understanding early-stage AI gaming protocols on BNBChain.
Introduction: AIV's Market Position and Investment Value
AIVille (AIV), as the first MCP-Powered Generative AI Gaming Protocol on BNBChain, has been developing its unique position in the Web3 gaming ecosystem since its launch. As of 2026, AIV maintains a market capitalization of approximately $4.94 million, with a circulating supply of about 2.78 billion tokens, and the price hovering around $0.001779. This asset, characterized as an innovative blockchain-based AI gaming protocol, is playing an increasingly important role in the convergence of artificial intelligence and decentralized gaming.
This article will comprehensively analyze AIV's price trends from 2026 to 2031, combining historical patterns, market supply and demand dynamics, ecosystem development, and macroeconomic environment factors to provide investors with professional price forecasts and practical investment strategies.
I. AIV Price History Review and Market Status
AIV Historical Price Evolution Trajectory
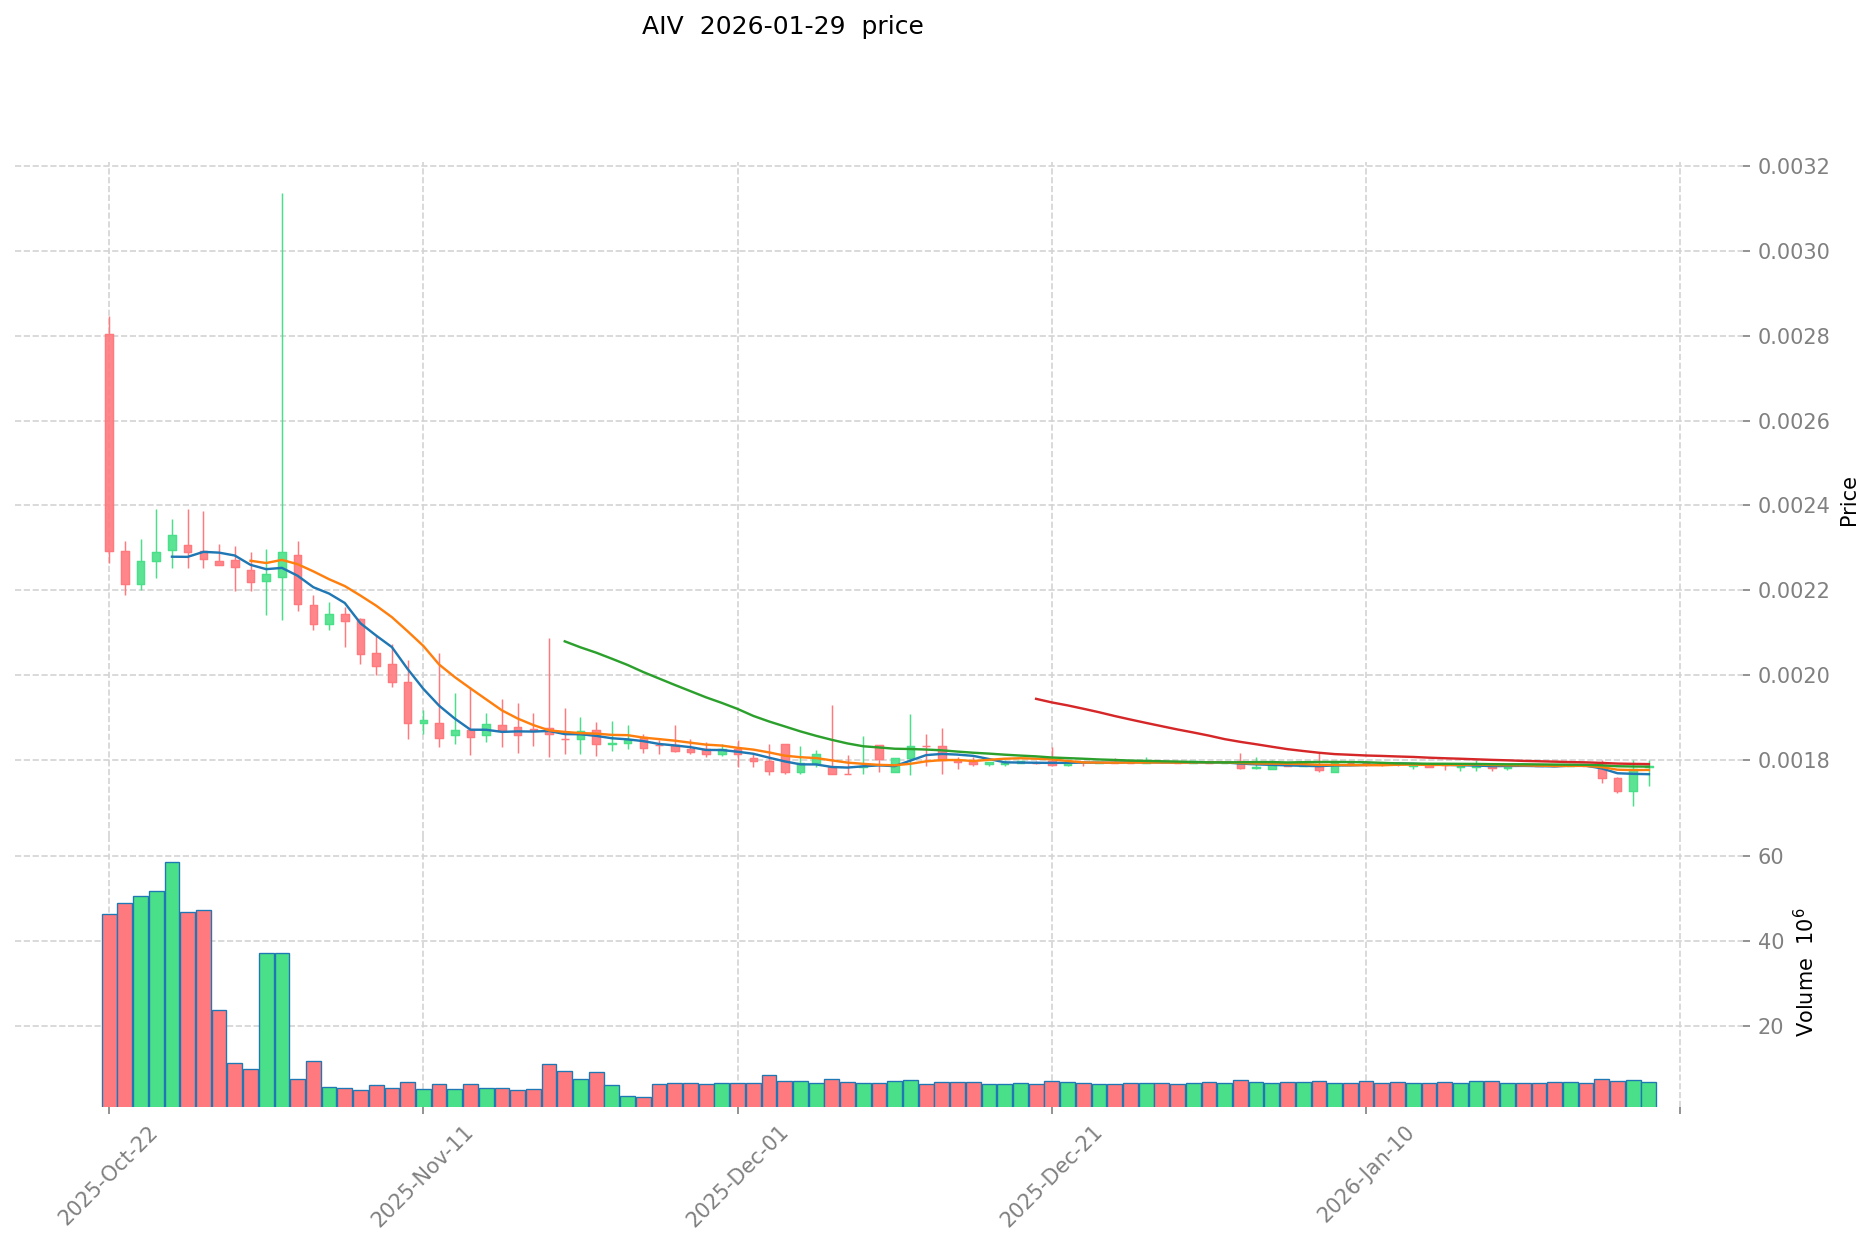
- 2025: AIV reached a high point of $0.009 in September, demonstrating notable market performance during the period.
- 2026: The token experienced a decline, with price dropping to $0.00169 in late January, reflecting broader market adjustments.
AIV Current Market Situation
As of January 29, 2026, AIV is trading at $0.001779, with a 24-hour trading volume of $12,224.66. The token has shown a slight decline of 0.22% over the past 24 hours, with the price ranging between $0.001738 and $0.0018 during this period.
The circulating supply stands at 2,777,160,000 AIV tokens, representing 27.77% of the total supply of 10,000,000,000 tokens. The current market capitalization is approximately $4.94 million, while the fully diluted valuation reaches $17.79 million. AIV holds a market dominance of 0.00057% and ranks at position 1537 in the cryptocurrency market.
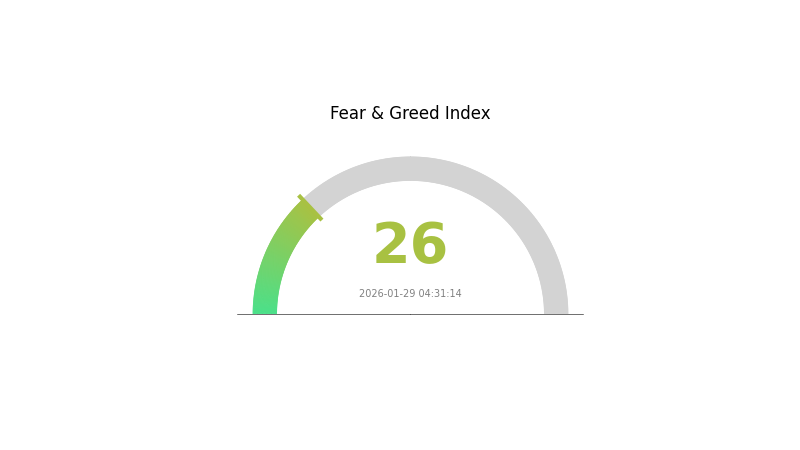
Over different timeframes, AIV has experienced varied performance: a 0.16% decrease in the past hour, a 0.55% decline over the past week, and a 1% drop over the past month. However, the token has demonstrated significant growth over the past year, with an increase of 112.70%. The current market sentiment index indicates a fear level at 26, suggesting cautious market conditions. AIV is available for trading on Gate.com, with approximately 14,560 holders currently engaged with the token.
Click to view current AIV market price
AIV Market Sentiment Index
2026-01-29 Fear and Greed Index: 26 (Fear)
Click to view the current Fear & Greed Index
The cryptocurrency market is currently experiencing a fear sentiment with an index reading of 26. This indicates heightened market anxiety and investor caution. When the Fear and Greed Index drops to fear territory, it typically reflects concerns about price volatility, potential downturns, or negative market catalysts. Investors tend to adopt defensive strategies during such periods. However, seasoned traders often view extreme fear as potential buying opportunities, as markets may be oversold. Monitor market developments closely and consider your risk tolerance before making investment decisions.
AIV Holding Distribution
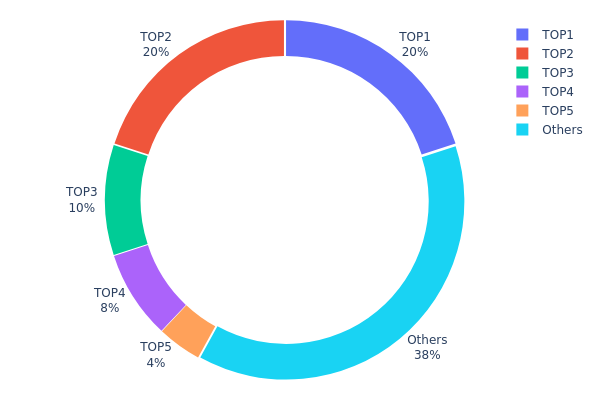
The holding distribution chart is a key metric for assessing token concentration across wallet addresses. It reveals the percentage of total supply controlled by top holders and provides insights into the decentralization level of a cryptocurrency project. A more balanced distribution typically indicates healthier market structure and reduced manipulation risk, while excessive concentration may suggest centralization concerns.
Based on the current data, AIV exhibits significant concentration characteristics. The top two addresses collectively control nearly 40% of the total supply, with the leading address holding exactly 20% (2,000,000K tokens) and the second address holding 19.99% (1,999,840K tokens). The top five addresses combined account for approximately 62% of total circulation, indicating a highly concentrated ownership structure. This level of concentration suggests that a relatively small number of entities possess substantial control over the token supply.
From a market structure perspective, this concentrated distribution pattern presents both opportunities and risks. The high concentration could lead to increased price volatility, as large holders have the capacity to significantly impact market dynamics through their trading activities. During periods of market turbulence, coordinated selling pressure from these major holders could trigger sharp price corrections. Additionally, the limited distribution among a small number of addresses raises concerns about potential market manipulation and reduced liquidity depth.
Click to view current AIV Holding Distribution
| Top |
Address |
Holding Qty |
Holding (%) |
| 1 |
0xa817...997f53 |
2000000.00K |
20.00% |
| 2 |
0xa815...302d0f |
1999840.00K |
19.99% |
| 3 |
0x8b78...bd6862 |
1000000.00K |
10.00% |
| 4 |
0xb66f...d95686 |
800000.00K |
8.00% |
| 5 |
0xcc2e...d1c517 |
400000.00K |
4.00% |
| - |
Others |
3800160.00K |
38.01% |
II. Core Factors Influencing AIV's Future Price
Supply Mechanism
- Market Liquidity: The listing on Gate.com is expected to introduce additional liquidity to AIV, which may serve as a significant price driver in the near term. Increased trading volume and market accessibility through this platform could enhance price discovery mechanisms.
- Historical Patterns: Market liquidity has traditionally played a role in token price movements, with new exchange listings often correlating with increased trading activity and market exposure.
- Current Impact: The anticipated liquidity boost from the Gate.com listing may contribute to enhanced market dynamics and potentially influence price behavior through improved accessibility for market participants.
Institutional and Major Holder Dynamics
- Institutional Activity: Institutional investment patterns have been observed as a factor in cryptocurrency market movements, with increased institutional participation potentially influencing market sentiment and price trends.
- Market Positioning: AIV's position within the BNB Chain ecosystem and its focus on AI-related applications may attract attention from participants interested in these technological sectors.
Macroeconomic Environment
- Regulatory Landscape: The evolving regulatory environment continues to be a factor that may influence cryptocurrency markets broadly, with policy developments potentially affecting market sentiment and operational frameworks.
- Market Sentiment: Overall market sentiment and investor confidence in the cryptocurrency sector may play a role in influencing price movements across various digital assets.
Technical Development and Ecosystem Building
- Ecosystem Position: AIV's positioning within the BNB Chain ecosystem represents a component of its technical infrastructure, with the project's integration into this blockchain network forming part of its technical foundation.
- AI Sector Dynamics: The project's focus on AI-related applications aligns with broader technological trends in the digital asset space, which may influence its market positioning and potential development trajectory.
III. 2026-2031 AIV Price Prediction
2026 Outlook
- Conservative prediction: $0.00113 - $0.00174
- Neutral prediction: $0.00174 (average market scenario)
- Optimistic prediction: $0.00197 (requires favorable market conditions)
Based on the forecast data, AIV is expected to experience a relatively stable performance in 2026, with the price ranging between $0.00113 and $0.00197. The predicted average price of $0.00174 suggests moderate market sentiment. However, the anticipated 2% price decline indicates potential headwinds or consolidation period during this year.
2027-2029 Outlook
- Market stage expectation: Gradual recovery and growth phase
- Price range predictions:
- 2027: $0.0012 - $0.00232
- 2028: $0.00129 - $0.00225
- 2029: $0.0015 - $0.0026
- Key catalysts: Progressive market adoption and ecosystem development
The mid-term forecast suggests AIV will enter a recovery trajectory starting from 2027, with a projected 4% increase. By 2028, the growth momentum is expected to strengthen with a 17% surge, potentially driven by enhanced utility and broader market acceptance. The upward trend continues into 2029 with an anticipated 21% gain, positioning the token for sustained growth as the market matures.
2030-2031 Long-term Outlook
- Base scenario: $0.00124 - $0.00238 (assuming steady market development)
- Optimistic scenario: $0.00274 - $0.00302 (requires strong adoption and favorable macro conditions)
- Transformative scenario: $0.0031 (with exceptional market breakthrough)
The long-term projections indicate significant growth potential for AIV. In 2030, the token could achieve a 34% increase with prices reaching up to $0.0031 in the most favorable conditions. By 2031, the forecast becomes even more promising with a potential 54% surge, with the average price estimated at $0.00274 and the optimistic target reaching $0.00302. This extended growth trajectory suggests increasing market confidence and potential ecosystem expansion over the five-year horizon.
| Year |
Predicted High Price |
Predicted Average Price |
Predicted Low Price |
Price Change |
| 2026 |
0.00197 |
0.00174 |
0.00113 |
-2 |
| 2027 |
0.00232 |
0.00185 |
0.0012 |
4 |
| 2028 |
0.00225 |
0.00208 |
0.00129 |
17 |
| 2029 |
0.0026 |
0.00217 |
0.0015 |
21 |
| 2030 |
0.0031 |
0.00238 |
0.00124 |
34 |
| 2031 |
0.00302 |
0.00274 |
0.00165 |
54 |
IV. AIV Professional Investment Strategy and Risk Management
AIV Investment Methodology
(1) Long-term Holding Strategy
- Target investors: Investors who believe in the long-term development of AI gaming protocols and Web3 infrastructure
- Operational recommendations:
- Consider accumulating positions during market pullbacks, particularly when price approaches support levels around $0.00169-$0.00177
- Monitor the project's development progress on BNBChain and the adoption of its enhanced Model Context Protocol (eMCP)
- Storage solution: Use Gate Web3 Wallet for secure asset custody, ensuring private key backup and enabling multi-signature protection if available
(2) Active Trading Strategy
- Technical analysis tools:
- Volume analysis: Monitor 24-hour trading volume (currently $12,224.66) for liquidity assessment and potential breakout signals
- Price range indicators: Track the 24-hour high ($0.0018) and low ($0.001738) to identify intraday volatility patterns
- Swing trading considerations:
- Consider the relatively low circulating supply (27.77% of total supply) which may contribute to price volatility
- Pay attention to the token's performance within its trading range between recent low at $0.00169 and historical high at $0.009
AIV Risk Management Framework
(1) Asset Allocation Principles
- Conservative investors: 1-3% of crypto portfolio allocation
- Active investors: 3-7% of crypto portfolio allocation
- Professional investors: 5-10% of crypto portfolio allocation based on risk tolerance and market conditions
(2) Risk Hedging Approaches
- Diversification strategy: Balance AIV holdings with established cryptocurrencies and stablecoins to reduce concentration risk
- Position sizing: Implement gradual entry and exit strategies to minimize timing risk in a market with 24-hour fluctuations
(3) Secure Storage Solutions
- Hot wallet recommendation: Gate Web3 Wallet for convenient trading and staking activities
- Cold storage approach: Consider hardware wallet solutions for long-term holdings exceeding comfortable risk thresholds
- Security precautions: Enable two-factor authentication, regularly update wallet software, verify contract address (0xadf7335da0e77339f2d69841f79b0aa6c14d187d on BSC) before transactions, and never share private keys
V. AIV Potential Risks and Challenges
AIV Market Risks
- Volatility risk: Recent price fluctuations show -0.22% in 24 hours and -0.55% over 7 days, indicating ongoing market volatility
- Liquidity risk: With a market cap of approximately $4.94 million and relatively limited trading volume, large transactions may face slippage
- Market sentiment risk: The token's market dominance of 0.00057% indicates sensitivity to broader crypto market movements and investor sentiment shifts
AIV Regulatory Risks
- Gaming token regulations: Evolving regulatory frameworks for blockchain-based gaming tokens may impact project operations
- AI technology compliance: Potential regulatory scrutiny of AI-powered gaming protocols and data privacy requirements
- Cross-border compliance: As a BNBChain-based project, regulatory changes in multiple jurisdictions may affect accessibility and trading
AIV Technical Risks
- Smart contract risk: BEP-20 token standard implementation requires ongoing security audits to prevent potential vulnerabilities
- Protocol dependency: Heavy reliance on the enhanced Model Context Protocol (eMCP) and BNBChain infrastructure creates technical dependencies
- Scaling challenges: As an AI gaming protocol, the project may face technical challenges in scaling LLM agent interactions and on-chain gameplay
VI. Conclusion and Action Recommendations
AIV Investment Value Assessment
AIVille (AIV) represents an innovative approach to combining AI technology with blockchain gaming, positioning itself as the first MCP-powered generative AI gaming protocol on BNBChain. With a circulating supply of 27.77% and a holder base of 14,560, the project shows early community adoption. The token has demonstrated significant growth potential with a 112.70% increase over one year, though recent short-term performance shows slight declines. The long-term value proposition centers on the development of Web3 AI gaming infrastructure, while short-term risks include market volatility, limited liquidity, and the early-stage nature of the project.
AIV Investment Recommendations
✅ Beginners: Start with small position sizing (1-2% of crypto portfolio), focus on learning about AI gaming protocols and BNBChain ecosystem, use Gate Web3 Wallet for secure storage, and avoid investing more than you can afford to lose
✅ Experienced investors: Consider dollar-cost averaging strategies, monitor project development milestones and eMCP adoption, maintain diversified portfolio allocation (3-5%), and implement stop-loss mechanisms
✅ Institutional investors: Conduct comprehensive due diligence on protocol security and team background, evaluate long-term AI gaming market potential, consider strategic position building during market corrections, and implement professional risk management frameworks
AIV Trading Participation Methods
- Spot trading: Direct purchase and sale of AIV tokens on Gate.com with competitive fees and liquidity
- Web3 wallet integration: Use Gate Web3 Wallet to interact with BNBChain-based decentralized applications and participate in the AIVille ecosystem
- Portfolio management: Incorporate AIV into a diversified crypto portfolio alongside established assets to manage risk exposure
Cryptocurrency investment carries extremely high risks. This article does not constitute investment advice. Investors should make prudent decisions based on their own risk tolerance and are advised to consult professional financial advisors. Never invest more than you can afford to lose.
FAQ
What is AIV and how does its price work?
AIV is a cryptocurrency token designed for decentralized finance applications. Its price is determined by market supply and demand dynamics, trading volume, and network adoption. Price fluctuations reflect investor sentiment and real-world utility value.
How can I predict AIV price movements?
Analyze on-chain metrics, trading volume trends, market sentiment, and historical price patterns. Monitor network activity, holder distribution, and correlation with broader crypto market cycles. Use technical analysis tools and fundamental factors to identify potential price movements.
What factors affect AIV price prediction accuracy?
AIV price prediction accuracy depends on historical price patterns, trading volume, market demand, sentiment analysis, and macroeconomic factors. Reliable data quality and model sophistication also significantly influence prediction precision.
Is AIV price prediction reliable for investment decisions?
AIV price predictions provide market insights based on technical analysis and historical data. However, cryptocurrency markets are highly volatile and influenced by multiple unpredictable factors. Use predictions as a reference tool alongside your own research and risk assessment for informed investment decisions.
What are the risks involved in AIV price speculation?
AIV price speculation carries significant risks including market volatility, rapid price fluctuations, and potential loss of principal. Forecasts may not materialize, and trading conditions can change unpredictably. Always be prepared for substantial financial losses.
How do technical analysis and AI models help predict AIV prices?
AI models analyze historical data and market patterns to forecast AIV price movements. Combined with technical analysis, they identify trends and key levels, enabling more accurate predictions. This data-driven approach helps investors anticipate market directions and optimize trading strategies.
* The information is not intended to be and does not constitute financial advice or any other recommendation of any sort offered or endorsed by Gate.