This comprehensive guide analyzes Marlin (POND) token's investment potential through 2031, combining historical price evolution, current market metrics, and expert forecasts. Trading at $0.003668 with a $30.09M market cap, POND demonstrates extreme market fear (index: 24) and significant concentration risk, with top holders controlling 69.68% of supply. The analysis projects conservative to optimistic price targets, ranging from $0.00243 to $0.00932 by 2031, representing potential 86% growth under transformational scenarios. Strategic recommendations include long-term accumulation during downturns, active trading via Gate's technical tools, and prudent allocation of 1-10% portfolio allocation based on risk tolerance. Critical risk factors include volatility, liquidity constraints, regulatory uncertainty, and competition from established infrastructure protocols. Suitable for investors seeking Web3 infrastructure exposure with appropriate risk management.
Introduction: POND's Market Position and Investment Value
Marlin (POND), positioned as a high-performance programmable network infrastructure protocol for DeFi and Web 3.0, has been serving the blockchain ecosystem since its launch in 2020. As of 2026, Marlin holds a market capitalization of approximately $30.09 million, with a circulating supply of around 8.2 billion tokens, and the price maintains at approximately $0.003668. This asset, recognized as a "network infrastructure facilitator," is playing an increasingly critical role in optimizing data transmission and network performance for decentralized applications.
This article will comprehensively analyze POND's price movements from 2026 to 2031, combining historical patterns, market supply-demand dynamics, ecosystem developments, and macroeconomic environments to provide investors with professional price forecasts and practical investment strategies.
I. POND Price History Review and Market Status
POND Historical Price Evolution
- 2020: Marlin protocol launched with an initial offering price of $0.008, and the price experienced notable growth, reaching a peak of $0.323362 on December 22, 2020
- 2021-2025: The market entered an extended consolidation phase, with POND experiencing gradual price decline alongside broader market cycles
- 2026: As of January 21, the token price recorded $0.00358793, reflecting a significant contraction from previous levels
POND Current Market Status
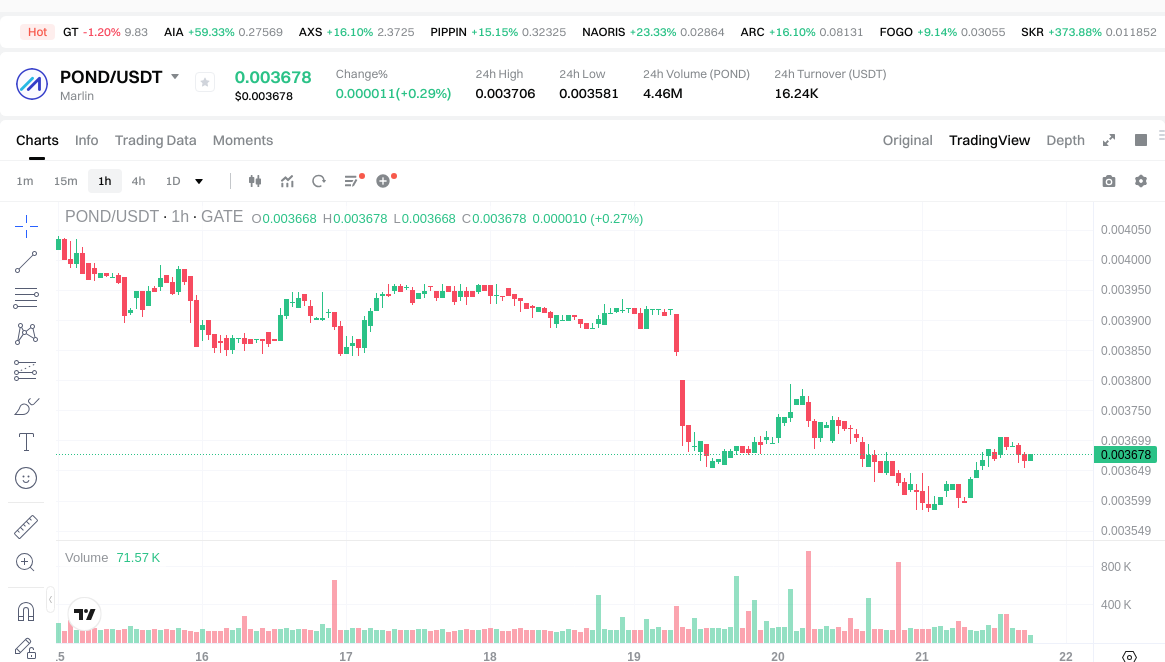
As of January 21, 2026, POND is trading at $0.003668, with a 24-hour trading volume of $16,220.33. The token demonstrates mixed short-term performance, showing a 0.11% increase over the past hour, while recording a 0.21% decline in the last 24 hours. Over longer time frames, the price has decreased by 8.58% in the past week and 8.26% over the past month. The annual performance indicates a 77.17% decline.
The market capitalization stands at approximately $30.09 million, with a fully diluted valuation of $36.68 million. The circulating supply represents 8.20 billion POND tokens, accounting for 82.02% of the maximum supply of 10 billion tokens. The market cap to fully diluted valuation ratio of 82.02% suggests a relatively high proportion of tokens already in circulation.
The 24-hour price range fluctuated between $0.003581 and $0.003706. The token maintains a market dominance of 0.0011% and is currently ranked #715 in the cryptocurrency market. POND is listed on 22 exchanges and holds approximately 11,258 token holders. The current market sentiment index registers at 24, indicating an extreme fear condition in the broader cryptocurrency market.
Click to view current POND market price
POND Market Sentiment Index
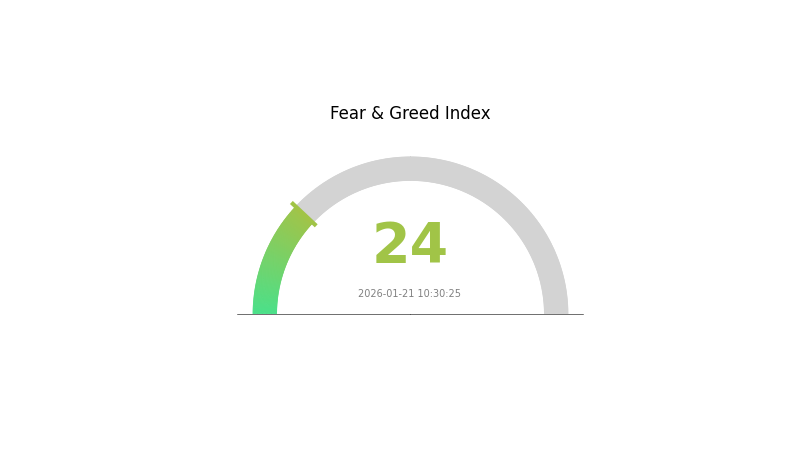
01-21-2026 Fear and Greed Index: 24 (Extreme Fear)
Click to view current Fear & Greed Index
The cryptocurrency market is currently experiencing extreme fear, with the Fear and Greed Index standing at 24. This indicates heightened market anxiety and pessimistic sentiment among investors. During such periods, risk-averse traders typically reduce exposure, while contrarian investors may view this as a potential buying opportunity. Extreme fear often precedes significant market reversals. Monitor market developments closely and ensure risk management strategies are properly aligned with your investment objectives.
POND Holding Distribution
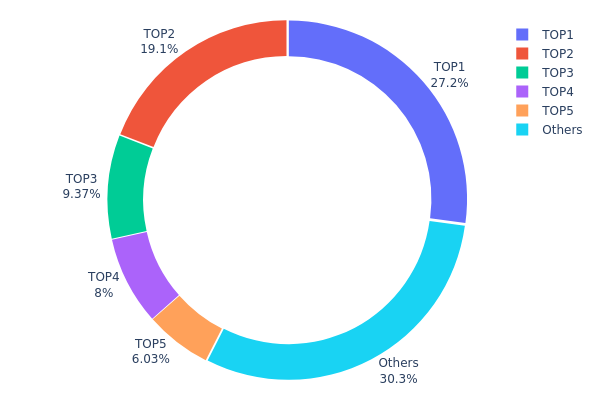
The holding distribution chart illustrates the concentration of token ownership across different wallet addresses, revealing how POND tokens are allocated among major holders and the broader community. This metric serves as a critical indicator of decentralization level and potential market manipulation risks.
According to the current data, POND exhibits a relatively high concentration pattern. The top five addresses collectively control approximately 69.68% of the total supply, with the largest holder (0xcee2...97180d) alone possessing 27.17% of all tokens. The second-largest address holds 19.12%, followed by the third at 9.37%. This concentration structure suggests that a small number of entities maintain significant influence over the token's market dynamics. The remaining 30.32% is distributed among other addresses, indicating limited dispersal among retail participants and smaller institutional holders.
This concentration level presents both opportunities and risks for POND's market structure. On one hand, large holders may provide stability during market downturns through their long-term commitment. On the other hand, such concentration creates vulnerability to sudden price volatility if major holders decide to liquidate positions. The current distribution pattern indicates that POND's on-chain structure leans toward centralization, which could potentially subject the token to coordinated selling pressure or market manipulation. Investors should monitor changes in top holder positions closely, as significant movements could signal shifts in market sentiment and trigger substantial price fluctuations.
Click to view current POND Holding Distribution
| Top |
Address |
Holding Qty |
Holding (%) |
| 1 |
0xcee2...97180d |
2717145.49K |
27.17% |
| 2 |
0xe5fe...9ebecc |
1912624.02K |
19.12% |
| 3 |
0xaba3...8f2f4e |
937035.84K |
9.37% |
| 4 |
0xf977...41acec |
800000.00K |
8.00% |
| 5 |
0x7f75...14edf9 |
602774.07K |
6.02% |
| - |
Others |
3030420.58K |
30.32% |
II. Core Factors Influencing POND's Future Price
Based on the available information, there is insufficient data to provide a comprehensive analysis of the core factors that may influence POND's future price. The reference materials do not contain specific details regarding supply mechanisms, institutional holdings, macroeconomic factors, or technical developments related to POND.
To make informed investment decisions regarding POND, it is recommended to:
- Monitor official project announcements and documentation
- Review on-chain data through blockchain explorers
- Follow reputable cryptocurrency analysis platforms
- Stay updated on broader market trends that may affect the token
For the latest trading information and market data on POND, you may visit Gate.com.
III. 2026-2031 POND Price Prediction
2026 Outlook
- Conservative prediction: $0.00243 - $0.00368
- Neutral prediction: $0.00368
- Optimistic prediction: $0.00467 (requires favorable market conditions)
2027-2029 Outlook
- Market stage expectation: The token is anticipated to enter a gradual growth phase, with price volatility moderating as the market matures.
- Price range prediction:
- 2027: $0.00321 - $0.00589 (approximately 13% increase from 2026 average)
- 2028: $0.00342 - $0.00604 (approximately 37% increase from 2026 average)
- 2029: $0.00310 - $0.00570 (approximately 50% increase from 2026 average)
- Key catalysts: Market adoption trends, technological developments within the ecosystem, and broader crypto market sentiment could serve as primary drivers.
2030-2031 Long-term Outlook
- Baseline scenario: $0.00315 - $0.00809 (assuming steady market development)
- Optimistic scenario: $0.00658 - $0.00932 (assuming enhanced ecosystem utility and increased adoption)
- Transformational scenario: Potential to reach upper bounds of $0.00932 by 2031 (requires significant market expansion and sustained bullish momentum, representing approximately 86% growth from 2026 average)
- 2031-12-31: POND $0.00685 (projected average price under baseline conditions)
| Year |
Predicted High Price |
Predicted Average Price |
Predicted Low Price |
Price Change |
| 2026 |
0.00467 |
0.00368 |
0.00243 |
0 |
| 2027 |
0.00589 |
0.00417 |
0.00321 |
13 |
| 2028 |
0.00604 |
0.00503 |
0.00342 |
37 |
| 2029 |
0.0057 |
0.00553 |
0.0031 |
50 |
| 2030 |
0.00809 |
0.00562 |
0.00315 |
53 |
| 2031 |
0.00932 |
0.00685 |
0.00658 |
86 |
IV. POND Professional Investment Strategy and Risk Management
POND Investment Methodology
(I) Long-term Holding Strategy
- Suitable for: Investors who believe in the long-term potential of decentralized network infrastructure and Web 3.0 ecosystem development
- Operational Recommendations:
- Consider accumulating POND during market downturns, particularly when the token trades near support levels
- Monitor Marlin's network adoption metrics and partnership announcements as indicators of fundamental value growth
- Storage Solution: Utilize Gate Web3 Wallet for secure custody with multi-signature protection, or consider hardware wallets for larger holdings
(II) Active Trading Strategy
- Technical Analysis Tools:
- Moving Averages: Use 50-day and 200-day moving averages to identify trend directions and potential entry/exit points
- Relative Strength Index (RSI): Monitor oversold conditions (below 30) and overbought conditions (above 70) to time trades
- Swing Trading Considerations:
- Given POND's recent 24-hour trading volume of approximately $16,220, be mindful of liquidity when executing larger orders
- Set stop-loss orders at 5-8% below entry points to manage downside risk in volatile market conditions
POND Risk Management Framework
(I) Asset Allocation Principles
- Conservative Investors: 1-2% of crypto portfolio allocation
- Aggressive Investors: 3-5% of crypto portfolio allocation
- Professional Investors: Up to 10% with active risk management protocols
(II) Risk Hedging Solutions
- Diversification: Balance POND holdings with established infrastructure tokens and stablecoins to reduce sector-specific risks
- Position Sizing: Avoid over-concentration; maintain positions that allow for multiple entry and exit opportunities
(III) Secure Storage Solutions
- Hot Wallet Recommendation: Gate Web3 Wallet for convenient trading and staking access with built-in security features
- Cold Storage Option: Hardware wallets for long-term holdings, particularly for amounts exceeding regular trading needs
- Security Precautions: Enable two-factor authentication, never share private keys, and regularly verify smart contract addresses (0x57b946008913b82e4df85f501cbaed910e58d26c on Ethereum) before transactions
V. POND Potential Risks and Challenges
POND Market Risks
- Price Volatility: POND has experienced significant price fluctuations, with a 77.17% decline over the past year, indicating substantial market risk
- Liquidity Concerns: With a relatively modest 24-hour trading volume, large transactions may experience slippage or difficulty in execution
- Market Capitalization: Ranked at 715 with a market share of 0.0011%, POND faces competition from larger, more established infrastructure projects
POND Regulatory Risks
- Network Protocol Classification: Evolving regulatory frameworks may impact how decentralized network infrastructure protocols are classified and governed
- Staking Regulations: Node staking requirements and token-based governance mechanisms may face scrutiny under emerging securities regulations in various jurisdictions
- Cross-border Operations: As a global network infrastructure provider, Marlin may encounter compliance challenges across different regulatory environments
POND Technical Risks
- Network Adoption: The protocol's value depends on widespread adoption by DeFi and Web 3.0 applications, which remains uncertain
- Competition Risk: Established and emerging competitors in the decentralized infrastructure space may offer alternative solutions, affecting POND's utility and demand
- Smart Contract Vulnerabilities: Although deployed on Ethereum, smart contracts carry inherent risks of bugs or exploits that could affect token functionality
VI. Conclusion and Action Recommendations
POND Investment Value Assessment
Marlin (POND) operates in the strategically important sector of decentralized network infrastructure, addressing critical performance needs for DeFi and Web 3.0 applications. The token's governance and staking utility provide fundamental use cases within the Marlin ecosystem. However, investors should carefully weigh the long-term potential against significant short-term headwinds, including substantial price depreciation over the past year, limited market capitalization, and competitive pressures in the infrastructure space.
POND Investment Recommendations
✅ Beginners: Consider starting with small allocations (no more than 1-2% of crypto portfolio) to understand token dynamics and network development before increasing exposure
✅ Experienced Investors: Conduct thorough due diligence on Marlin's network metrics, partnership developments, and competitive positioning; consider dollar-cost averaging during accumulation phases
✅ Institutional Investors: Evaluate POND as part of a diversified infrastructure thesis, with appropriate risk controls and ongoing monitoring of protocol adoption metrics
POND Trading Participation Methods
- Spot Trading: Purchase POND directly on Gate.com with support for multiple trading pairs, allowing for straightforward position building
- Staking Participation: Engage with Marlin network by staking POND tokens to support node operations and earn protocol rewards
- Portfolio Integration: Include POND as a complementary holding within a broader Web 3.0 infrastructure allocation strategy
Cryptocurrency investment carries extremely high risks, and this article does not constitute investment advice. Investors should make cautious decisions based on their own risk tolerance and are advised to consult professional financial advisors. Never invest more than you can afford to lose.
FAQ
What is POND token and what are its uses and functions?
POND is the native governance token of Marlin Protocol, enabling decentralized network participation and resource coordination. It facilitates validator staking, governance voting, and incentivizes protocol contributions within the Web3 infrastructure ecosystem.
What are the main factors affecting POND price?
POND price is primarily influenced by market demand and trading volume, ecosystem development progress, token utility and adoption rate, overall crypto market sentiment, and macroeconomic conditions. Community engagement and partnership announcements also significantly impact price movements.
How to conduct POND price predictions? What analysis methods are available?
POND price prediction employs technical analysis(examining charts and trading volume), fundamental analysis(evaluating project developments and adoption), and market sentiment analysis. Combine these methods with on-chain metrics and historical price trends for comprehensive forecasting.
What distinguishes POND from other Layer 2 or blockchain infrastructure tokens?
POND focuses on decentralized data infrastructure and privacy-preserving computation, differentiating it from typical Layer 2 solutions through its unique approach to data availability and computational efficiency within the web3 ecosystem.
What risks should I pay attention to when investing in POND tokens?
POND token risks include market volatility, liquidity fluctuations, regulatory changes, and project execution uncertainties. Monitor trading volume trends and diversify your portfolio accordingly.
POND has demonstrated steady growth trajectory with increasing adoption. Market liquidity remains strong with substantial daily trading volume, supporting efficient price discovery and market depth for investors seeking exposure to the ecosystem.
* The information is not intended to be and does not constitute financial advice or any other recommendation of any sort offered or endorsed by Gate.