# CHO vs XTZ: A Comprehensive Comparison of Two Leading Blockchain Platforms and Their Investment Potential
This comprehensive guide compares Choise (CHO) and Tezos (XTZ), two distinct blockchain assets with divergent market trajectories and investment narratives. From historical price analysis revealing CHO's 99.83% depreciation versus XTZ's 44.95% decline, to tokenomics, technology ecosystems, and 2026-2030 price forecasts, this article provides investors with critical market intelligence. Whether you're a beginner seeking stable infrastructure plays or an experienced trader exploring recovery opportunities, discover which platform aligns with your investment strategy through detailed risk assessment, liquidity analysis on Gate, and institutional adoption comparisons. Navigate the extreme market volatility with evidence-based insights on CHO's emerging B2B enterprise positioning and XTZ's established formal verification security features.
---
## Article Structure Overview:
**I. Price History & Market St
Introduction: CHO vs XTZ Investment Comparison
In the cryptocurrency market, comparisons between Choise (CHO) and Tezos (XTZ) represent two distinctly different investment narratives. The two assets differ significantly in market capitalization ranking, application scope, and price performance, embodying different positions within the crypto asset ecosystem.
Choise (CHO): Launched in 2017, Choise.ai has established itself as a pioneering B2B enterprise operations platform in blockchain, offering digital crypto banking services, crypto cards for daily spending, cross-chain DEX solutions, and AI-powered enhancements for the cryptocurrency ecosystem.
Tezos (XTZ): Since its inception, Tezos has been recognized as a decentralized blockchain that simplifies formal verification through a self-governing digital federation, mathematically ensuring transaction code accuracy and improving smart contract security.
This article will comprehensively analyze the investment value comparison between CHO and XTZ across historical price trends, supply mechanisms, market adoption, technical ecosystems, and future trajectories, while addressing the question most investors want answered:
"Which is the better buy right now?"
I. Price History Comparison and Current Market Status
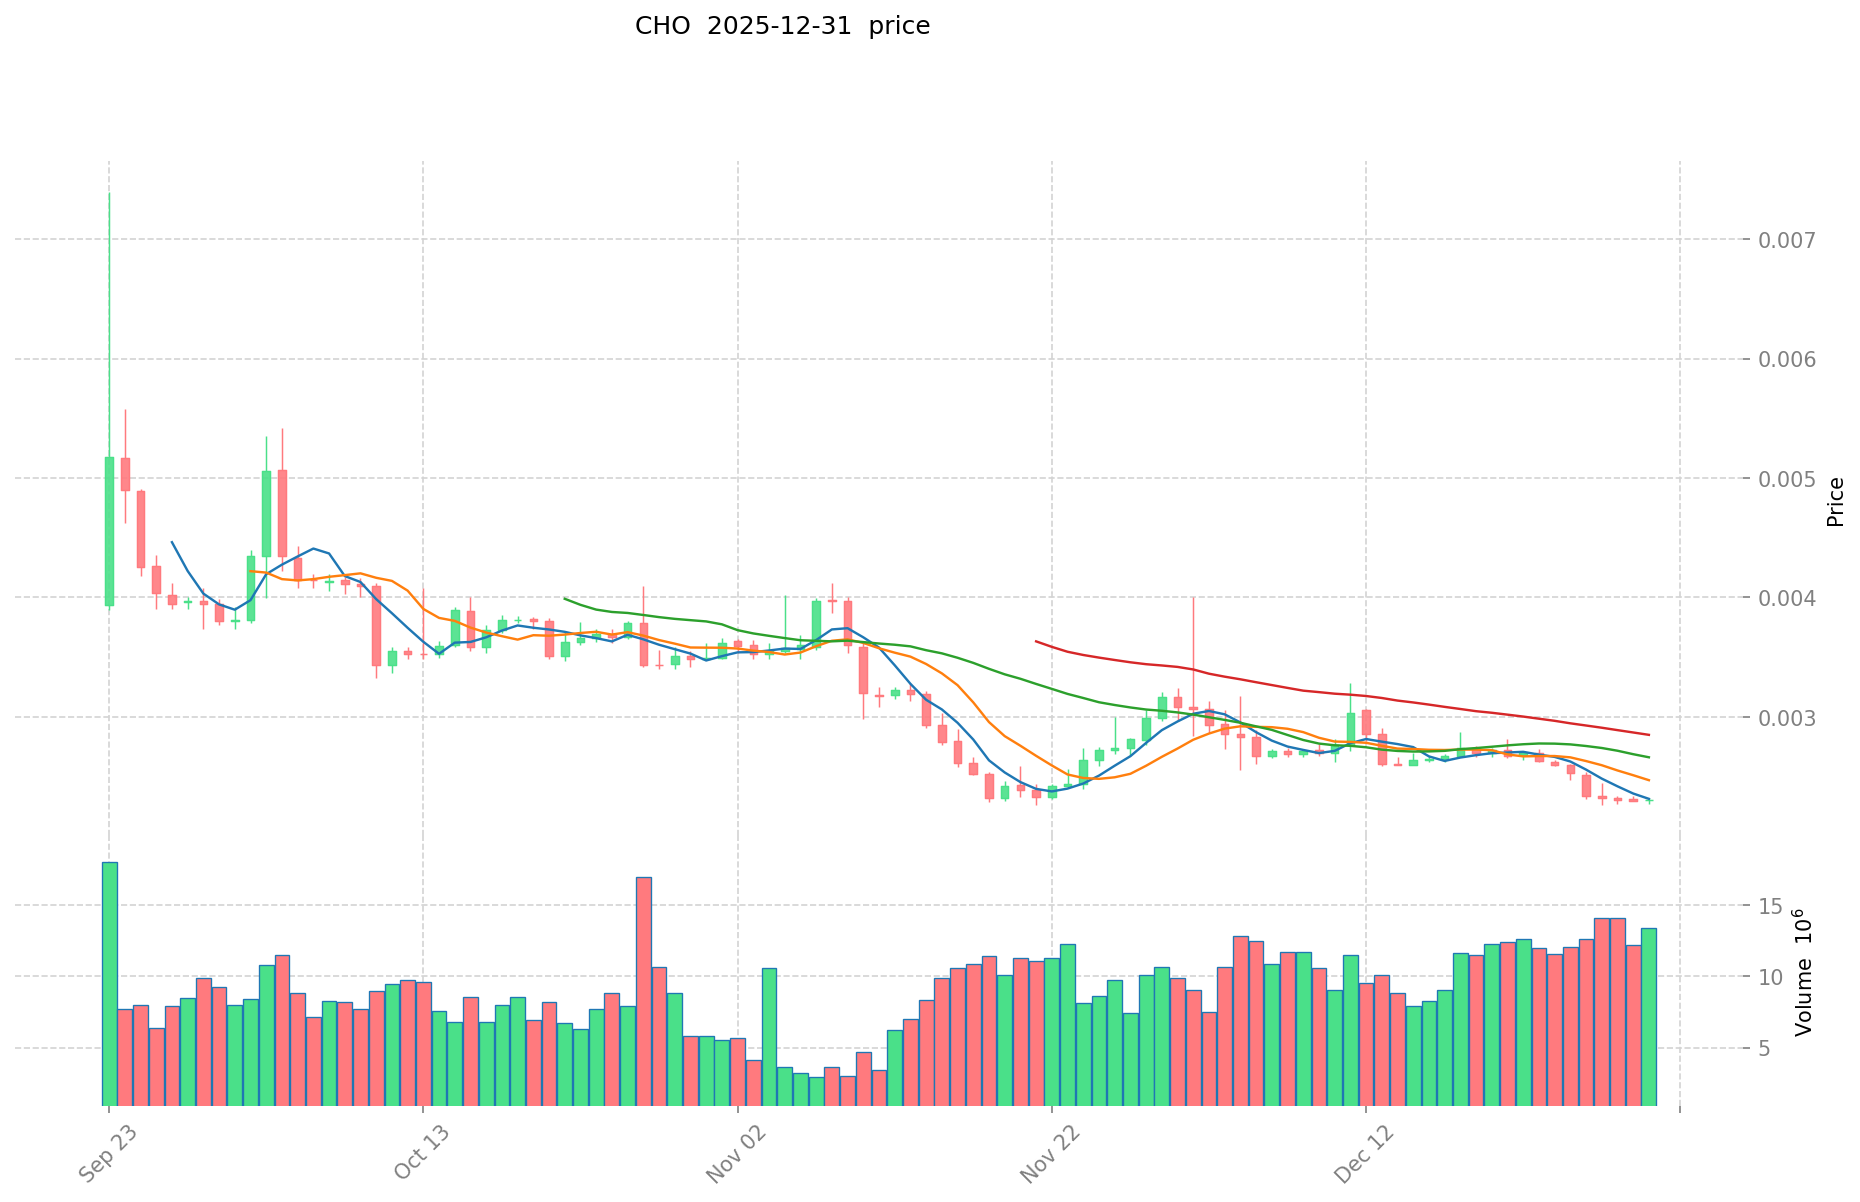
- 2022: Choise.com (CHO) reached its all-time high of $1.38 on September 1, 2022, marking its peak valuation in the market.
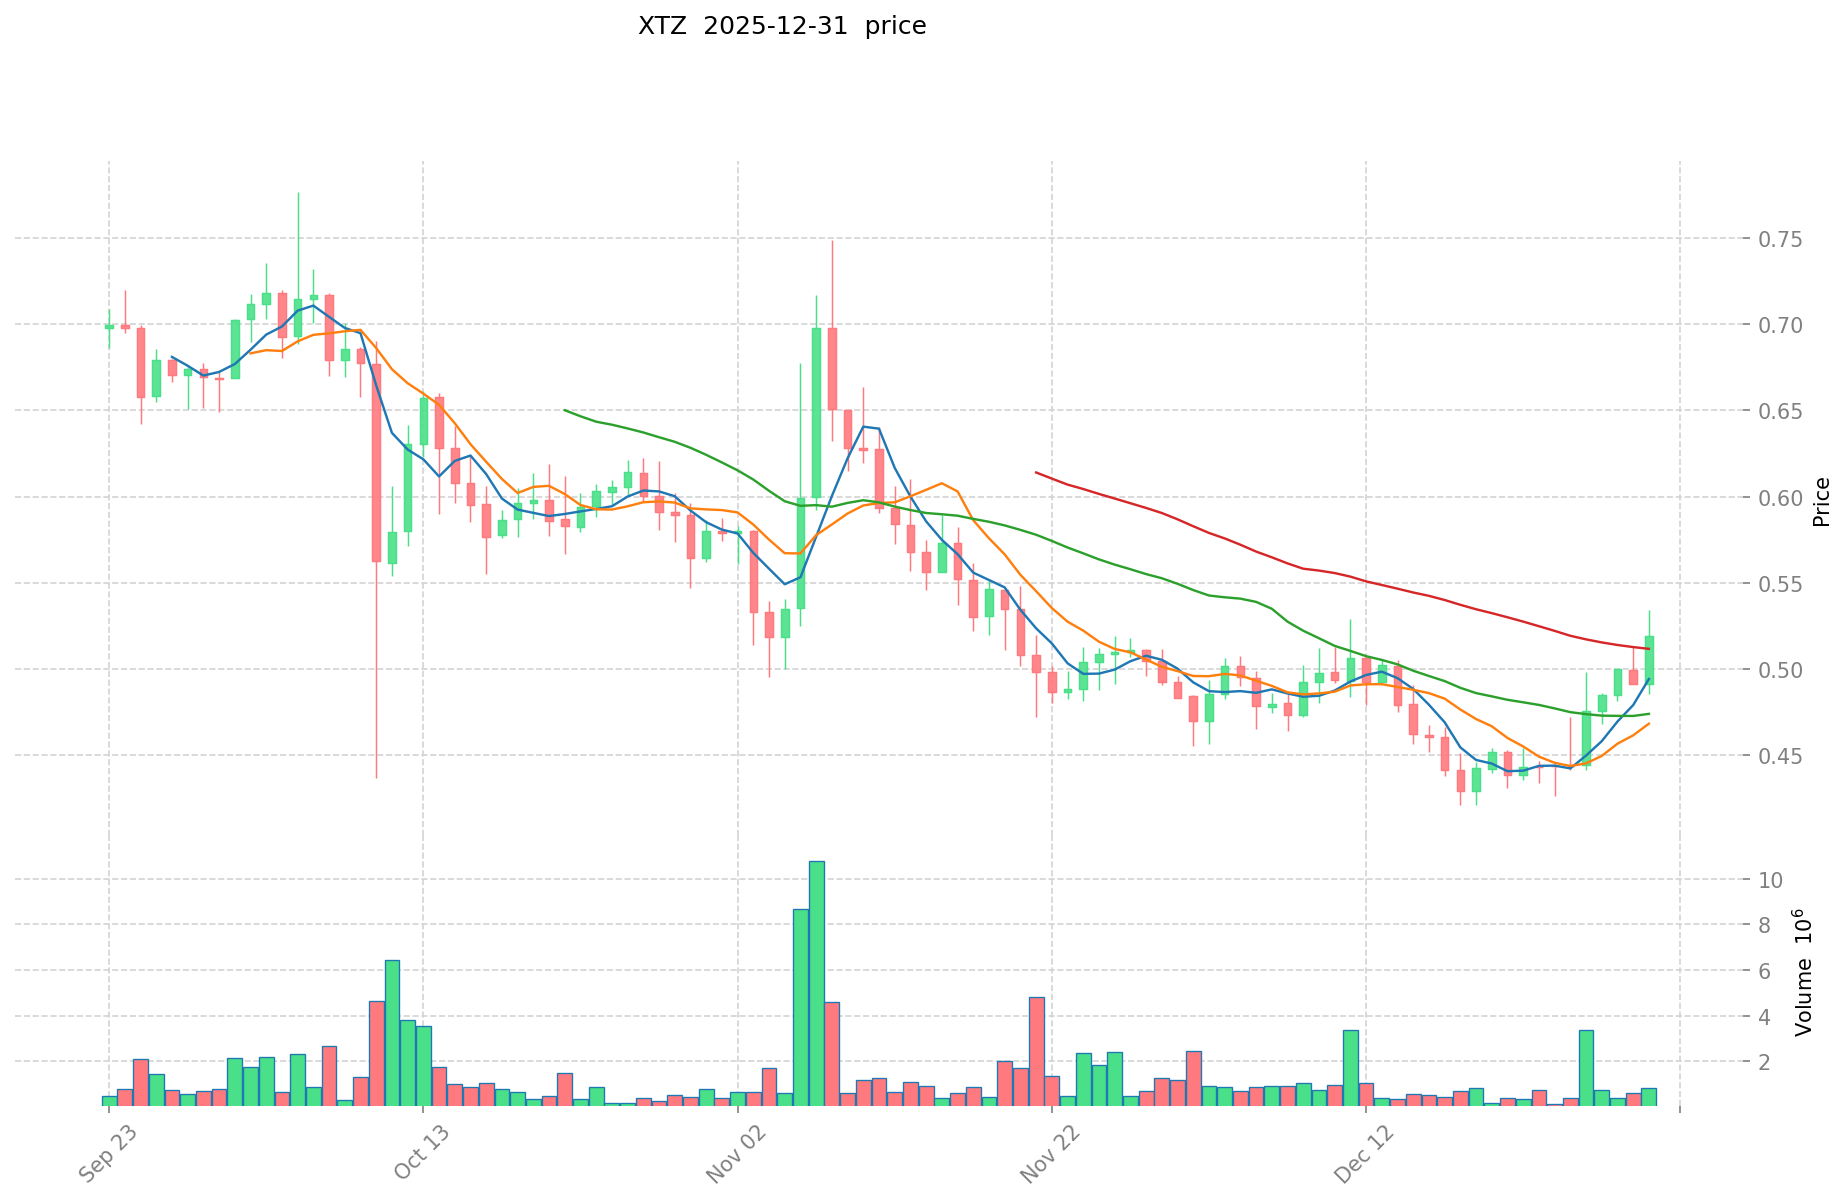
- 2021: Tezos (XTZ) achieved its all-time high of $9.12 on October 4, 2021, representing the strongest performance in its trading history.
- Comparative analysis: From their respective peaks, CHO has declined from $1.38 to $0.002279 as of January 1, 2026, representing a 99.83% depreciation, while XTZ has decreased from $9.12 to $0.5017, representing a 44.95% decline over the same period.
Current Market Status (January 1, 2026)
- Choise.com (CHO) current price: $0.002279
- Tezos (XTZ) current price: $0.5017
- 24-hour trading volume: CHO $30,229.68 vs XTZ $914,426.66
- Market Sentiment Index (Fear & Greed Index): 21 (Extreme Fear)
View real-time prices:
II. Core Factors Influencing CHO vs XTZ Investment Value
Tokenomics and Supply Mechanism Comparison
Based on available reference materials, specific tokenomics details for CHO and XTZ are not comprehensively documented in the provided sources. The reference data indicates CHO exchange rate information (1 CHO = 0.1982 RUB with 24-hour volatility of -3.75%), but lacks detailed supply mechanism comparisons between the two assets.
Institutional Adoption and Market Application
- Institutional Holdings: Reference materials do not provide sufficient data on institutional positioning differences between CHO and XTZ.
- Enterprise Adoption: Specific use cases for CHO and XTZ in cross-border payments, settlement, and investment portfolio allocation are not detailed in the available sources.
- National Policy: Regulatory treatment of both tokens across different jurisdictions is not addressed in the provided reference materials.
Technology Development and Ecosystem Construction
Detailed technical specifications, upgrade roadmaps, and ecosystem comparisons for CHO and XTZ are not covered in the reference data. Information regarding DeFi, NFT, payment, and smart contract implementations for either token is unavailable.
Macroeconomic Conditions and Market Cycles
- Inflation Environment: Comparative analysis of inflation-resistant properties between CHO and XTZ cannot be determined from the provided sources.
- Monetary Policy Impact: Effects of interest rates and US dollar index movements on both assets are not documented in the reference materials.
- Geopolitical Factors: Cross-border transaction demand implications and international situation impacts are not addressed in available data.
III. 2026-2030 Price Forecast: CHO vs XTZ
Short-term Forecast (2026)
- CHO: Conservative $0.00176-$0.00267 | Bullish $0.00267-$0.00318
- XTZ: Conservative $0.502-$0.518 | Bullish $0.518-$0.725
Medium-term Forecast (2027-2028)
- CHO may enter accumulation phase, expected price range $0.00234-$0.00382
- XTZ may enter growth phase, expected price range $0.491-$0.828
- Key drivers: institutional capital inflows, ETF adoption, ecosystem development
Long-term Forecast (2029-2030)
- CHO: Base case $0.00183-$0.00352 | Bullish case $0.00497-$0.00467
- XTZ: Base case $0.630-$0.863 | Bullish case $0.989-$1.274
View CHO and XTZ detailed price prediction
CHO:
| 年份 |
预测最高价 |
预测平均价格 |
预测最低价 |
涨跌幅 |
| 2025 |
0.00305922 |
0.002283 |
0.00116433 |
0 |
| 2026 |
0.0031786209 |
0.00267111 |
0.0017629326 |
17 |
| 2027 |
0.0035390871945 |
0.00292486545 |
0.00233989236 |
28 |
| 2028 |
0.003813732060255 |
0.00323197632225 |
0.00193918579335 |
41 |
| 2029 |
0.004967224409666 |
0.003522854191252 |
0.001831884179451 |
54 |
| 2030 |
0.004669543230505 |
0.004245039300459 |
0.002801725938303 |
86 |
XTZ:
| 年份 |
预测最高价 |
预测平均价格 |
预测最低价 |
涨跌幅 |
| 2025 |
0.535535 |
0.5005 |
0.41041 |
0 |
| 2026 |
0.7252245 |
0.5180175 |
0.502476975 |
3 |
| 2027 |
0.65270205 |
0.621621 |
0.49108059 |
23 |
| 2028 |
0.8283099825 |
0.637161525 |
0.55433052675 |
27 |
| 2029 |
0.9891932675625 |
0.73273575375 |
0.630152748225 |
46 |
| 2030 |
1.27422747577125 |
0.86096451065625 |
0.51657870639375 |
71 |
IV. Investment Strategy Comparison: CHO vs XTZ
Long-term vs Short-term Investment Strategy
- CHO: Suitable for investors seeking exposure to emerging B2B blockchain enterprise solutions and AI-powered cryptocurrency ecosystem enhancements, with tolerance for high volatility and potential recovery from significant depreciation
- XTZ: Suitable for investors prioritizing established blockchain infrastructure with formal verification capabilities and self-governing mechanisms, seeking relatively more stable value preservation
Risk Management and Asset Allocation
- Conservative investors: CHO 5% vs XTZ 20%
- Aggressive investors: CHO 15% vs XTZ 30%
- Hedging tools: Stablecoin allocation, options strategies, cross-asset diversification with major cryptocurrencies
V. Potential Risk Comparison
Market Risk
- CHO: Extreme depreciation of 99.83% from all-time high indicates severe liquidity challenges and market rejection; significantly lower 24-hour trading volume ($30,229.68) presents substantial exit liquidity risk
- XTZ: Moderate depreciation of 44.95% from peak reflects market maturation; higher trading volume ($914,426.66) provides better liquidity conditions
Technology Risk
- CHO: Limited reference data on technical specifications, network stability, and upgrade roadmap documentation
- XTZ: Formal verification mechanisms mathematically ensure transaction code accuracy; established self-governing governance structure reduces unilateral development risks
Regulatory Risk
- Global regulatory policies affecting both tokens remain uncertain; jurisdiction-specific treatment differences between enterprise-focused (CHO) and infrastructure-focused (XTZ) blockchain platforms may diverge as regulatory frameworks mature
VI. Conclusion: Which Is the Better Buy?
📌 Investment Value Summary:
- CHO Advantages: Pioneering B2B enterprise operations platform positioning, digital crypto banking and cross-chain DEX service offerings, potential recovery upside from extreme depreciation levels
- XTZ Advantages: Established market presence since inception, formal verification security features, higher market liquidity, demonstrated price stability relative to CHO, recognized smart contract reliability
✅ Investment Recommendations:
- Beginner investors: Allocate higher weighting to XTZ due to established infrastructure, lower volatility, and superior liquidity conditions; maintain minimal CHO exposure for speculative upside potential only
- Experienced investors: Consider tactical CHO positions as high-risk recovery plays with strict stop-loss discipline; maintain core XTZ holdings for portfolio stability and reduced drawdown risk
- Institutional investors: XTZ presents more suitable risk-adjusted return profile for portfolio inclusion; CHO lacks sufficient institutional adoption data and market depth for meaningful allocation
⚠️ Risk Disclaimer: The cryptocurrency market exhibits extreme volatility. This article does not constitute investment advice. All investment decisions should be made independently based on individual risk tolerance, investment horizon, and financial circumstances.
FAQ
CHO和XTZ分别是什么?它们各自的核心功能和定位是什么?
CHO是CMS Holdings创始合伙人兼主席,专注于加密资产投资。XTZ是Cosmos链上的原生代币,用于网络运营、治理和交易费用支付,具有强大的链上治理机制。
CHO和XTZ在技术架构上有什么主要区别?
CHO采用混合区块链模型,结合权益证明和权威证明机制,而XTZ采用独特的权益证明共识机制,两者在验证器设计和共识结构上存在显著差异。
CHO和XTZ的共识机制分别是什么?哪个更安全/高效?
CHO采用权益证明(PoS)机制,XTZ采用液态权益证明(LPoS)机制。LPoS更具优势,提供更高的安全性和运行效率,支持灵活的代币委托管理,降低参与门槛。
CHO和XTZ的应用场景和生态发展现状如何对比?
CHO主要应用于去中心化交易和DeFi生态,XTZ是Tezos链的原生代币,在智能合约和治理领域应用。XTZ生态相对成熟,CHO处于快速发展阶段,两者都在扩展应用场景。
从投资角度看,CHO和XTZ各自的风险和优势是什么?
CHO优势在高增长潜力,风险在技术未成熟。XTZ优势在技术创新和生态完善,风险在市场波动大。两者都需关注政策风险和流动性。
CHO和XTZ的团队背景、融资情况和市场认可度如何对比?
CHO和XTZ团队背景及融资详情资料有限。XTZ作为较早期的项目,具有一定的市场认可度和社区基础。CHO的市场表现与认可度因项目阶段和市场周期而异,两者投资者信心差异主要受各自生态发展影响。
* The information is not intended to be and does not constitute financial advice or any other recommendation of any sort offered or endorsed by Gate.