Порівняйте FORTH із XLM: досліджуйте токен управління та протоколи для транскордонних платежів, ринкову капіталізацію (19,8 млн доларів США та 6,85 млрд доларів США), прогнози ціни до 2031 року, інвестиційні стратегії та характер ризиків. Повний аналіз монет на Gate.
Вступ: Порівняння інвестицій у FORTH та XLM
На ринку криптовалют порівняння FORTH та XLM стабільно залишається у фокусі уваги інвесторів. Ці два активи суттєво відрізняються за рейтингом ринкової капіталізації, сценаріями застосування та динамікою цін, що відображає їх різне позиціонування в екосистемі цифрових активів.
FORTH: Від моменту запуску у 2021 році FORTH закріпився як токен управління в екосистемі протоколу Ampleforth, працює на мережі Ethereum та використовується у DeFi-кредитуванні й управлінні протоколом.
XLM (Stellar): Запущений у 2014 році, XLM позиціонує себе як інструмент для міжнародних платежів, створює децентралізований міст між цифровими та фіатними валютами, забезпечуючи швидкі та недорогі перекази між банками, платіжними установами та фізичними особами.
У цій статті подано всебічний аналіз інвестиційної цінності FORTH та XLM за кількома напрямами: історичні цінові тренди, механізми емісії, інституційне впровадження, технологічна екосистема та прогнози на майбутнє. Мета — відповісти на ключове для інвесторів питання:
"Який із них вигідніше придбати зараз?"
I. Порівняння історії цін і ринкового статусу
FORTH (Монета А) і XLM (Монета B): історичні цінові тренди
- 2021: Після запуску FORTH відзначився значним ціновим зростанням, досягнувши історичного максимуму $180,47 22 квітня 2021 року.
- 2018: XLM досяг історичного максимуму $0,875563 3 січня 2018 року в період загального ринкового зростання.
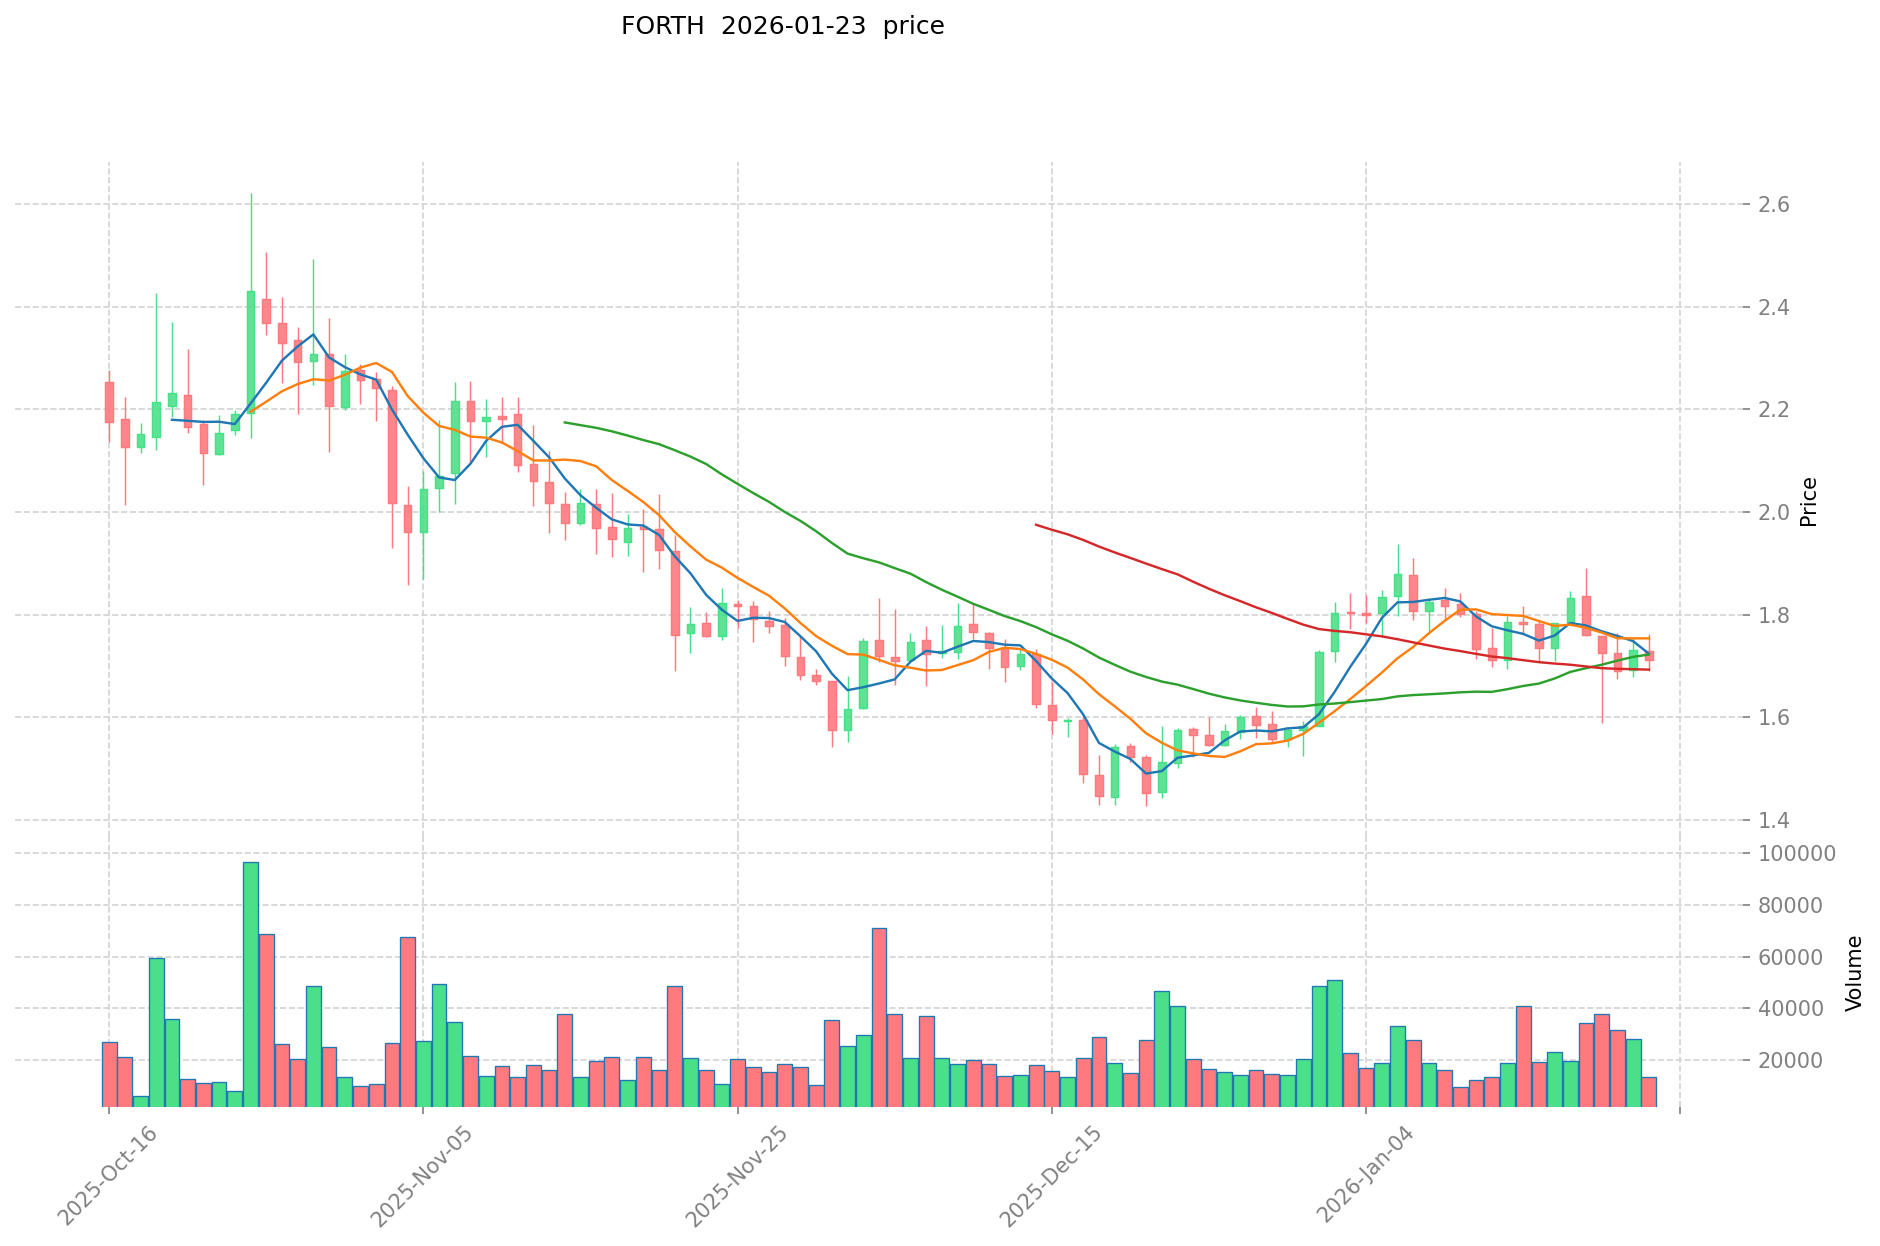
- 2025: FORTH зафіксував історичний мінімум $1,17 11 жовтня 2025 року, відобразивши суттєве падіння з пікових рівнів.
- 2015: XLM встановив історичний мінімум $0,00047612 5 березня 2015 року під час раннього етапу розвитку.
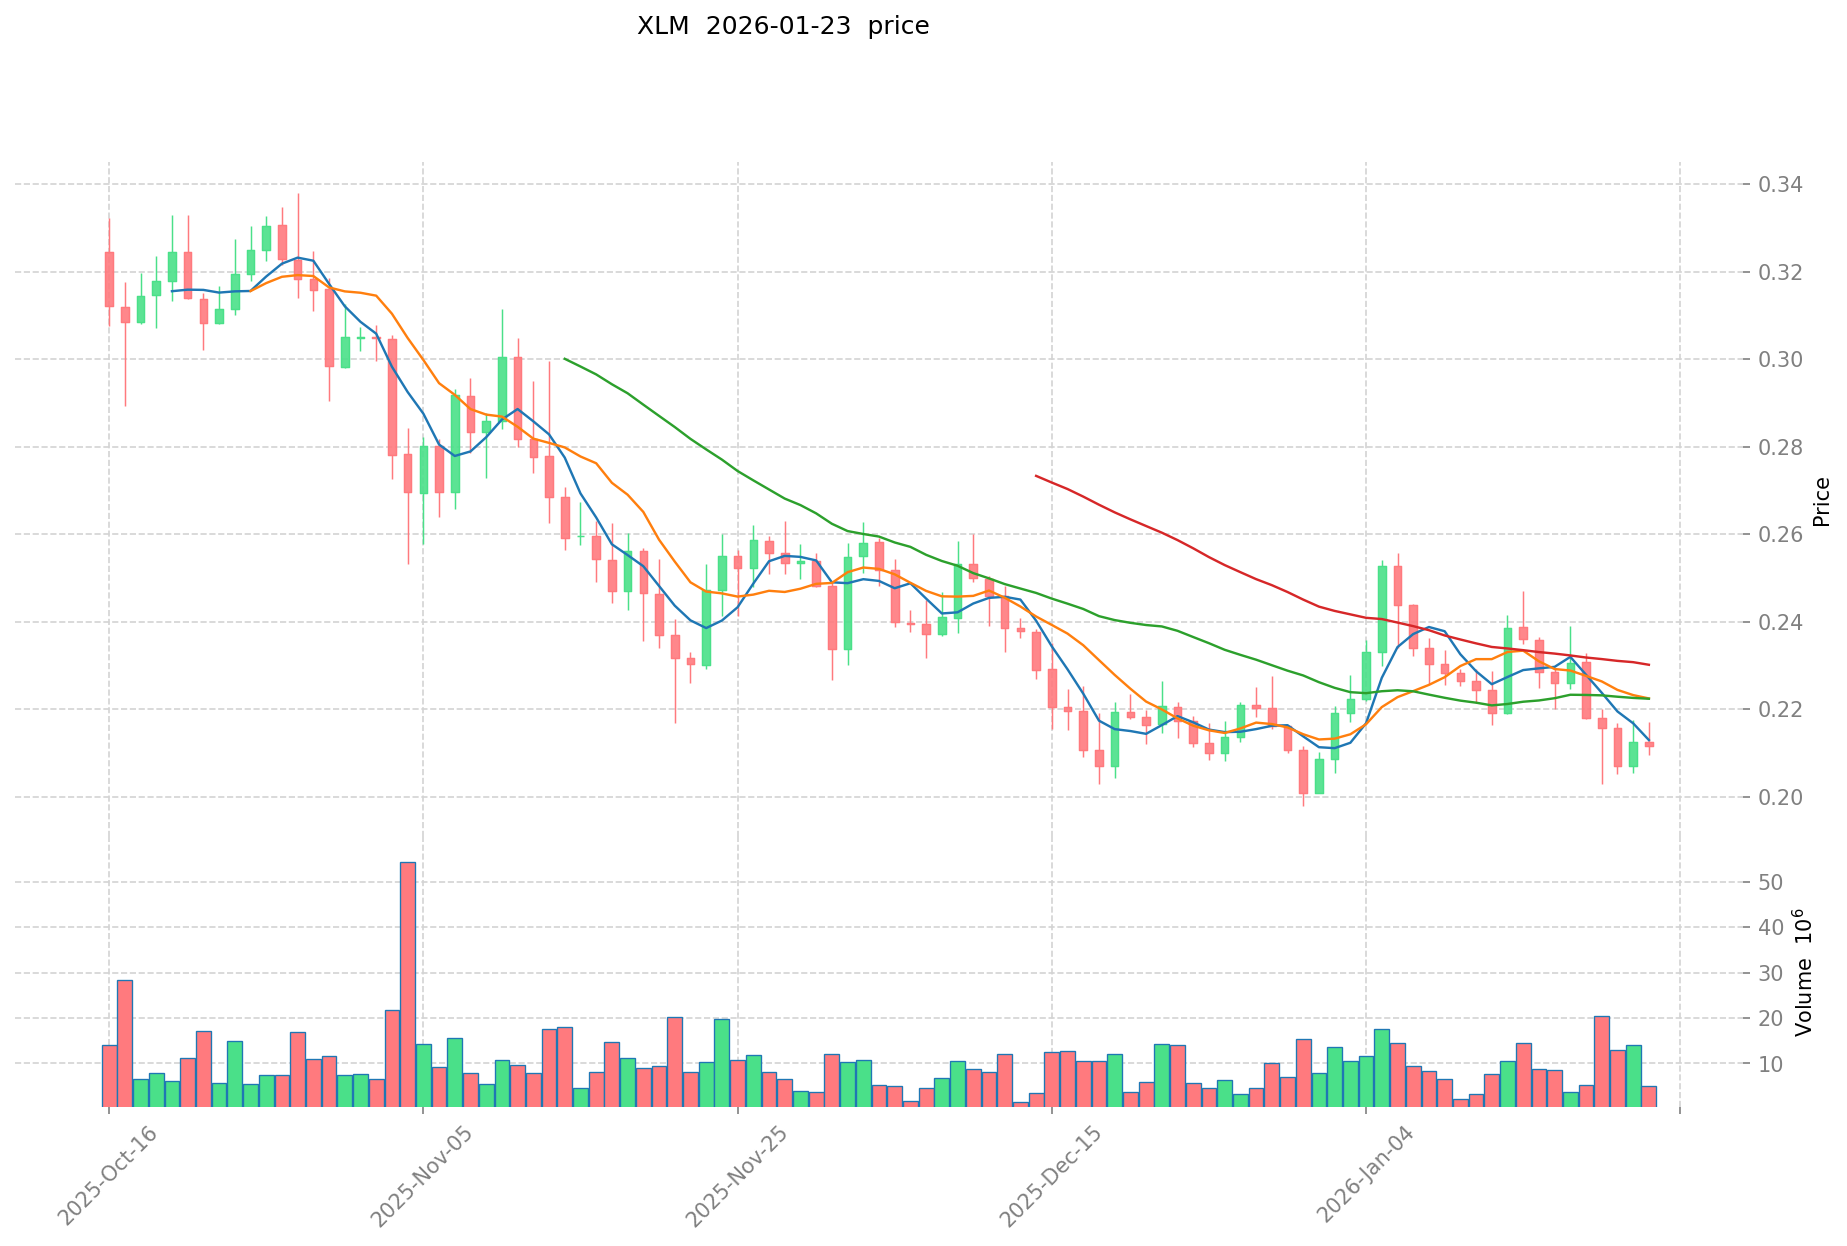
- Порівняльний аналіз: У ринковому циклі з 2021 року FORTH знизився з $180,47 до поточного рівня $1,722 (падіння понад 99%). Натомість XLM продемонстрував відносну стабільність, торгуючись на рівні $0,21137 після зниження з пікового значення $0,875563 у 2018 році (скорочення приблизно на 76% від історичного максимуму).
Поточний ринковий статус (23 січня 2026 року)
- Поточна ціна FORTH: $1,722
- Поточна ціна XLM: $0,21137
- Обсяг торгів за 24 години: FORTH — $22 526,33, XLM — $1 025 028,30
- Ринкова капіталізація: FORTH — $19 809 106,98, XLM — $6 852 992 557,58
- Індекс ринкових настроїв (Fear & Greed Index): 24 (Екстремальний страх)
- Динаміка ціни за 24 години: FORTH знизився на 1,08%, XLM — на 1,29%
- Тижнева динаміка (7 днів): FORTH знизився на 1,09%, XLM — на 7,00%
- Місячна динаміка (30 днів): FORTH зріс на 11,64%, XLM знизився на 1,13%
- Річна динаміка (1 рік): FORTH знизився на 62,71%, XLM — на 50,56%
Переглянути ціни в реальному часі:
II. Ключові фактори, що впливають на інвестиційну цінність FORTH і XLM
Порівняння механізмів емісії (токеноміка)
Через відсутність деталізованих даних щодо токеноміки у наданих матеріалах повноцінне порівняння механізмів емісії наразі неможливе.
Інституційне впровадження та ринкове застосування
Без конкретної інформації про інституційні портфелі, корпоративне впровадження або регуляторний статус у різних юрисдикціях порівняльний аналіз інституційних переваг і практичного використання залишаються відкритими.
Розвиток технологій та екосистеми
У наявних матеріалах недостатньо інформації щодо технічних оновлень, дорожніх карт розвитку чи екосистемної активності для обох активів. Тому оцінити їх позиції в DeFi-інфраструктурі, платіжних системах або реалізації смартконтрактів неможливо з достатньою точністю.
Макроекономічне середовище та ринкові цикли
Без історичних даних щодо поведінки активів в умовах різних макроекономічних факторів оцінити їх характеристики в періоди інфляції, змін монетарної політики чи геополітичних подій можна лише за результатами додаткових досліджень, які виходять за межі цих матеріалів.
III. Прогноз ціни на 2026–2031: FORTH проти XLM
Короткостроковий прогноз (2026)
- FORTH: Консервативний $0,93–$1,73 | Оптимістичний $1,73–$2,25
- XLM: Консервативний $0,16–$0,21 | Оптимістичний $0,21–$0,28
Середньостроковий прогноз (2028–2029)
- FORTH може перейти у фазу консолідації з орієнтовним ціновим діапазоном $1,73–$3,93 і потенційним зростанням до 2029 року
- XLM може демонструвати поступове зростання в діапазоні $0,27–$0,41, що відображає стабільну ринкову інтеграцію
- Основні драйвери: інституційний капітал, розвиток ETF, розширення екосистеми
Довгостроковий прогноз (2030–2031)
- FORTH: Базовий сценарій $2,43–$3,46 | Оптимістичний сценарій $3,29–$4,76
- XLM: Базовий сценарій $0,19–$0,42 | Оптимістичний сценарій $0,37–$0,56
Переглянути детальні прогнози цін FORTH і XLM
Відмова від відповідальності: Прогнози цін базуються на аналізі історичних даних та ринкових тенденцій. Ринок криптовалют відзначається високою волатильністю й непередбачуваністю. Прогнози не є фінансовою порадою чи гарантією майбутніх результатів.
FORTH:
| Рік |
Максимальна прогнозна ціна |
Середня прогнозна ціна |
Мінімальна прогнозна ціна |
Зміна ціни |
| 2026 |
2,2451 |
1,727 |
0,93258 |
0 |
| 2027 |
2,820191 |
1,98605 |
1,6087005 |
15 |
| 2028 |
2,907775805 |
2,4031205 |
2,11474604 |
39 |
| 2029 |
3,9300632657 |
2,6554481525 |
1,726041299125 |
54 |
| 2030 |
3,457393494555 |
3,2927557091 |
2,535421896007 |
91 |
| 2031 |
4,758855188576775 |
3,3750746018275 |
2,4300537133158 |
95 |
XLM:
| Рік |
Максимальна прогнозна ціна |
Середня прогнозна ціна |
Мінімальна прогнозна ціна |
Зміна ціни |
| 2026 |
0,2794968 |
0,21174 |
0,1566876 |
0 |
| 2027 |
0,33158484 |
0,2456184 |
0,191582352 |
16 |
| 2028 |
0,389612187 |
0,28860162 |
0,2655134904 |
36 |
| 2029 |
0,4069282842 |
0,3391069035 |
0,328933696395 |
60 |
| 2030 |
0,417779705112 |
0,37301759385 |
0,193969148802 |
76 |
| 2031 |
0,56146608226302 |
0,395398649481 |
0,37958270350176 |
87 |
IV. Порівняння інвестиційних стратегій: FORTH проти XLM
Довгострокові проти короткострокових інвестиційних стратегій
- FORTH: Може зацікавити інвесторів із високим рівнем ризику, які шукають можливості у DeFi-сегменті з акцентом на управління, враховуючи його невелику ринкову капіталізацію ($19,8 млн) і суттєве падіння з історичних максимумів. Актив продемонстрував місячне зростання 11,64%, попри тривалу негативну динаміку.
- XLM: Може бути привабливим для інвесторів, які орієнтуються на платіжну інфраструктуру для міжнародних переказів і усталене ринкове позиціонування — завдяки більшій ринковій капіталізації ($6,85 млрд) і відносній стабільності в порівнянні з новими токенами протоколів. Актив має ширше визнання серед інституційних учасників платіжного ринку.
Управління ризиками та алокація активів
- Консервативні інвестори: Алокація FORTH 5–10% проти XLM 90–95% може відображати суттєву різницю в капіталізації, глибині ліквідності (24-годинний обсяг $22 526 проти $1 025 028) та історичній волатильності.
- Інвестори, орієнтовані на зростання: Алокація FORTH 20–30% проти XLM 70–80% може забезпечити участь у потенційному відновленні при збереженні основної частки в більш усталених активах.
- Інструменти хеджування: Диверсифікація між стейблкоїнами, деривативами (за наявності) та крос-активними портфелями сприяє зменшенню концентраційних ризиків у криптоінвестиціях.
V. Порівняння потенційних ризиків
Ринкові ризики
- FORTH: Відзначається значною ціновою волатильністю — зниження понад 99% з максимуму $180,47 у квітні 2021 року до поточного рівня близько $1,72. Обсяги торгів ($22 526 на добу) обмежують ліквідність у періоди ринкового стресу. За рік — падіння на 62,71%.
- XLM: Має відносно нижчу волатильність порівняно з менш капіталізованими активами, проте також чутливий до загальних ринкових циклів криптовалют. За рік актив знизився на 50,56%, тижневе зниження — 7%. Індекс настроїв зараз на рівні 24 (Екстремальний страх), що може негативно впливати на короткострокову цінову динаміку.
Технічні ризики
- FORTH: Функціонує на інфраструктурі Ethereum і залежить як від переваг, так і від обмежень цієї мережі. Для підтримки протоколу управління потрібна постійна активність спільноти та впровадження у DeFi-кредитуванні.
- XLM: Ефективність мережі залежить від консенсусу валідаторів і темпів впровадження у сфері міжнародних платежів. Інтеграція з фінансовими установами та платіжними провайдерами є можливістю, але й створює додаткову операційну залежність.
Регуляторні ризики
- Обидва активи перебувають під впливом змінних регуляторних режимів у різних країнах. XLM як платіжний інструмент може привертати увагу фінансових регуляторів і банків. FORTH як токен управління може бути класифікований як цінний папір у певних юрисдикціях. Світові політики щодо торгівлі, зберігання та інституційної участі можуть по-різному впливати на обидва активи залежно від їхніх сценаріїв використання та ринкової позиції.
VI. Висновок: Який із них кращий для інвестування?
📌 Короткий підсумок інвестиційної цінності:
- FORTH: Токен управління в екосистемі Ampleforth на Ethereum. Поточна ринкова капіталізація $19,8 млн свідчить про підвищений ризик. Прогнози варіюються в діапазоні $0,93–$4,76 до 2031 року, що свідчить про суттєву ринкову невизначеність.
- XLM: Інструмент для міжнародних платежів із усталеним ринковим статусом з 2014 року. Капіталізація $6,85 млрд свідчить про ширше ринкове прийняття. Прогнози — $0,16–$0,56 до 2031 року, що демонструє помірніші очікування зростання порівняно з поточним рівнем.
✅ Інвестиційні міркування:
- Початківці: Варто віддавати перевагу активам із більшою капіталізацією, вищою ліквідністю та перевіреною історією. Орієнтація XLM на платіжну інфраструктуру та ринковий статус може відповідати стратегії управління ризиками на початковому етапі формування криптопортфеля.
- Досвідчені інвестори: Можуть розглядати алокацію як у зрілих платіжних протоколах, так і в токенах управління, орієнтуючись на власний ризик-профіль, портфельні цілі та ринкові очікування. Диверсифікація між різними категоріями активів та сценаріями використання забезпечить збалансовану експозицію.
- Інституційні учасники: Можуть оцінювати активи з огляду на регуляторну прозорість, доступність рішень для зберігання, глибину ліквідності та відповідність інституційним мандатам. Ключові критерії — ринкова інфраструктура, відносини з контрагентами й стандарти комплаєнсу.
⚠️ Розкриття ризиків: Ринок криптовалют відзначається суттєвою волатильністю й непередбачуваністю. Попередні результати не гарантують майбутніх. Прогнози цін мають характер аналітичних оцінок із високою невизначеністю. Даний матеріал не є фінансовою порадою, рекомендацією чи закликом до купівлі або продажу активів. Учасники повинні самостійно досліджувати ринок, оцінювати власну толерантність до ризику та консультуватися з кваліфікованими фінансовими радниками перед прийняттям інвестиційних рішень.
VII. Поширені запитання
Q1: Які основні відмінності у сферах застосування FORTH та XLM?
FORTH виконує передусім функцію токена управління у DeFi-протоколі Ampleforth на Ethereum, зосереджуючись на кредитуванні та прийнятті рішень щодо розвитку протоколу. XLM функціонує як інструмент для міжнародних платежів, з’єднує цифрові валюти з фіатними системами та забезпечує швидкі й недорогі перекази між фінансовими установами та приватними особами. Головна відмінність — орієнтація FORTH на управління DeFi протоколом, тоді як XLM фокусується на платіжній інфраструктурі.
Q2: Який з активів історично мав кращу цінову стабільність?
XLM характеризується кращою ціновою стабільністю, ніж FORTH. XLM знизився на 76% з максимуму $0,875563 у 2018 році до $0,21137, а FORTH — більш ніж на 99% з піку $180,47 у квітні 2021 року до $1,72. Крім того, річне зниження XLM (50,56%) є меншим, ніж у FORTH (62,71%), що вказує на відносно нижчу волатильність.
Q3: Як порівнюються ринкові капіталізації FORTH і XLM?
XLM має ринкову капіталізацію $6,85 млрд, що приблизно у 346 разів перевищує показник FORTH ($19,8 млн) станом на 23 січня 2026 року. Це свідчить про ширше прийняття XLM, довший строк роботи (з 2014 року) й усталене позиціонування у криптоекосистемі. Різниця в капіталізації також визначає значну розбіжність у ліквідності та торгівельних обсягах.
Q4: Які прогнози цін для обох активів до 2031 року?
Для FORTH очікується діапазон $0,93–$4,76 до 2031 року: консервативна оцінка на 2026 рік — $0,93–$1,73, оптимістичний сценарій на 2031 рік — $3,29–$4,76. Для XLM — діапазон $0,16–$0,56 до 2031 року: консервативно на 2026 рік — $0,16–$0,21, оптимістично на 2031 рік — $0,37–$0,56. Прогнози мають значну невизначеність і не є гарантією результату.
Q5: Які відмінності в ліквідності FORTH і XLM?
XLM має набагато вищу ліквідність — 24-годинний обсяг торгів $1 025 028,30 проти $22 526,33 у FORTH (станом на 23 січня 2026 року). Це різниця у 45 разів, що забезпечує XLM кращу ліквідність, менші спреди, знижену ймовірність прослизання та кращу виконуваність великих ордерів без значного впливу на ціну.
Q6: Які ризики слід враховувати інвесторам щодо кожного активу?
FORTH має вищий ризик через екстремальну волатильність (99% зниження від максимуму), обмежену ліквідність, невелику ринкову капіталізацію та залежність від впровадження DeFi-протоколу. XLM має помірний ризик, відзначається нижчою волатильністю, усталеним статусом, більшими пулами ліквідності та впливом темпів впровадження міжнародних платежів і регуляторної уваги у фінансовому секторі. Обидва активи залишаються чутливими до загальних ринкових циклів і змін у регулюванні.
Q7: Який актив може бути доцільнішим для різних типів інвесторів?
Для початківців XLM є більш доцільним через більшу ринкову капіталізацію, вищу ліквідність, перевірену історію з 2014 року та зрозумілу платіжну інфраструктуру. Досвідчені інвестори з вищою толерантністю до ризику можуть розглядати FORTH для експозиції у DeFi-сегменті, оцінюючи алокацію в межах 5–30% залежно від стратегії. Інституційні учасники можуть віддавати перевагу XLM через регуляторну визначеність, рішення для зберігання та відповідність платіжній інфраструктурі, проте обидва активи вимагають детального аналізу.
Q8: Які поточні індикатори ринкових настроїв для цих активів?
Станом на 23 січня 2026 року індекс ринкових настроїв Fear & Greed становить 24 (Екстремальний страх). Короткострокова динаміка: FORTH — мінус 1,08% за 24 години, мінус 1,09% за 7 днів; XLM — мінус 1,29% за 24 години, мінус 7,00% за тиждень. За місяць FORTH зріс на 11,64%, XLM знизився на 1,13%, що свідчить про різну короткострокову динаміку на тлі загальної обережності ринку.
* Ця інформація не є фінансовою порадою чи будь-якою іншою рекомендацією, запропонованою чи схваленою Gate, і не є нею.