Nắm chắc các mẫu hình nến trong giao dịch crypto trên Gate. Học cách nhận diện nến xanh dài, các tín hiệu tăng hoặc giảm giá và các mô hình biểu đồ then chốt. Đây là tài liệu lý tưởng cho nhà giao dịch mới đến trung cấp mong muốn thành thạo phân tích kỹ thuật và dự báo xu hướng giá.
Biểu đồ nến là gì?
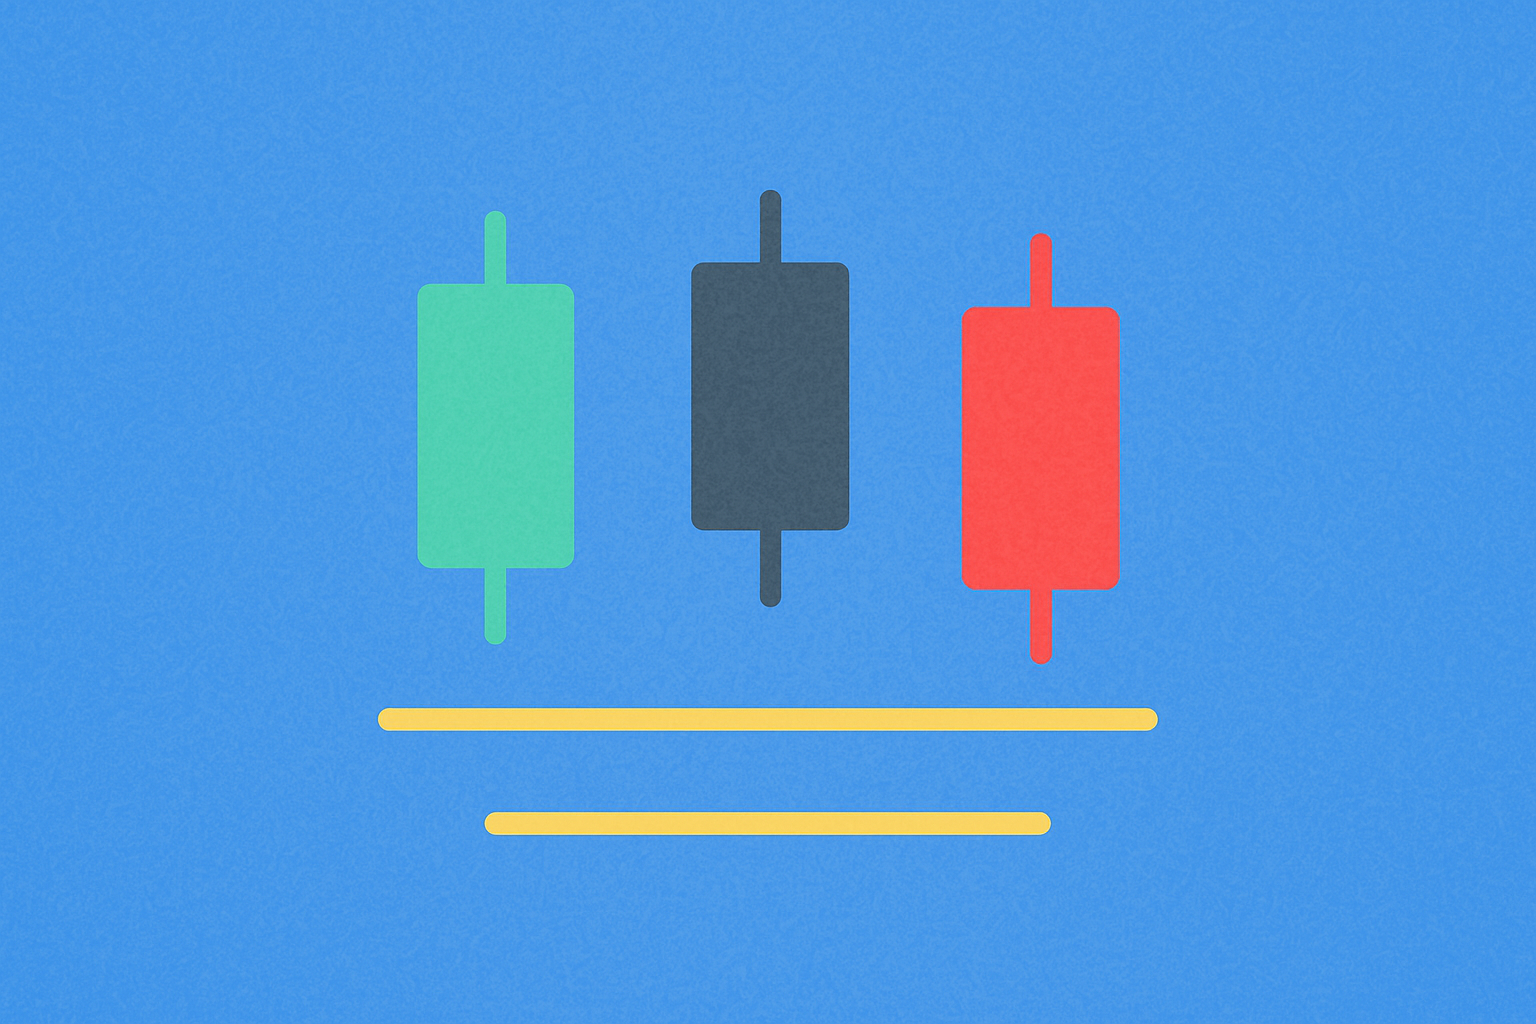
Biểu đồ nến đóng vai trò là công cụ trực quan giúp nhà đầu tư theo dõi biến động giá của tài sản (như cổ phiếu, tiền mã hóa, hoặc các sản phẩm tài chính khác) trong một khoảng thời gian xác định. Mỗi cây nến trên biểu đồ thể hiện bốn thông tin trọng yếu sau:
- Giá mở cửa: Giá tại thời điểm bắt đầu phiên giao dịch.
- Giá đóng cửa: Giá tại thời điểm kết thúc phiên giao dịch.
- Giá cao nhất: Giá cao nhất đạt được trong phiên giao dịch.
- Giá thấp nhất: Giá thấp nhất đạt được trong phiên giao dịch.
Màu sắc và hình dạng của từng cây nến phản ánh tâm lý thị trường, hỗ trợ nhận diện sự cân bằng giữa bên mua và bên bán. Khi hiểu cách đọc biểu đồ nến, nhà giao dịch và nhà đầu tư có thể đưa ra quyết định hợp lý hơn về xu hướng thị trường và khả năng biến động giá.
Cách đọc một cây nến
Để diễn giải chính xác biểu đồ nến, bạn cần hiểu rõ những thành phần cấu tạo của mỗi cây nến:
- Thân nến: Phần thân dày biểu thị chênh lệch giữa giá mở cửa và giá đóng cửa. Thân càng lớn, mức biến động giá trong phiên càng mạnh.
- Bóng nến (hoặc râu nến): Đường mảnh phía trên và dưới thân phản ánh mức giá cao nhất và thấp nhất trong phiên giao dịch.
- Nến tăng (thường màu xanh): Giá đóng cửa cao hơn giá mở cửa, cho thấy lực mua chiếm ưu thế.
- Nến giảm (thường màu đỏ): Giá đóng cửa thấp hơn giá mở cửa, phản ánh áp lực bán chiếm ưu thế.
Việc nắm vững các thành phần này giúp nhà giao dịch nhanh chóng đánh giá tình hình thị trường và nhận diện các cơ hội giao dịch phù hợp.
Các mẫu hình nến tăng giá
Các mẫu hình nến tăng giá báo hiệu khả năng giá tăng và cho thấy lực mua có thể vượt trội hơn lực bán. Dưới đây là các mẫu phổ biến nhất:
Hammer
Mẫu hình một nến với thân nhỏ, bóng dưới dài (ít nhất gấp đôi thân nến), bóng trên rất ngắn hoặc không có. Hammer thể hiện lực mua đang tăng lên, kéo giá phục hồi sau đà giảm sâu. Đây là tín hiệu đảo chiều từ giảm sang tăng đáng chú ý.
Bullish Engulfing
Mẫu hình hai nến, với nến xanh lớn hoàn toàn "nuốt trọn" cây nến đỏ trước đó. Điều này cho thấy lực mua áp đảo hoàn toàn lực bán, báo hiệu sự thay đổi mạnh về tâm lý thị trường và khả năng tăng giá tiếp diễn.
Morning Star
Mẫu hình ba nến liên tiếp gồm: một nến đỏ dài, một nến thân nhỏ (có thể đỏ hoặc xanh), và một nến xanh dài. Morning Star thể hiện xu hướng giảm yếu đi, lực mua xuất hiện, dẫn đến đảo chiều tăng giá tiềm năng.
Piercing Line
Mẫu hình hai nến gồm một nến đỏ dài, tiếp theo là một nến xanh mở cửa thấp hơn nhưng đóng cửa trên 50% thân nến đỏ. Đây là tín hiệu lực mua mạnh kéo giá vượt trung bình của nến giảm trước đó, thể hiện bên mua kiểm soát thị trường.
Bullish Harami
Mẫu hình hai nến với một nến đỏ dài, tiếp theo là một nến xanh nhỏ nằm gọn trong thân nến đỏ. Nến xanh nhỏ này phản ánh sự do dự của bên bán và khả năng bên mua chiếm ưu thế trở lại.
Tweezer Bottom
Mẫu hình hai nến liên tiếp có giá thấp nhất gần như bằng nhau. Hai đáy giá tương đương cho thấy vùng hỗ trợ mạnh, khả năng đảo chiều tăng giá lớn.
Bullish Abandoned Baby
Mẫu hình ba nến gồm một nến đỏ dài, tiếp theo là nến Doji (hoặc nến rất nhỏ) có khoảng trống giảm giá, sau đó là nến xanh dài tạo khoảng trống tăng giá. Nến Doji có khoảng trống báo hiệu sự thay đổi mạnh về tâm lý thị trường và khả năng đảo chiều rõ nét.
Three White Soldiers
Mẫu hình ba nến xanh dài liên tiếp, các nến đóng cửa gần mức giá cao nhất. Đây là tín hiệu lực mua liên tục rất mạnh, thể hiện bên mua kiểm soát toàn diện thị trường.
Rising Three Methods
Mẫu hình năm nến (có thể nhiều hơn nếu ba nến đỏ giữa nhiều hơn ba) gồm một nến xanh dài, ba nến đỏ nhỏ liên tiếp, kết thúc bằng nến xanh dài. Các nến đỏ nhỏ nằm hoàn toàn trong vùng giá của nến xanh đầu tiên. Mẫu hình này xác nhận xu hướng tăng tiếp diễn sau giai đoạn điều chỉnh ngắn.
Các mẫu hình nến giảm giá
Các mẫu hình nến giảm giá báo hiệu khả năng giá giảm và thể hiện lực bán có thể chiếm ưu thế. Dưới đây là những mẫu phổ biến nhất:
Hanging Man
Mẫu hình một nến tương tự Hammer nhưng xuất hiện ở cuối xu hướng tăng. Thân nhỏ, bóng dưới dài (ít nhất gấp đôi thân nến), bóng trên rất ngắn hoặc không có. Hanging Man cảnh báo áp lực bán xuất hiện, báo hiệu khả năng đảo chiều từ tăng sang giảm.
Bearish Engulfing
Mẫu hình hai nến, với nến đỏ lớn hoàn toàn "nuốt trọn" cây nến xanh trước đó. Mẫu này cho thấy lực bán áp đảo hoàn toàn lực mua, báo hiệu sự thay đổi mạnh về tâm lý thị trường.
Evening Star
Mẫu hình ba nến liên tiếp gồm: một nến xanh dài, một nến thân nhỏ (có thể xanh hoặc đỏ), và một nến đỏ dài. Evening Star thể hiện xu hướng tăng yếu đi, lực bán xuất hiện, khả năng đảo chiều giảm giá rõ rệt.
Dark Cloud Cover
Mẫu hình hai nến với một nến xanh dài, tiếp theo là nến đỏ mở cửa cao hơn nhưng đóng cửa dưới 50% thân nến xanh. Đây là tín hiệu lực bán mạnh kéo giá xuống dưới trung bình của nến tăng trước, thể hiện bên bán kiểm soát thị trường.
Bearish Harami
Mẫu hình hai nến với một nến xanh dài, tiếp theo là một nến đỏ nhỏ nằm hoàn toàn trong thân nến xanh. Nến đỏ nhỏ này phản ánh sự do dự của bên mua và khả năng bên bán chiếm ưu thế trở lại.
Tweezer Top
Mẫu hình hai nến liên tiếp có giá cao nhất gần như bằng nhau. Hai đỉnh giá tương đương cho thấy vùng kháng cự mạnh, khả năng đảo chiều giảm giá lớn.
Shooting Star
Mẫu hình một nến với thân nhỏ và bóng trên dài (ít nhất gấp đôi thân nến). Shooting Star cho thấy áp lực bán mạnh xuất hiện sau giai đoạn tăng giá, cảnh báo khả năng đảo chiều giảm giá.
Bearish Abandoned Baby
Mẫu hình ba nến gồm một nến xanh dài, tiếp theo là nến Doji (hoặc nến rất nhỏ) có khoảng trống tăng giá, sau đó là nến đỏ dài tạo khoảng trống giảm giá. Nến Doji có khoảng trống báo hiệu sự thay đổi mạnh về tâm lý thị trường và khả năng đảo chiều rõ nét.
Three Black Crows
Mẫu hình ba nến đỏ dài liên tiếp, các nến đóng cửa gần mức giá thấp nhất. Đây là tín hiệu lực bán liên tục rất mạnh, thể hiện bên bán kiểm soát toàn diện thị trường.
Falling Three Methods
Mẫu hình năm nến (có thể nhiều hơn nếu ba nến xanh giữa nhiều hơn ba) gồm một nến đỏ dài, ba nến xanh nhỏ liên tiếp, kết thúc bằng nến đỏ dài. Các nến xanh nhỏ nằm hoàn toàn trong vùng giá của nến đỏ đầu tiên. Mẫu hình này xác nhận xu hướng giảm tiếp diễn sau giai đoạn điều chỉnh ngắn.
Kết luận
Biểu đồ nến là công cụ phân tích hiệu quả để nhận diện xu hướng thị trường và các cơ hội giao dịch tiềm năng. Kiến thức về các mẫu hình nến đã trình bày mang lại giá trị trong việc đánh giá tâm lý thị trường và biến động giá.
Thị trường tài chính vốn biến động mạnh, luôn ẩn chứa cả cơ hội lẫn thách thức. Việc trang bị kiến thức toàn diện về các công cụ phân tích kỹ thuật như biểu đồ nến là điều then chốt để xây dựng chiến lược giao dịch và đầu tư thành công.
Biểu đồ nến rất hữu ích trong phân tích thị trường, nhưng để vận dụng thành thạo đòi hỏi bạn phải học hỏi liên tục, thực hành và áp dụng thực tiễn. Nhà giao dịch và nhà đầu tư nên không ngừng trau dồi kiến thức, rèn luyện kỹ năng để nâng cao năng lực ra quyết định.
Kết hợp phân tích biểu đồ nến với các phương pháp phân tích kỹ thuật và cơ bản khác sẽ giúp bạn xây dựng phương pháp giao dịch và đầu tư vững chắc hơn. Hãy chủ động khám phá, thực hành đều đặn và điều chỉnh chiến lược phù hợp với điều kiện thị trường cũng như mục tiêu của bản thân.
Câu hỏi thường gặp
Biểu đồ nến là gì? Bốn thành phần cơ bản của một cây nến (giá mở cửa, giá đóng cửa, giá cao nhất, giá thấp nhất) lần lượt thể hiện điều gì?
Biểu đồ nến trực quan hóa biến động giá theo thời gian. Giá mở cửa: giá giao dịch đầu tiên; giá đóng cửa: giá giao dịch cuối cùng; giá cao nhất: mức giá cao nhất; giá thấp nhất: mức giá thấp nhất trong phiên. Thân nến thể hiện biên độ mở - đóng, bóng nến thể hiện các vùng giá cực đại và cực tiểu.
Cách phân biệt nến tăng và nến giảm? Ý nghĩa thị trường của từng loại nến là gì?
Nến tăng đóng cửa cao hơn mở cửa, phản ánh đà tăng giá và lực mua mạnh. Nến giảm đóng cửa thấp hơn mở cửa, thể hiện áp lực giảm giá và bên bán chiếm ưu thế. Các mẫu hình này cho thấy tâm lý thị trường và xu hướng giá.
Các mẫu hình nến phổ biến là gì? Các mẫu Hammer, Hanging Man và Doji Stars báo hiệu điều gì?
Hammer và Hanging Man có cùng hình dạng với thân nhỏ, bóng dưới dài. Hammer xuất hiện trong xu hướng giảm, báo hiệu khả năng đảo chiều tăng giá; Hanging Man xuất hiện trong xu hướng tăng, cảnh báo đảo chiều giảm giá. Doji Stars có hình chữ thập thể hiện sự lưỡng lự của thị trường và khả năng đảo chiều xu hướng.
Thân nến và bóng nến là gì? Độ dài bóng nến ảnh hưởng thế nào đến xu hướng giá?
Thân nến thể hiện biên độ giá mở - đóng, bóng nến thể hiện mức giá cực đại và cực tiểu. Bóng nến dài cho thấy giá bị từ chối ở các vùng cực đoan, báo hiệu khả năng đảo chiều. Bóng nến ngắn phản ánh áp lực mua hoặc bán mạnh, xu hướng tiếp diễn.
Cách nhận biết đảo chiều xu hướng thị trường qua các mẫu hình kết hợp như Engulfing Pattern và Island Reversal?
Engulfing Pattern xuất hiện khi một cây nến lớn hoàn toàn bao phủ cây nến trước đó, cho tín hiệu đảo chiều tiềm năng. Island Reversal hình thành khi có khoảng trống giữa các nến, thể hiện sự chuyển biến mạnh về tâm lý thị trường. Cần quan sát khối lượng giao dịch tăng mạnh cùng các mẫu này. Engulfing giảm sau xu hướng tăng và Engulfing tăng sau xu hướng giảm đều xác nhận tín hiệu đảo chiều. Island Reversal có khoảng trống báo hiệu xu hướng trước đã suy yếu.
Cách xác định vùng hỗ trợ và kháng cự trên biểu đồ nến? Mối liên hệ giữa chúng với mẫu hình nến?
Vùng hỗ trợ hình thành ở nơi giá thường xuyên bật tăng, vùng kháng cự là nơi giá thường xuyên đảo chiều giảm. Cả hai thường xuất hiện tại các đỉnh và đáy trước đó. Mẫu hình nến sẽ xác nhận các vùng này khi giá chạm hoặc phá vỡ, mẫu đảo chiều cho thấy độ mạnh của vùng, mẫu tiếp diễn báo hiệu xu hướng giá vẫn còn tiếp tục.
Ứng dụng phân tích kỹ thuật biểu đồ nến trong giao dịch thực tế như thế nào? Nên kết hợp chỉ báo kỹ thuật nào?
Kết hợp biểu đồ nến với các vùng hỗ trợ, kháng cự, đường xu hướng và phân tích khối lượng. Sử dụng thêm các chỉ báo như đường trung bình động, RSI và MACD để xác nhận tín hiệu. Áp dụng các mẫu hình như Engulfing, Doji song song với các chỉ báo này giúp tăng độ chính xác và giảm tín hiệu nhiễu trong quá trình ra quyết định giao dịch.
* Thông tin không nhằm mục đích và không cấu thành lời khuyên tài chính hay bất kỳ đề xuất nào được Gate cung cấp hoặc xác nhận.