In-depth guide to candlestick chart analysis in the cryptocurrency market for traders and investors. Learn about candlestick components, classic reversal patterns, trading strategies on Gate, and how to avoid typical technical analysis mistakes beginners often make.
The Role of Candlestick Charts in Cryptocurrency Trading
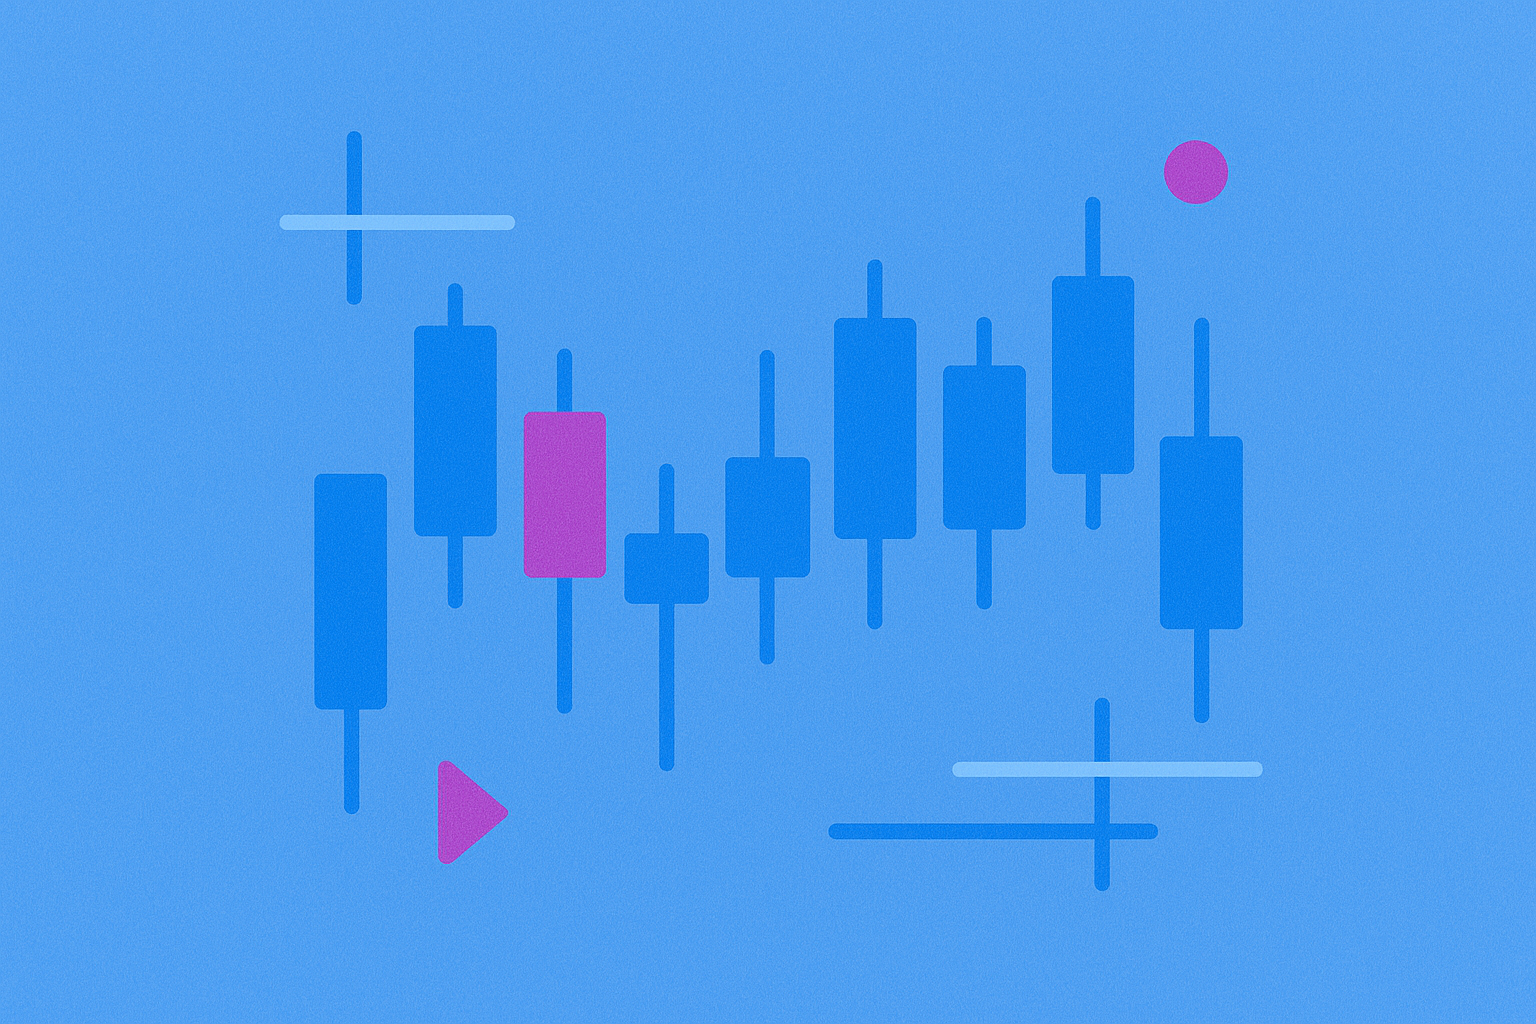
Candlestick charts are essential tools in cryptocurrency trading, offering traders a clear visualization of price movements and streamlining the process of pattern recognition for more informed decision-making.
Given the high volatility and rapidly changing dynamics of the crypto market, traders require robust analytical instruments to interpret price action and trends. Candlestick charts enable users to visually distinguish bullish or bearish trends and gauge their strength or early signs of reversal. For example, a series of ascending bullish candles with increasing volume may signal a strong upward trend, while the emergence of candles with long upper wicks often indicates mounting selling pressure.
Candlestick charts also serve as indispensable resources for identifying critical support and resistance levels. These levels are vital for setting strategic stop-loss orders to safeguard capital and take-profit orders to realize gains. Knowing where price has historically bounced or broken through provides traders a significant edge in planning their trades.
Key Components of Candlestick Charts
A candlestick chart is comprised of several fundamental elements, each contributing important insights for technical analysis.
Time Intervals
Time intervals define the duration each candle represents, ranging from minutes (scalping) to months (long-term investing). The optimal interval depends on your trading style and strategy. Day traders typically use 5-minute or 15-minute charts, while swing traders prefer daily or weekly timeframes.
X-Axis
The horizontal X-axis represents the time scale. Each point marks the start of a new period—be it an hour, day, or week. Proper understanding of the time axis helps traders align their actions with market cycles.
Y-Axis
The vertical Y-axis reflects the price range for the selected asset. This scale is usually denominated in US dollars, euros, or another fiat currency according to the trading pair. Some platforms also offer logarithmic scales for enhanced analysis of long-term trends with large price swings.
Candle Body
The candle body is the central rectangle that shows the difference between the opening and closing prices for a given period. The color of the body carries key information: a green or white body signals a bullish period (close above open), while red or black signals a bearish period (close below open). The size of the body matters: a large body signals strong price movement, while a small body indicates consolidation or market indecision.
Wicks and Shadows
Wicks (also called shadows or tails) are thin lines extending above and below the candle body. The upper wick marks the highest price reached; the lower wick shows the lowest price. Wick length reveals market volatility: long wicks reflect high volatility and deviation from open/close, while short wicks indicate steady movement in a particular direction.
Popular Candlestick Patterns
Candlestick patterns are critical for spotting potential trend reversals and continuations in the crypto market.
Doji
A Doji features a very small body (open and close nearly identical) and long wicks on both sides. This pattern signals balance between buyers and sellers, indicating market uncertainty. Depending on context, a Doji may precede either a trend reversal or continuation after consolidation. Pay close attention to Dojis at major support or resistance levels.
Morning Star
This classic bullish reversal pattern forms after an extended downtrend and consists of three consecutive candles: first, a long bearish candle confirming the prevailing downtrend; second, a small-bodied candle with long wicks (often a Doji) indicating weakening seller momentum; third, a strong bullish candle closing well above the midpoint of the first, signaling buyers have taken control. The "Morning Star" pattern often forecasts an upward reversal.
Evening Star
The Evening Star is a bearish reversal pattern—the opposite of the Morning Star—developing after an uptrend. It comprises three candles: a long bullish candle, a transitional candle with an uncertain body and long shadows, and a final long bearish candle. This formation denotes fading buyer momentum and a shift to seller control, frequently leading to a downward reversal.
Harami
The Harami is a two-candle pattern in which the second, smaller candle is fully contained within the body of the preceding larger candle. It can be bullish (after a downtrend) or bearish (after an uptrend). Harami signals a slowdown in momentum and a possible reversal or consolidation. Traders usually seek confirmation from subsequent candles before acting.
Bullish and Bearish Patterns
Candlestick patterns are categorized as bullish or bearish, depending on whether they suggest potential price increases or declines.
Bullish Patterns
Hammer
The Hammer is a strong bullish reversal pattern appearing at the base of a downtrend. Its distinguishing features: a small body at the upper end of the price range and a long lower shadow (at least twice the body’s length), with little or no upper shadow. The long lower shadow shows buyers regained control after heavy selling, lifting the price to the close. This demonstrates buyer accumulation and often signals an impending upward reversal.
Bullish Engulfing
The bullish engulfing pattern occurs when a large bullish candle completely engulfs the body of the preceding small bearish candle. This signals a rapid shift in market power—buyers decisively overpower sellers and drive prices higher. The larger the difference between the candles, the stronger the signal. Bullish engulfing is especially meaningful at support levels or after sustained downtrends.
Three White Soldiers
A sequence of three long bullish candles, each opening within the prior candle’s body and closing above its high, forms the Three White Soldiers pattern. It signals a strong, sustained uptrend backed by persistent buying pressure. This pattern is most reliable after consolidation or at the start of a new upward move, pointing to a high probability of continued growth.
Bearish Patterns
Shooting Star
The Shooting Star is a bearish reversal pattern at the top of an uptrend, marked by a small body at the lower end of the range and a long upper shadow (at least twice the body’s length). The long upper shadow shows buyers pushed prices higher, but sellers regained control and pressed the price back down. This indicates waning buyer momentum and a likely downward reversal.
The bearish engulfing pattern appears when a large bearish candle fully engulfs the body of the previous small bullish candle, reflecting a sharp shift from buyer to seller dominance. Sellers aggressively drive the price lower. This pattern is a potent signal, especially at resistance levels, after extended uptrends, or when accompanied by high trading volume.
Three Black Crows
The Three Black Crows pattern consists of three consecutive long bearish candles, each opening within the body of the prior candle and closing below its low. It signals a strong, sustained downtrend reinforced by persistent selling. The pattern is a trusted bearish indicator, especially after upward moves or at major resistance areas.
Recognizing these bullish and bearish patterns allows traders to anticipate potential trend changes and identify promising trading setups. However, it is essential to combine candlestick patterns with other technical indicators, volume analysis, and fundamental factors to enhance forecast accuracy.
How to Use Candlestick Charts for Trading
Candlestick charts offer actionable insights into market dynamics, which traders can leverage to design profitable strategies.
Trend Identification
The primary step in technical analysis is pinpointing the prevailing market trend. Assess whether price action is upward, downward, or sideways (consolidation). Start with long-term charts (daily or weekly) to determine if the chart shows rising highs and lows (uptrend) or falling highs and lows (downtrend). The rule "the trend is your friend" applies—trading in the direction of the primary trend increases the probability of success.
Spotting Key Patterns
Once the main trend is established, look for specific candlestick patterns that confirm momentum or hint at reversals. Bullish patterns (hammer, bullish engulfing, morning star) signal potential upward movement for opening long positions. Bearish patterns (shooting star, bearish engulfing, evening star) suggest possible declines and are useful for opening shorts or closing longs. It’s important to wait for pattern completion, ideally with confirmation from the next candle before entering a trade.
Volume Analysis
Trading volume is vital for validating trend strength and durability. A notable volume increase during a candle’s formation signals strong market participation and bolsters the reliability of the signal. For instance, a bullish pattern with a volume spike is far more likely to yield further upward movement than one on low volume. Volume-price divergence may warn of weakening trends and possible reversals.
Support and Resistance Identification
Support and resistance are key price zones where buyer or seller pressure has historically concentrated. These levels help traders pinpoint optimal entry and exit points. Support is a price zone where the asset previously bounced upward due to buying activity; resistance is where it bounced downward under selling pressure. Traders often place buy orders near support and sell orders near resistance. Breakouts at these levels, confirmed by volume, may signal the start of strong directional moves.
Integrating Candlestick Patterns with Other Technical Indicators
Candlestick patterns are powerful, but their effectiveness is greatly amplified when paired with complementary technical indicators.
Moving Averages
Moving averages smooth out short-term price fluctuations and clarify the dominant trend. The most common are Simple Moving Average (SMA) and Exponential Moving Average (EMA), typically set to 50, 100, or 200 periods. Combining moving average analysis with candlestick patterns yields more reliable signals. For example, a bullish "hammer" forming near an upward-sloping moving average is more likely to succeed. Crossovers between short- and long-term moving averages ("golden cross" or "death cross"), confirmed by supporting candlestick patterns, generate strong entry signals.
RSI is a momentum oscillator measuring the speed and magnitude of price changes on a scale of 0 to 100. Readings above 70 typically signal overbought conditions, while below 30 indicate oversold. Combining RSI with candlestick patterns helps pinpoint likely reversals. For example, a bearish reversal pattern appearing in an overbought zone (RSI > 70) provides a strong short signal. Divergence between price and RSI (new price highs while RSI falls) alongside bearish candle patterns is a particularly reliable warning of reversal.
Fibonacci Levels
Fibonacci retracement and extension levels are widely used to identify probable support, resistance, and target profit zones. Key retracement levels (23.6%, 38.2%, 50%, 61.8%) often overlap with areas where important candlestick patterns emerge. Using Fibonacci levels alongside candlestick analysis improves the precision of reversal forecasts. For example, a bullish reversal pattern at the 61.8% retracement after a decline is a high-probability setup for a long.
Volume Indicators
Volume indicators like On-Balance Volume (OBV), Volume Weighted Average Price (VWAP), and accumulation/distribution provide critical context for price strength and sustainability. Volume acts as "fuel" for price movement, so analyzing volume indicators together with candlestick patterns greatly enhances signal reliability. For instance, a bullish engulfing pattern with a pronounced volume spike suggests strong buyer momentum and a high probability of further gains. Divergence between price action and volume indicators can warn of trend weakness before reversal patterns appear.
A holistic approach—combining candlestick patterns with multiple technical indicators—lets traders build a clearer, more accurate view of crypto market conditions and make informed decisions with optimal risk-reward ratios.
Frequent Mistakes When Using Candlestick Charts
While candlestick charts are highly effective, there are common pitfalls that traders should avoid to maintain consistent profitability.
Overdependence on Candlestick Patterns
One common novice mistake is relying exclusively on candlestick patterns and neglecting other crucial aspects of technical analysis. Candlestick formations are just one component of a comprehensive market analysis framework. Making trades based solely on these patterns, without considering trend indicators, oscillators, volume, and fundamentals, reduces forecast accuracy and increases risk of losses. Professional traders employ multifactor analysis, using candlestick patterns as confirmation rather than sole justification for positions.
Neglecting Stop-Loss Orders
Stop-loss orders are vital risk management tools—they automatically cap losses in adverse scenarios. Skipping protective stops or placing them incorrectly can lead to catastrophic losses, especially in volatile crypto markets. Every trade should have a preset stop-loss level, based on technical analysis (e.g., below a key support) and capital management rules. Emotional trading and hoping for a reversal without a stop are major causes of large losses.
Lack of Risk Management Strategy
Successful crypto trading demands a disciplined risk management strategy. A critical error is risking more than 1–2% of total trading capital per position—professional traders keep risk per trade within these limits to survive losing streaks. Always have a clear capital plan: define position size, risk-reward ratio (minimum 1:2), maximum drawdown, and exit rules for losing trades. Trading without sound risk management leads to inevitable capital erosion, regardless of pattern analysis quality.
Ignoring Major Market Trends
Trading counter to the dominant market trend based on isolated candlestick patterns is a costly error. Even the strongest reversal patterns have low success rates if they form against entrenched trends. Professionals start by identifying the primary trend on higher timeframes and trade in its direction. Countertrend trades require greater expertise, stricter risk controls, and multiple confirmations. Disregarding broad market direction—trying to "catch the bottom" or "sell the top" based on single patterns—often results in premature entries and losses.
Conclusion
Candlestick charts are indispensable for technical analysis in the cryptocurrency market, enabling well-grounded trading decisions. Mastery of candle structure, pattern recognition, and integration with other technical indicators empowers traders to gain valuable market insights and craft effective strategies.
Nevertheless, no single indicator or tool guarantees consistent profits. A professional approach requires holistic analysis: studying candlestick patterns, trend indicators, oscillators, volume, and fundamentals. Key factors for long-term success include strict discipline in following your trading plan, robust risk management and capital protection, and an ongoing commitment to learning and skill development.
By avoiding common mistakes—overdependence on candlestick patterns, neglect of stop-loss orders, lack of risk management, and ignoring main market trends—traders can substantially improve their chances of achieving consistent profitability and meeting their financial objectives in the crypto market.
FAQ
What is a candlestick chart, and what do open, close, high, and low prices mean?
A candlestick chart displays four key prices for each trading period: open, close, high, and low. The body shows the open and close; the wicks mark the high and low. A green candle signals rising prices, while a red candle indicates a decline.
How do you identify uptrends and downtrends on candlestick charts?
An uptrend features consecutive candles with higher closes and long bodies. A downtrend shows falling closes and short bodies. Trend reversals are often signaled by long shadow lines on candles.
What are support and resistance levels, and how do you find them on candlestick charts?
Support is the price below which an asset rarely falls; resistance is the price above which it rarely rises. Identify these levels by looking for historical bounce points and breakouts—areas where price repeatedly bounced or stalled.
What are some common candlestick patterns (e.g., hammer, engulfing), and what do they predict?
Major patterns include the hammer and inverted hammer (reversal signals), engulfing (trend reversal), morning and evening star (reversal), and doji (indecision). These indicate potential reversals or trend continuations depending on market context.
How do you combine candlestick charts with other technical indicators (like moving averages, RSI) for trading?
Use moving averages to track trend direction and RSI to gauge strength (overbought/oversold). Confirm signals with candlestick patterns: moving average crossovers suggest reversals, and candle patterns confirm entry points. Combine indicators to boost accuracy.
What’s the difference between candlestick charts for different timeframes (1 hour, 4 hours, daily) in crypto trading?
A 1-hour chart shows price movement over 60 minutes; a 4-hour chart covers 240 minutes; a daily chart spans 24 hours. Each timeframe helps you analyze trends at different scales for more effective trading.
What mistakes do beginners most often make when trading with candlestick charts?
Beginners often focus on individual candles and ignore the overall trend, skip stop-losses, trade against the main market direction, and lack a clear risk management strategy.
How do you use candlestick charts to set stop-loss and take-profit points?
Place stop-loss orders below support and take-profit orders above resistance on the candlestick chart. This approach helps manage risk and lock in profits when trading crypto.
* The information is not intended to be and does not constitute financial advice or any other recommendation of any sort offered or endorsed by Gate.