This comprehensive article analyzes SKL and ARB as Layer-2 Ethereum scaling solutions through multiple investment dimensions. The analysis examines historical price trends, tokenomics, institutional adoption, and technical ecosystems. SKL, an open-source Web3 platform launched in 2020, currently trades at $0.010804 with $65.49M market cap. ARB, Ethereum's scaling solution from 2023, trades at $0.2161 with $1.26B market cap. Price forecasts through 2031 suggest SKL potential growth to $0.0286 and ARB to $0.5212 under optimistic scenarios. Conservative investors should favor ARB's superior liquidity and established presence (70-80% allocation), while aggressive investors might pursue diversified SKL exposure. Both assets face regulatory uncertainties and market volatility risks. Check real-time prices on Gate for informed investment decisions.
Introduction: Investment Comparison Between SKL and ARB
In the cryptocurrency market, the comparison between SKL and ARB has consistently drawn investor attention. These two projects differ significantly in market capitalization ranking, application scenarios, and price performance, representing distinct positioning within the crypto asset landscape.
SKALE (SKL): Launched in December 2020, SKALE Network is an open-source Web3 platform designed to bring speed and configurability to blockchain technology. It aims to make decentralized web infrastructure more accessible to users, developers, and validators.
Arbitrum (ARB): Introduced in March 2023, Arbitrum is recognized as a technology suite designed to scale Ethereum. It enables users to perform all Ethereum activities with lower costs and faster transaction speeds through its Optimistic Rollup protocol.
This article will comprehensively analyze the investment value comparison between SKL and ARB, focusing on historical price trends, supply mechanisms, institutional adoption, technological ecosystems, and future projections, attempting to address the question most investors care about:
"Which is the better buy right now?"
I. Price History Comparison and Market Status
SKALE (SKL) and Arbitrum (ARB) Historical Price Trends
- 2021: SKL experienced notable price movement, reaching its all-time high of $1.22 in March 2021 during the broader crypto market rally.
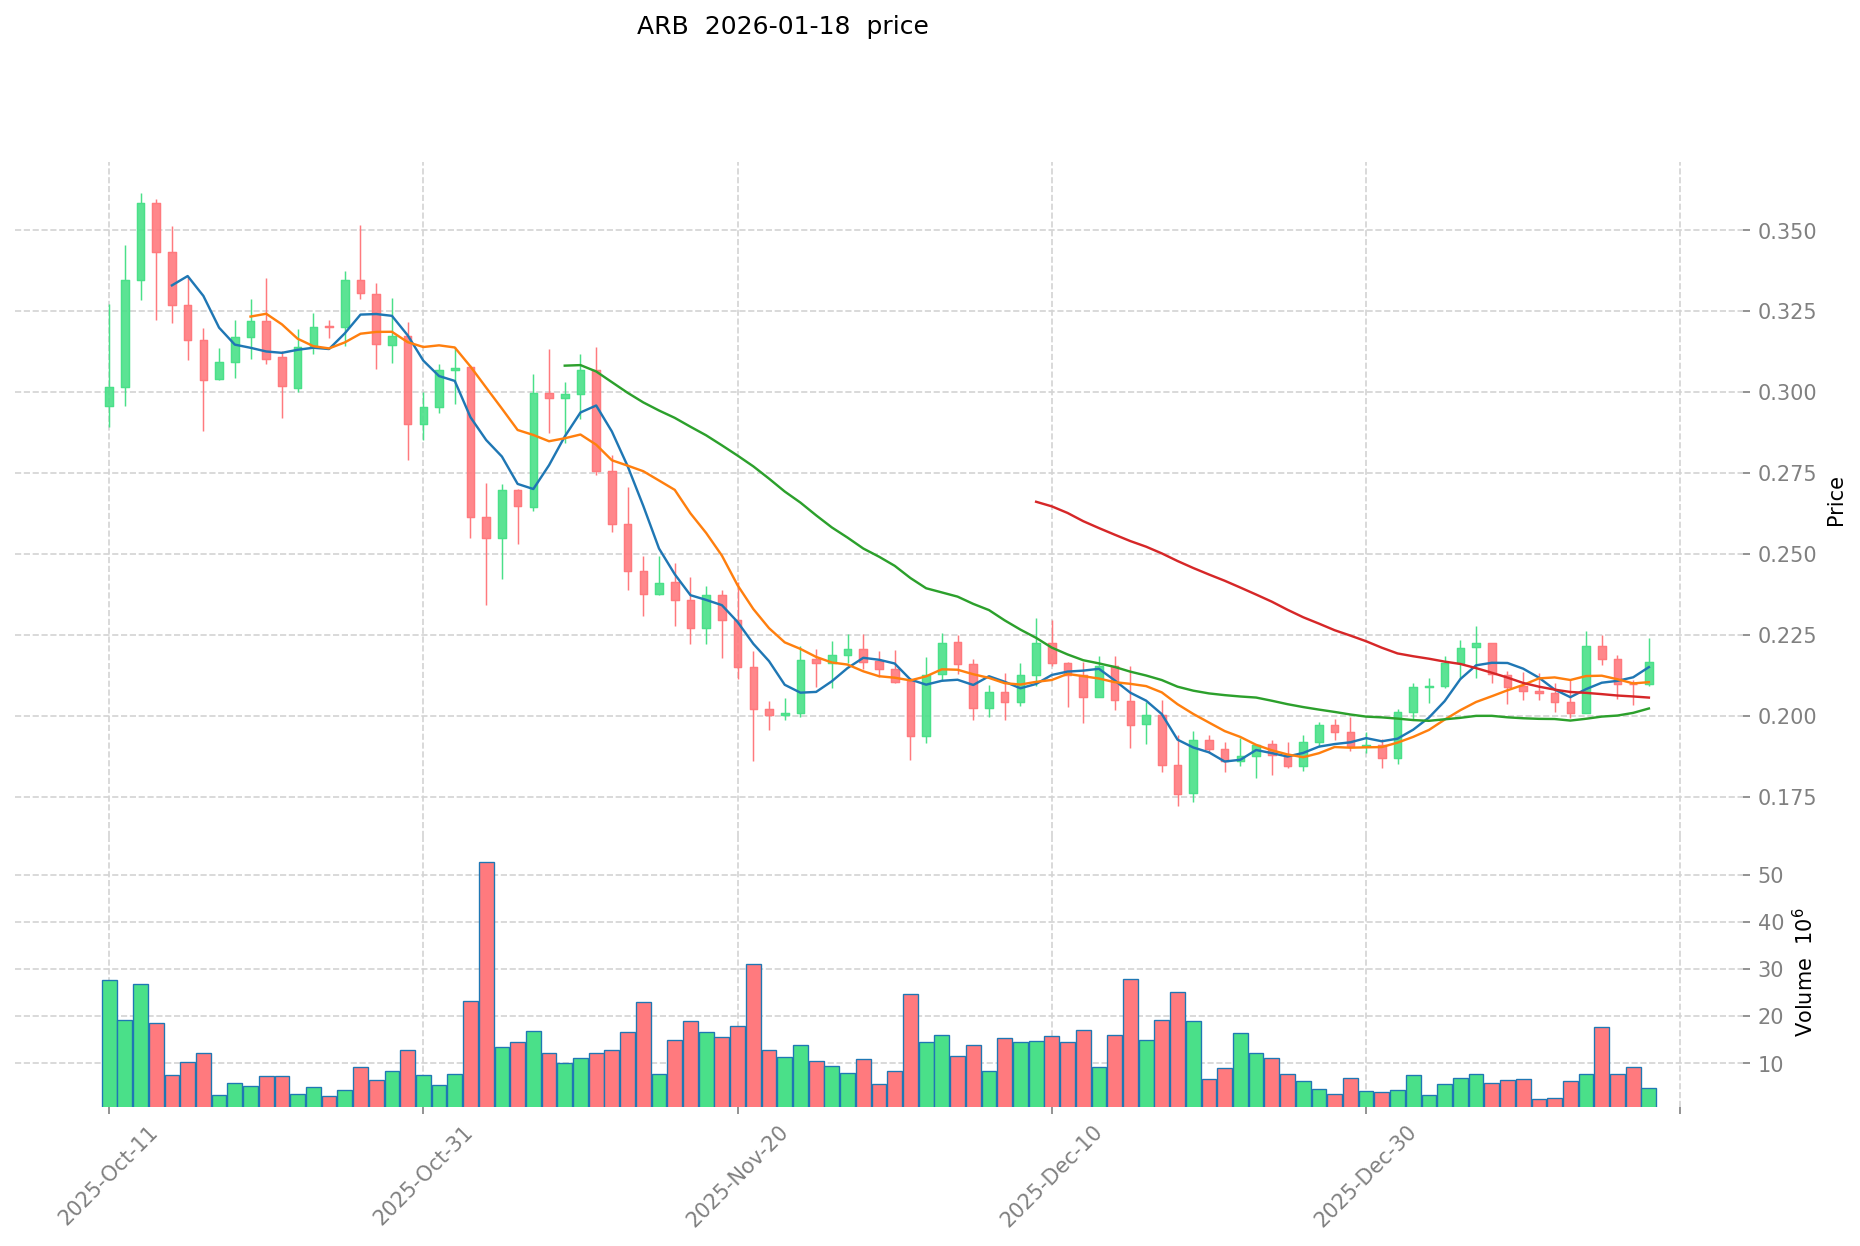
- 2024: ARB reached its all-time high of $2.39 in January 2024, reflecting strong initial market interest following its token launch.
- 2026: SKL hit its all-time low of $0.00941605 on January 1, 2026, while ARB recorded its all-time low of $0.172637 on December 19, 2025, both experiencing significant corrections from their peaks.
- Comparative Analysis: During the recent market cycle, SKL declined from its high of $1.22 to its current level, representing approximately a 99% decrease, while ARB experienced a decline from $2.39, showing a similar downward trajectory of over 90% from its peak.
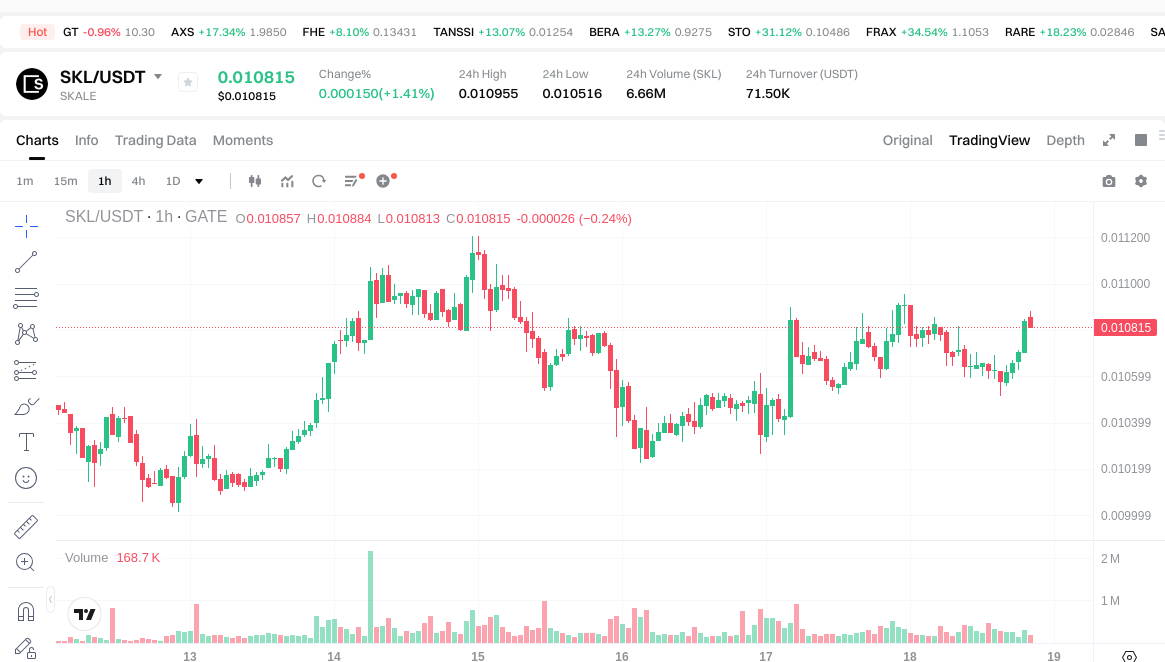
Current Market Status (2026-01-18)
- SKL Current Price: $0.010804
- ARB Current Price: $0.2161
- 24-Hour Trading Volume: SKL at $70,364.90 vs ARB at $1,058,618.40
- Market Capitalization: SKL at $65.49M vs ARB at $1.26B
- 24-Hour Price Change: SKL increased by 1.94%, while ARB increased by 1.26%
- Market Sentiment Index (Fear & Greed Index): 49 (Neutral)
View Real-Time Prices:
II. Core Factors Influencing SKL vs ARB Investment Value
Supply Mechanism Comparison (Tokenomics)
The supply mechanism represents a fundamental differentiator in evaluating long-term value propositions. While specific tokenomics details for SKL and ARB were not extensively covered in available materials, understanding supply dynamics remains critical for investment assessment.
- Supply structure influences token scarcity and potential price trajectories over time
- Token distribution models affect market concentration and liquidity patterns
- 📌 Historical patterns suggest supply mechanisms can significantly impact price cycles during market expansion and contraction phases
Institutional Adoption and Market Application
Institutional engagement serves as a key indicator of asset maturity and credibility within crypto markets. The evaluation considers multiple dimensions:
- Institutional positioning: Assessment of which asset attracts greater institutional interest based on risk profiles and strategic positioning
- Enterprise implementation: Comparative analysis of adoption in cross-border payments, settlement systems, and institutional portfolios
- Regulatory landscape: Jurisdictional differences in policy frameworks affect accessibility and compliance requirements for both assets
Market sentiment indicators, such as trading volumes and circulating supply metrics, provide insights into liquidity and market depth. According to available data, SKL demonstrated 24-hour trading volume reaching approximately 32.3 million USD with circulating supply exceeding 6 billion tokens.
Technical Development and Ecosystem Construction
Technological advancement and ecosystem maturity constitute essential evaluation criteria for Layer-2 scaling solutions:
- Technical infrastructure: Both projects focus on addressing scalability challenges through distinct architectural approaches
- Ecosystem comparison: Development activity across DeFi protocols, NFT platforms, payment solutions, and smart contract deployment varies between the two networks
- Layer-2 positioning: ZK Rollup technologies have demonstrated advantages in underlying logic, user convenience, and privacy features compared to Optimistic Rollup solutions, though technical complexity may influence expansion timelines
The broader Layer-2 landscape suggests evolving preferences toward solutions balancing scalability, security, and user experience.
Macroeconomic Environment and Market Cycles
Macroeconomic conditions exert considerable influence on crypto asset performance:
- Inflationary contexts: Different asset characteristics may respond variably to inflationary pressures and monetary expansion
- Monetary policy impact: Interest rate adjustments, dollar index movements, and central bank policies affect capital flows into risk assets
- Geopolitical considerations: Cross-border transaction demand and international developments influence adoption patterns for decentralized infrastructure
Market analysis suggests economic recession risks may be moderating, potentially affecting investor sentiment toward growth-oriented crypto assets. Persistent core inflation indicators and policy adjustments continue shaping the investment landscape for digital assets.
III. 2026-2031 Price Forecast: SKL vs ARB
Short-term Forecast (2026)
- SKL: Conservative $0.00985 - $0.01082 | Optimistic $0.01082 - $0.01439
- ARB: Conservative $0.1982 - $0.2155 | Optimistic $0.2155 - $0.2542
Mid-term Forecast (2028-2029)
- SKL may enter a gradual growth phase, with projected prices ranging from $0.0132 to $0.0197 in 2028, potentially reaching $0.0132 - $0.0250 by 2029
- ARB may enter a consolidation phase, with projected prices ranging from $0.2128 - $0.2881 in 2028, potentially reaching $0.2218 - $0.3066 by 2029
- Key drivers: institutional capital flows, ETF developments, ecosystem expansion
Long-term Forecast (2030-2031)
- SKL: Baseline scenario $0.0155 - $0.0212 (2030) | Optimistic scenario $0.0171 - $0.0286 (2031)
- ARB: Baseline scenario $0.2583 - $0.2902 (2030) | Optimistic scenario $0.3213 - $0.5212 (2031)
View detailed price predictions for SKL and ARB
Disclaimer
SKL:
| Year |
Predicted High Price |
Predicted Average Price |
Predicted Low Price |
Price Change |
| 2026 |
0.01439725 |
0.010825 |
0.00985075 |
0 |
| 2027 |
0.01752946375 |
0.012611125 |
0.01210668 |
16 |
| 2028 |
0.01974208563125 |
0.015070294375 |
0.0135632649375 |
39 |
| 2029 |
0.0250649136045 |
0.017406190003125 |
0.013228704402375 |
61 |
| 2030 |
0.030791550115528 |
0.021235551803812 |
0.015501952816783 |
96 |
| 2031 |
0.028614906055637 |
0.02601355095967 |
0.017168943633382 |
140 |
ARB:
| Year |
Predicted High Price |
Predicted Average Price |
Predicted Low Price |
Price Change |
| 2026 |
0.25429 |
0.2155 |
0.19826 |
0 |
| 2027 |
0.28422295 |
0.234895 |
0.2020097 |
8 |
| 2028 |
0.28811046225 |
0.259558975 |
0.2128383595 |
20 |
| 2029 |
0.30669488486 |
0.273834718625 |
0.22180612208625 |
26 |
| 2030 |
0.42378661054405 |
0.2902648017425 |
0.258335673550825 |
34 |
| 2031 |
0.521257530969181 |
0.357025706143275 |
0.321323135528947 |
65 |
IV. Investment Strategy Comparison: SKL vs ARB
Long-term vs Short-term Investment Strategies
-
SKL: May suit investors focused on emerging Layer-2 infrastructure opportunities with higher risk tolerance, given its lower market capitalization and potential for volatility. The asset's historical price movements suggest significant fluctuation patterns that may appeal to those seeking exposure to developing Web3 platform technologies.
-
ARB: May appeal to investors seeking exposure to established Ethereum scaling solutions with greater market depth. With a market capitalization exceeding $1.26B and higher trading volumes, ARB demonstrates relatively stronger liquidity characteristics compared to SKL, potentially offering more accessible entry and exit opportunities.
Risk Management and Asset Allocation
-
Conservative Investors: Consider allocation strategies favoring established assets with demonstrated liquidity. A potential framework might emphasize ARB exposure (70-80%) relative to SKL (20-30%) to balance growth potential with liquidity considerations.
-
Aggressive Investors: May explore higher exposure to emerging infrastructure plays while maintaining diversification. Potential allocation frameworks could range from balanced 50-50 splits to SKL-weighted approaches (60-70% SKL, 30-40% ARB) depending on risk appetite and market outlook.
-
Hedging Instruments: Portfolio risk management may incorporate stablecoin allocations for liquidity preservation, derivatives instruments where available, and cross-asset diversification strategies to mitigate concentration risk.
V. Potential Risk Comparison
Market Risks
-
SKL: Lower market capitalization and trading volumes indicate heightened volatility exposure and liquidity constraints. The 24-hour trading volume of approximately $70,364.90 suggests limited market depth, potentially amplifying price movements during market stress periods.
-
ARB: While demonstrating stronger liquidity metrics with 24-hour trading volume exceeding $1.05M, the asset remains subject to broader Layer-2 competitive dynamics and Ethereum ecosystem developments. Market sentiment shifts and technological competition may influence price trajectories.
Technical Risks
-
SKL: Scalability implementation and network adoption rates represent ongoing considerations for infrastructure development. The evolution of Web3 platform utilization and validator participation may impact long-term value propositions.
-
ARB: Technical architecture dependencies on Ethereum mainnet performance and security models introduce systematic considerations. The Optimistic Rollup framework requires challenge period mechanisms that may affect user experience and adoption patterns compared to alternative scaling approaches.
Regulatory Risks
- Evolving regulatory frameworks across jurisdictions may affect Layer-2 solutions differently based on their technical architectures and operational models. Policy developments regarding decentralized infrastructure, token classifications, and cross-border transaction frameworks warrant ongoing monitoring for both assets.
VI. Conclusion: Which Is the Better Buy?
📌 Investment Value Summary
-
SKL Characteristics: Represents exposure to emerging Web3 infrastructure development with lower market capitalization positioning. The asset's price performance since inception reflects significant volatility patterns, with the current price near historical lows potentially presenting risk-adjusted entry considerations for investors with appropriate risk tolerance.
-
ARB Characteristics: Demonstrates established market presence within the Ethereum Layer-2 ecosystem with stronger liquidity metrics and institutional recognition. The asset's role in scaling Ethereum infrastructure provides exposure to network growth dynamics and DeFi ecosystem expansion.
✅ Investment Considerations
-
New Investors: May benefit from focusing on established assets with demonstrated liquidity and market depth. Understanding fundamental differences between Layer-2 technologies and their respective risk profiles remains essential before allocation decisions.
-
Experienced Investors: Could evaluate portfolio diversification strategies incorporating both established Layer-2 solutions and emerging infrastructure plays based on individual risk parameters and market outlook assessments.
-
Institutional Participants: May prioritize liquidity depth, regulatory clarity, and ecosystem maturity when evaluating Layer-2 scaling solution exposure. Technical due diligence regarding architecture security models and operational considerations remains fundamental.
⚠️ Risk Disclosure: Cryptocurrency markets exhibit substantial volatility characteristics. This analysis does not constitute investment advice. Participants should conduct independent research and consider consulting qualified financial advisors before making investment decisions.
VII. FAQ
Q1: What are the main differences between SKL and ARB in terms of technology and use cases?
SKL (SKALE Network) is an open-source Web3 platform focused on bringing speed and configurability to blockchain technology, making decentralized web infrastructure more accessible. ARB (Arbitrum), on the other hand, is specifically designed as an Ethereum scaling solution using Optimistic Rollup technology. The fundamental distinction lies in their architectural approach: SKL operates as an independent elastic blockchain network, while ARB functions as a Layer-2 solution directly scaling Ethereum's capabilities. This results in different application scenarios - SKL targets broader Web3 infrastructure needs, whereas ARB primarily serves existing Ethereum ecosystem participants seeking lower costs and faster transaction speeds.
Q2: Which asset offers better liquidity for trading purposes?
ARB demonstrates significantly stronger liquidity metrics compared to SKL. As of January 18, 2026, ARB's 24-hour trading volume stands at approximately $1,058,618.40, compared to SKL's $70,364.90 - representing roughly 15 times greater market depth. ARB's market capitalization of $1.26B versus SKL's $65.49M further reflects this liquidity differential. For investors prioritizing accessible entry and exit opportunities, particularly during volatile market conditions, ARB's superior liquidity characteristics reduce the risk of significant price slippage and provide more reliable execution of larger position sizes.
Q3: How do the historical price performances of SKL and ARB compare?
Both assets have experienced substantial declines from their respective all-time highs, though at different magnitudes and timeframes. SKL reached its peak of $1.22 in March 2021 and has since declined approximately 99% to its current price of $0.010804. ARB achieved its all-time high of $2.39 in January 2024 (following its March 2023 launch) and has decreased over 90% to its current price of $0.2161. While both have faced significant corrections, SKL's longer market history and more extreme drawdown suggest higher volatility characteristics. The timing difference in their respective peaks also reflects distinct market cycle positions - SKL participated in the 2021 broader crypto rally, while ARB's peak coincided with its initial token launch momentum.
Q4: What allocation strategy should conservative investors consider between SKL and ARB?
Conservative investors should prioritize established assets with demonstrated liquidity and market depth. A suggested framework for risk-averse participants would emphasize ARB exposure at 70-80% relative to SKL at 20-30% of the Layer-2 allocation portion. This approach balances exposure to Ethereum scaling opportunities through ARB's established market presence while maintaining limited participation in SKL's emerging Web3 infrastructure potential. Additionally, conservative portfolios should incorporate stablecoin allocations for liquidity preservation and consider implementing stop-loss mechanisms to manage downside risk. The lower allocation to SKL acknowledges its higher volatility profile and reduced liquidity while still providing diversification benefits within the Layer-2 sector.
Q5: What are the projected price ranges for SKL and ARB through 2031?
According to baseline forecasts, SKL is projected to range from $0.00985-$0.01439 in 2026, potentially reaching $0.0171-$0.0286 by 2031 under optimistic scenarios - representing potential growth of approximately 140% from current levels over five years. ARB forecasts suggest a range of $0.1982-$0.2542 for 2026, with optimistic scenarios projecting $0.3213-$0.5212 by 2031 - indicating potential appreciation of approximately 65% from current prices. These projections incorporate assumptions about institutional capital flows, ecosystem expansion, and broader market conditions. However, investors should recognize that cryptocurrency price predictions carry substantial uncertainty, and actual outcomes may vary significantly based on technological developments, regulatory changes, and macroeconomic factors.
Q6: What are the primary risks specific to each asset?
SKL faces heightened risks associated with its lower market capitalization and limited liquidity, which amplify volatility during market stress periods. Network adoption rates and the successful implementation of its Web3 infrastructure vision remain critical uncertainties. The asset's significant distance from its all-time high also reflects market skepticism that requires addressing through demonstrated utility and ecosystem growth. ARB's primary risks center on competitive dynamics within the Layer-2 landscape, particularly from emerging ZK Rollup solutions that may offer technical advantages. Its dependency on Ethereum mainnet performance introduces systematic considerations, and the Optimistic Rollup architecture's challenge period mechanisms may affect user experience compared to alternative scaling approaches. Both assets face regulatory uncertainties as policy frameworks for decentralized infrastructure continue evolving across jurisdictions.
Q7: How do macroeconomic conditions affect SKL and ARB differently?
Both assets respond to broader macroeconomic conditions, but their distinct characteristics may lead to varying sensitivity patterns. ARB, with its established market presence and higher institutional recognition, may demonstrate relatively stronger correlation with traditional risk assets and respond more predictably to monetary policy shifts, interest rate changes, and dollar index movements. SKL, as a smaller-cap emerging infrastructure play, might exhibit greater volatility in response to macroeconomic changes but could also benefit disproportionately during periods of increased risk appetite and capital rotation into growth-oriented crypto assets. Inflationary environments and monetary expansion policies generally favor decentralized infrastructure adoption, potentially benefiting both assets, though the magnitude of impact may differ based on their respective market positions and liquidity profiles.
Q8: Which asset is more suitable for new cryptocurrency investors?
New investors should generally prioritize ARB over SKL due to its superior liquidity characteristics, established market presence, and clearer value proposition within the Ethereum ecosystem. The significantly higher trading volumes and market capitalization reduce execution risks and provide more accessible entry and exit opportunities - critical considerations for participants still developing their understanding of cryptocurrency market dynamics. ARB's role in scaling Ethereum also offers more straightforward fundamental analysis compared to SKL's broader Web3 infrastructure positioning. New investors should focus on understanding Layer-2 scaling technologies, market cycles, and risk management principles before considering exposure. Regardless of asset selection, position sizing should reflect individual risk tolerance, and participants should avoid allocating capital they cannot afford to lose given cryptocurrency markets' inherent volatility characteristics.
* The information is not intended to be and does not constitute financial advice or any other recommendation of any sort offered or endorsed by Gate.