The article "SYNT vs BAT: Comparing Two Leading Cryptocurrency Assets in the Synthetic Asset Space" provides an in-depth comparison of Synternet (SYNT) and Basic Attention Token (BAT). It examines historical price trends, supply mechanisms, institutional adoption, and technological ecosystems, helping investors determine which asset is favorable for their portfolio. The article also outlines potential risks, macroeconomic factors, and investment strategies for both long-term and short-term investors. Suitable for cryptocurrency investors seeking to optimize their asset allocation, this comprehensive analysis aids in decision-making with clear predictions up to 2030.
Introduction: SYNT vs BAT Investment Comparison
In the cryptocurrency market, the comparison between Synternet (SYNT) and Basic Attention Token (BAT) has been an unavoidable topic for investors. The two not only show significant differences in market cap ranking, application scenarios, and price performance, but also represent different positioning in crypto assets.
Synternet (SYNT): Since its launch, it has gained market recognition for powering modular, interoperable data infrastructure across major chains.
Basic Attention Token (BAT): Introduced in 2017, it has been hailed as a solution for digital advertising and user attention, becoming one of the most traded cryptocurrencies globally.
This article will comprehensively analyze the investment value comparison between SYNT and BAT, focusing on historical price trends, supply mechanisms, institutional adoption, technological ecosystems, and future predictions, attempting to answer the question investors care about most:
"Which is the better buy right now?"
I. Price History Comparison and Current Market Status
SYNT and BAT Historical Price Trends
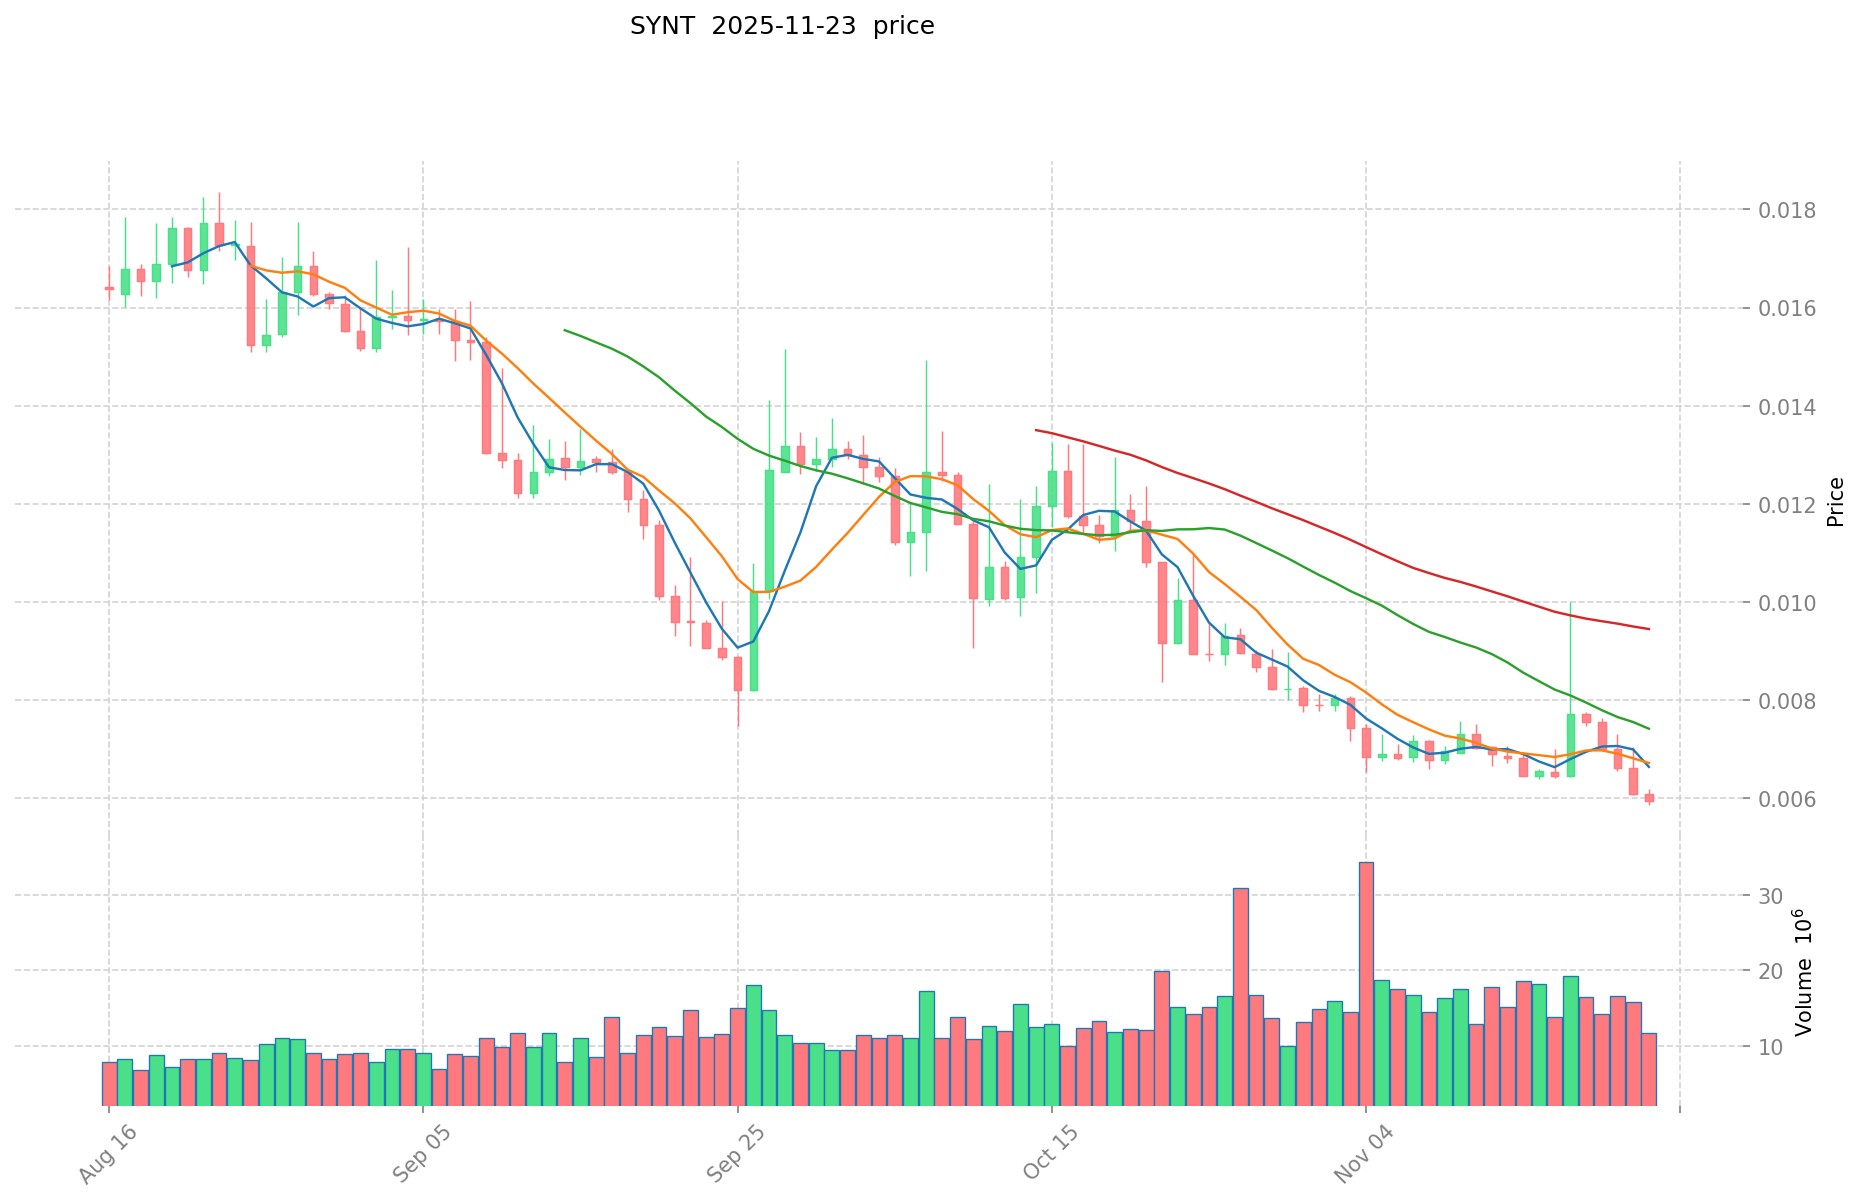
- 2024: SYNT reached its all-time high of $0.09812 on July 25, 2024.
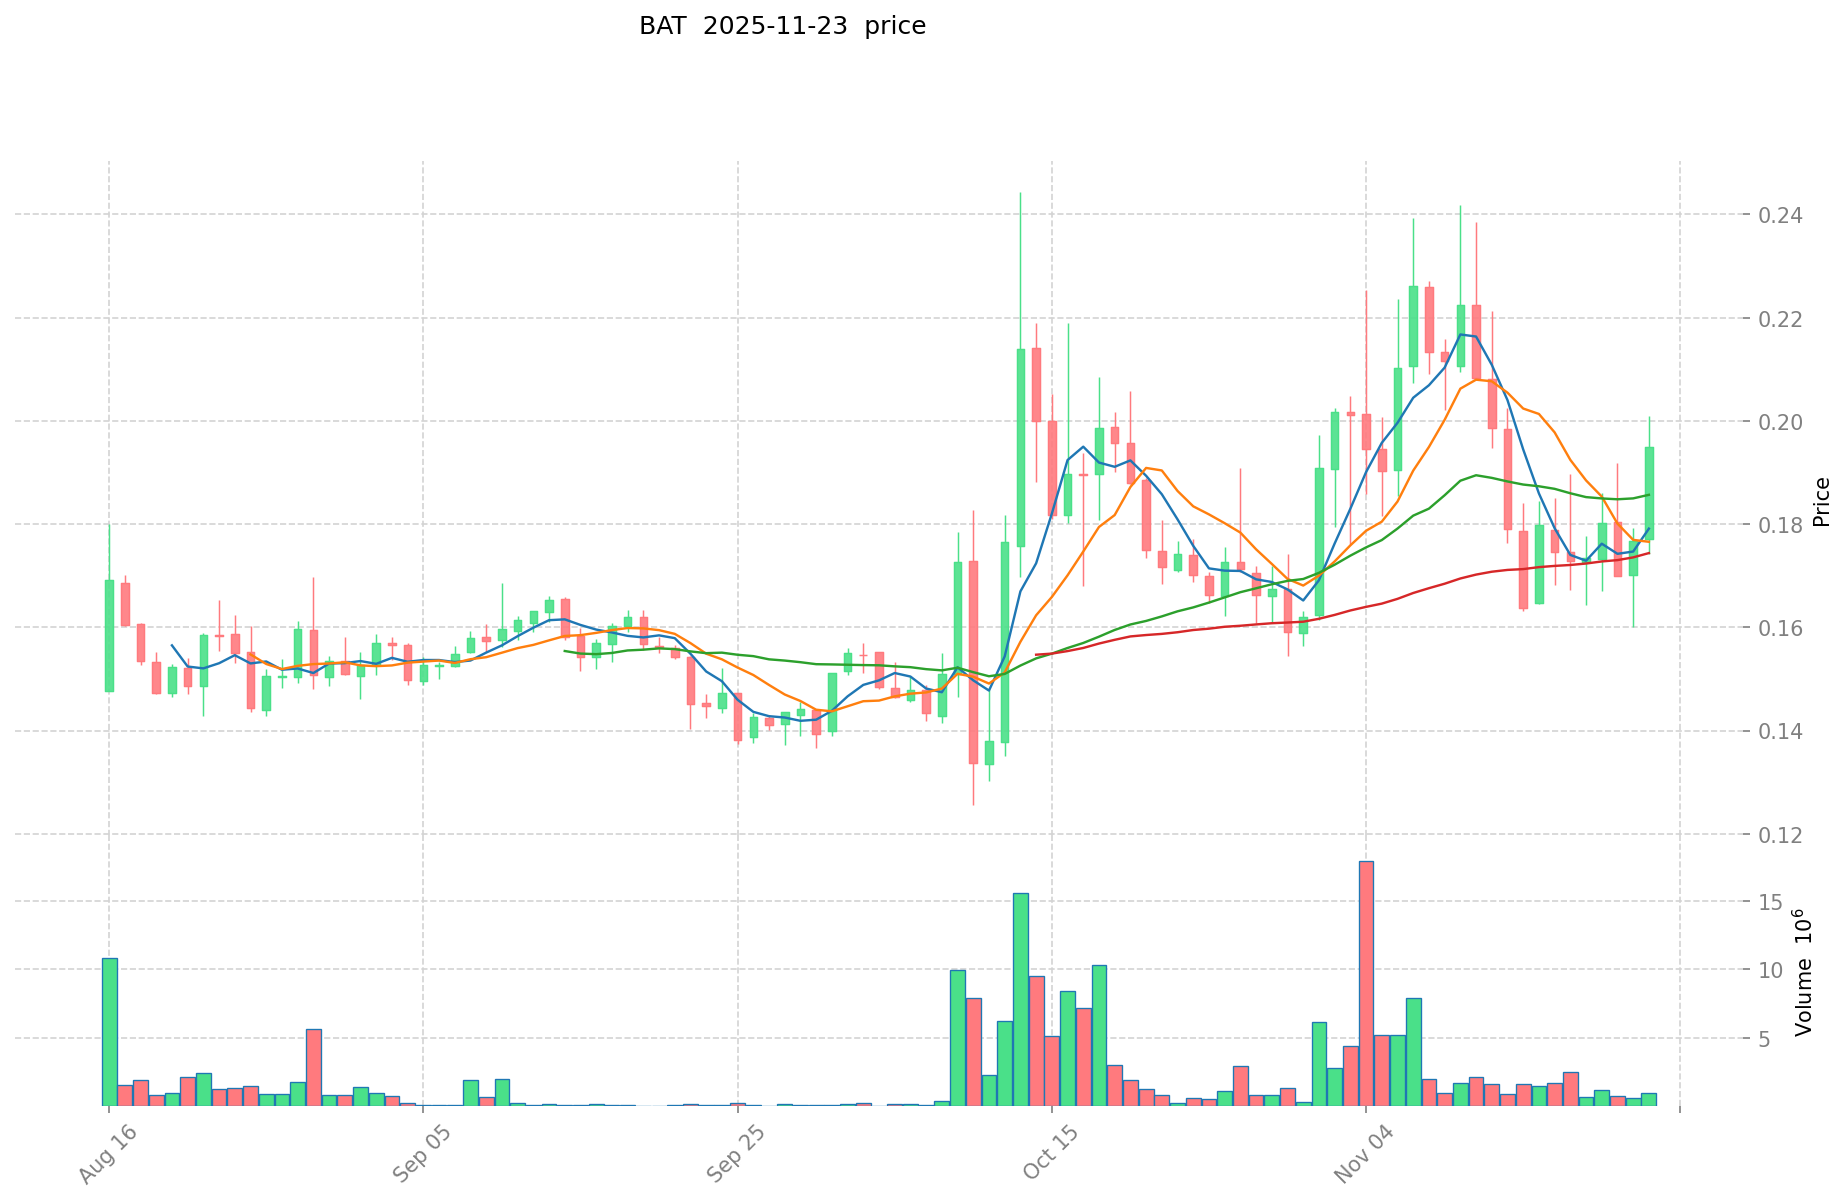
- 2021: BAT hit its all-time high of $1.9 on November 28, 2021.
- Comparative analysis: SYNT has dropped from its high of $0.09812 to its current price of $0.00599, while BAT has fallen from its peak of $1.9 to the current $0.1911.
Current Market Situation (2025-11-23)
- SYNT current price: $0.00599
- BAT current price: $0.1911
- 24-hour trading volume: SYNT $66,264.86 vs BAT $197,420.78
- Market Sentiment Index (Fear & Greed Index): 13 (Extreme Fear)
Click to view real-time prices:
- Check SYNT current price Market Price
- Check BAT current price Market Price
II. Core Factors Affecting Investment Value of SYNT vs BAT
Supply Mechanisms Comparison (Tokenomics)
- SYNT: Fixed supply model with 100 million tokens
- BAT: Inflationary model with user growth-based rewards system
- 📌 Historical Pattern: Fixed supply tokens like SYNT tend to appreciate with increased demand, while BAT's growth-dependent emission can dilute value unless adoption outpaces supply increase.
Institutional Adoption and Market Applications
- Institutional Holdings: BAT has attracted more mainstream media partnerships and advertising clients
- Enterprise Adoption: BAT enjoys wider integration in the digital advertising ecosystem, while SYNT remains focused on synthetic asset trading
- Regulatory Stance: BAT benefits from clearer regulatory frameworks for utility tokens, while synthetic assets face increasing regulatory scrutiny in multiple jurisdictions
Technical Development and Ecosystem Building
- SYNT Technical Upgrades: Implementing cross-chain compatibility and advanced derivatives trading features
- BAT Technical Development: Expanding Brave browser integration and enhancing privacy-preserving advertising technology
- Ecosystem Comparison: BAT has stronger real-world utility in web browsing and digital advertising, while SYNT offers more DeFi-specific functionality with synthetic assets trading
Macroeconomic Factors and Market Cycles
- Performance During Inflation: SYNT's synthetic assets can potentially hedge against inflation by tracking various asset classes
- Macroeconomic Monetary Policy: Interest rate hikes typically impact speculative DeFi assets like SYNT more severely than utility tokens like BAT
- Geopolitical Factors: Increased privacy concerns globally benefit BAT's privacy-focused browser ecosystem, while financial restrictions may limit synthetic asset platforms
III. 2025-2030 Price Prediction: SYNT vs BAT
Short-term Forecast (2025)
- SYNT: Conservative $0.0053-$0.0060 | Optimistic $0.0060-$0.0078
- BAT: Conservative $0.1512-$0.1914 | Optimistic $0.1914-$0.2814
Mid-term Forecast (2027)
- SYNT may enter a growth phase, with prices estimated at $0.0072-$0.0083
- BAT may enter a bullish market, with prices estimated at $0.1326-$0.3380
- Key drivers: Institutional inflows, ETFs, ecosystem development
Long-term Forecast (2030)
- SYNT: Base scenario $0.0089-$0.0107 | Optimistic scenario $0.0107-$0.0152
- BAT: Base scenario $0.2076-$0.3642 | Optimistic scenario $0.3642-$0.3897
View detailed price predictions for SYNT and BAT
Disclaimer: This analysis is for informational purposes only and should not be considered as financial advice. Cryptocurrency markets are highly volatile and unpredictable. Always conduct your own research before making any investment decisions.
SYNT:
| 年份 |
预测最高价 |
预测平均价格 |
预测最低价 |
涨跌幅 |
| 2025 |
0.007787 |
0.00599 |
0.0053311 |
0 |
| 2026 |
0.00812843 |
0.0068885 |
0.005028605 |
15 |
| 2027 |
0.00833439615 |
0.007508465 |
0.0072081264 |
25 |
| 2028 |
0.01037707405325 |
0.007921430575 |
0.00689164460025 |
32 |
| 2029 |
0.012259998100927 |
0.009149252314125 |
0.008142834559571 |
52 |
| 2030 |
0.015200567794687 |
0.010704625207526 |
0.008884838922246 |
78 |
BAT:
| 年份 |
预测最高价 |
预测平均价格 |
预测最低价 |
涨跌幅 |
| 2025 |
0.281358 |
0.1914 |
0.151206 |
0 |
| 2026 |
0.2836548 |
0.236379 |
0.15837393 |
23 |
| 2027 |
0.33802197 |
0.2600169 |
0.132608619 |
36 |
| 2028 |
0.30799001805 |
0.299019435 |
0.179411661 |
56 |
| 2029 |
0.424906617135 |
0.303504726525 |
0.24280378122 |
58 |
| 2030 |
0.3897000688581 |
0.36420567183 |
0.2075972329431 |
90 |
IV. Investment Strategy Comparison: SYNT vs BAT
Long-term vs Short-term Investment Strategy
- SYNT: Suitable for investors focused on DeFi potential and synthetic asset trading
- BAT: Suitable for investors interested in digital advertising and privacy-focused ecosystems
Risk Management and Asset Allocation
- Conservative investors: SYNT: 20% vs BAT: 80%
- Aggressive investors: SYNT: 40% vs BAT: 60%
- Hedging tools: Stablecoin allocation, options, cross-currency portfolios
V. Potential Risk Comparison
Market Risk
- SYNT: Higher volatility due to smaller market cap and DeFi sector fluctuations
- BAT: Exposure to digital advertising market trends and browser adoption rates
Technical Risk
- SYNT: Scalability, network stability, smart contract vulnerabilities
- BAT: Browser integration issues, advertising technology limitations
Regulatory Risk
- Global regulatory policies may impact SYNT more severely due to synthetic asset scrutiny
- BAT may face less regulatory pressure due to its utility token status and established use case
VI. Conclusion: Which Is the Better Buy?
📌 Investment Value Summary:
- SYNT advantages: Fixed supply model, potential for high growth in DeFi sector
- BAT advantages: Wider adoption, established ecosystem, real-world utility in digital advertising
✅ Investment Advice:
- New investors: Consider a higher allocation to BAT due to its more established market position
- Experienced investors: Balanced approach with exposure to both, leveraging SYNT's growth potential
- Institutional investors: BAT for safer exposure to crypto markets, SYNT for diversification in DeFi
⚠️ Risk Warning: Cryptocurrency markets are highly volatile. This article does not constitute investment advice.
None
VII. FAQ
Q1: What are the key differences between SYNT and BAT?
A: SYNT is focused on powering modular, interoperable data infrastructure across major chains, while BAT is designed for digital advertising and user attention. SYNT has a fixed supply of 100 million tokens, whereas BAT has an inflationary model. SYNT is more oriented towards DeFi and synthetic asset trading, while BAT has wider integration in the digital advertising ecosystem.
Q2: Which token has performed better historically?
A: BAT has reached a higher all-time high of $1.9 in November 2021, compared to SYNT's all-time high of $0.09812 in July 2024. However, both tokens have experienced significant drops from their peaks, with SYNT currently at $0.00599 and BAT at $0.1911.
Q3: How do the supply mechanisms of SYNT and BAT differ?
A: SYNT has a fixed supply model with 100 million tokens, which tends to appreciate with increased demand. BAT has an inflationary model with a user growth-based rewards system, which can potentially dilute value unless adoption outpaces supply increase.
Q4: What are the main risk factors for each token?
A: SYNT faces higher volatility due to its smaller market cap and exposure to DeFi sector fluctuations, as well as potential regulatory scrutiny of synthetic assets. BAT is exposed to digital advertising market trends and browser adoption rates, with potential technical risks related to browser integration and advertising technology limitations.
Q5: Which token is considered a safer investment for new investors?
A: BAT is generally considered a safer investment for new investors due to its more established market position, wider adoption, and real-world utility in digital advertising. It also faces less regulatory pressure due to its utility token status and established use case.
Q6: What are the long-term price predictions for SYNT and BAT?
A: By 2030, SYNT is predicted to reach $0.0089-$0.0152 in an optimistic scenario, while BAT is expected to reach $0.2076-$0.3897. However, these predictions are subject to market volatility and should not be considered as financial advice.
Q7: How should investors approach asset allocation between SYNT and BAT?
A: Conservative investors might consider allocating 20% to SYNT and 80% to BAT, while more aggressive investors could opt for a 40% SYNT and 60% BAT split. The exact allocation should be based on individual risk tolerance and investment goals.
* The information is not intended to be and does not constitute financial advice or any other recommendation of any sort offered or endorsed by Gate.


