This comprehensive guide explores the Bearish Harami candlestick pattern, a critical technical analysis tool for identifying potential trend reversals in cryptocurrency markets on Gate exchange. The article explains how to recognize this distinctive pattern—a large bullish candle followed by a smaller bearish candle completely contained within it—and the importance of waiting for confirmation signals before executing trades. Readers will discover how to distinguish Bearish Harami from Bullish Harami patterns, understand the specialized Harami Cross variation, and learn proper confirmation techniques using subsequent candlestick movements and volume indicators. The guide emphasizes integrating Harami patterns with support/resistance levels, moving averages, and broader market analysis to minimize false signals and improve trading success rates in volatile cryptocurrency environments.
What Is a Harami Candle?
Harami candles represent a distinctive candlestick pattern widely utilized by technical analysts to identify potential trend reversals in financial markets, including cryptocurrency trading. The term "harami" originates from the Japanese word meaning "pregnant," which aptly describes the visual appearance of this pattern where a smaller candlestick appears to be contained within the body of a larger preceding candle.
This reversal pattern serves as a valuable tool for investors when making critical buying or selling decisions in the crypto market. The harami candlestick pattern is characterized by a specific formation: the real body of one candlestick is completely engulfed by the real body of the previous candlestick. This unique configuration can manifest in either uptrend or downtrend scenarios, making it a versatile indicator for traders.
To accurately identify a harami candlestick pattern, traders should focus on two essential criteria:
- The second candlestick must be noticeably smaller than the first candlestick, indicating a reduction in market momentum.
- The second candlestick's real body must be entirely contained within the first candlestick's real body, creating the characteristic "pregnant" appearance.
Understanding these formation rules is crucial for traders seeking to leverage harami patterns effectively in their technical analysis toolkit. The pattern's reliability increases when it appears after a sustained trend, suggesting that the prevailing market momentum may be losing strength.
How To Confirm Trend Reversal With Harami Candles
Identifying a potential harami candlestick pattern is only the first step in the trading process. The critical next phase involves waiting for market confirmation of the anticipated reversal. Premature action without proper confirmation can lead to false signals and potential losses.
The most reliable confirmation method involves observing the candlestick that forms immediately after the harami pattern. This subsequent candle provides crucial information about whether the market has truly reversed direction or if the harami pattern was merely a temporary pause in the existing trend.
When the next candlestick closes as a bullish candle (typically green or white), this serves as strong confirmation that the market has indeed reversed from a downtrend and is now establishing an upward trajectory. Conversely, if the following candlestick closes as a bearish candle (typically red or black), this confirms that the market has reversed from an uptrend and is now moving in a downward direction.
Traders should also consider volume indicators during this confirmation phase. Higher trading volume accompanying the confirmation candle typically suggests stronger conviction in the reversal, making the signal more reliable for position entry.
There are two primary types of harami candlestick patterns that traders encounter: the Bearish Harami pattern and the Bullish Harami pattern. Each pattern has distinct characteristics and implications for market direction.
Bullish Harami Candle Pattern
The Bullish Harami Candle pattern serves as a potential indicator of momentum shift from bearish to bullish territory. This formation emerges when a large bearish candlestick is followed by a smaller bullish candlestick, with the latter's opening price falling within the range of the former's body. This configuration suggests that selling pressure is diminishing and buying interest may be emerging.
The reliability of Bullish Harami patterns can vary based on several factors. These patterns may exhibit either short or long tails (shadows), though the length of these tails can provide additional context about market dynamics. Patterns appearing in oversold market conditions are generally considered more reliable, as they suggest that selling pressure has been exhausted and a rebound is more likely.
Traders should note that not all reversals signaled by Bullish Harami patterns will result in substantial price movements. Some reversals may be minor or short-lived. However, experienced traders often use this pattern as a preliminary indication to consider entering long positions, especially when combined with other technical indicators such as support levels, moving averages, or momentum oscillators.
For optimal trading results, investors should wait for confirmation through the next candlestick and consider the broader market context before committing capital to long positions based solely on this pattern.
Bearish Harami Candle Pattern
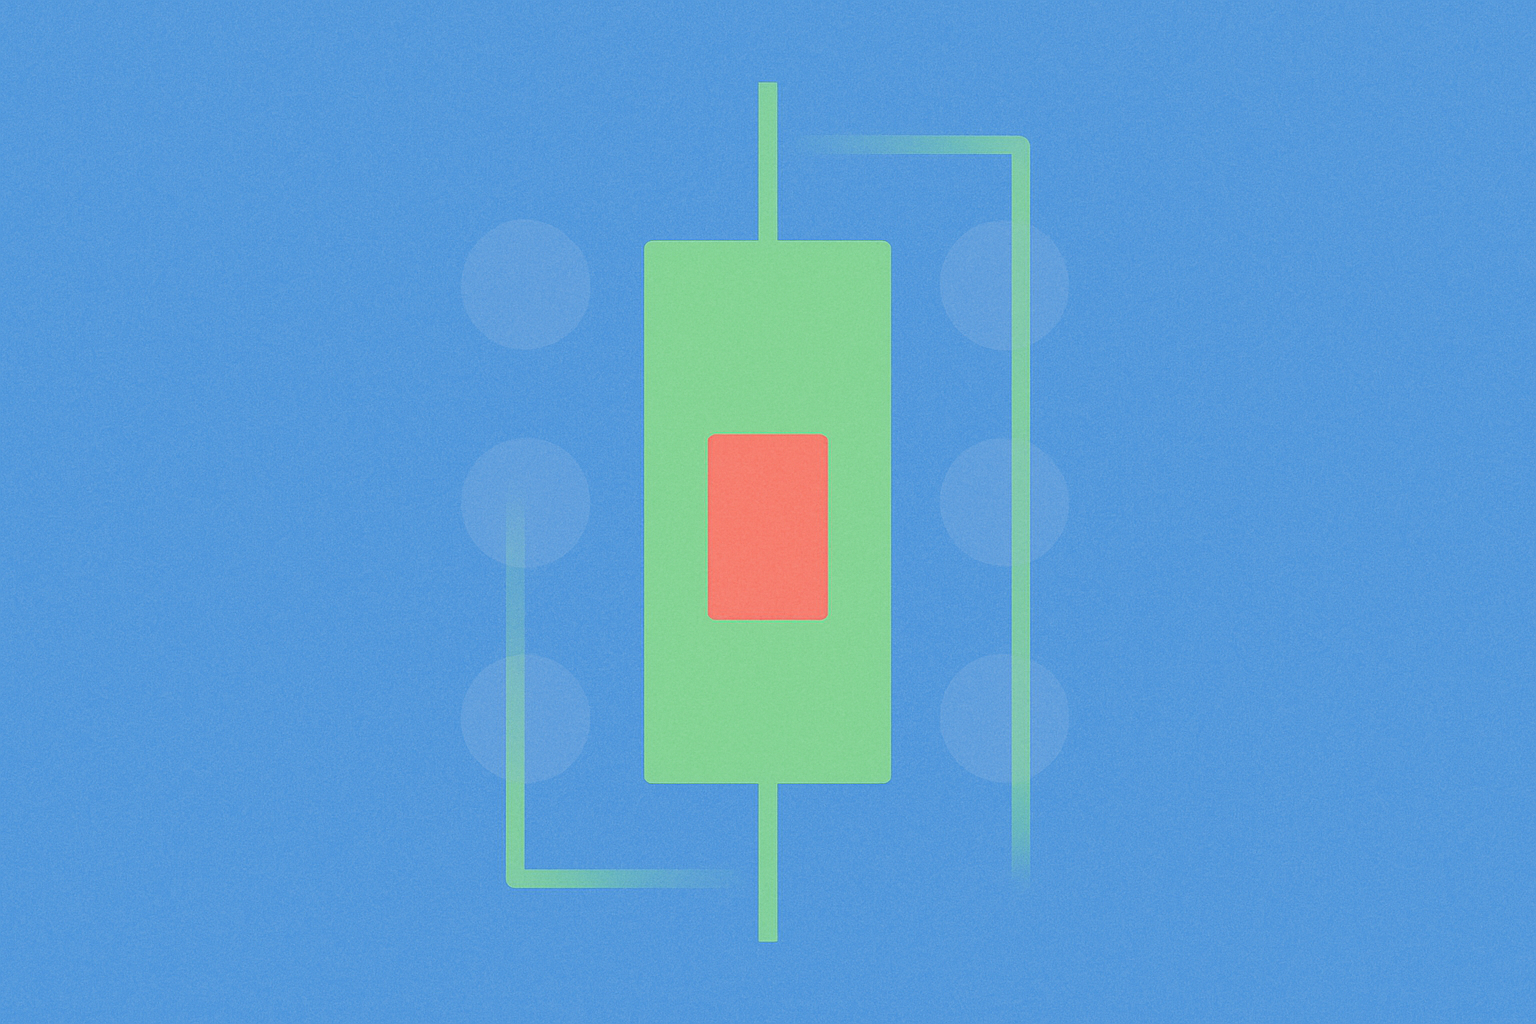
A Bearish Harami Candle pattern forms through a specific sequence: the first candlestick is typically a long bullish candle reflecting strong buying pressure, while the second is a small bearish candle that forms entirely within the body of the first candle. This containment suggests that bullish momentum is weakening and bearish forces are beginning to assert themselves.
This pattern carries bearish implications because it indicates that bulls have lost control of the market and bears are starting to take over. The smaller bearish candle represents indecision or weakening conviction among buyers, potentially signaling an impending downward reversal. While the bearish harami may not be as consistently reliable as some other candlestick patterns like the engulfing pattern or evening star, it remains a useful tool for identifying potential reversals in established uptrends.
Similar to the Bullish Harami pattern, proper confirmation is essential when trading based on a Bearish Harami formation. After identifying this pattern, traders should look for a subsequent bearish candlestick that confirms the reversal. This confirmation candle should ideally close below the low of the harami pattern, providing a clear sell signal.
When confirmation occurs, it may trigger a sell signal indicating that investors should consider reducing exposure or exiting long positions in the market. Conservative traders might also consider this an opportunity to enter short positions, though proper risk management is essential.
What Is a Harami Cross Candle?
The Harami Cross represents a specialized variation of the standard harami pattern, distinguished by its exceptionally small real body that closely resembles a Doji candlestick. The defining characteristic of a Harami Cross is this minimal real body—the smaller it is, the more significant the pattern becomes. In an ideal Harami Cross, the opening and closing prices are nearly identical, creating a cross-like appearance.
This absence of a substantial real body following a strong directional move carries important implications. It indicates that the previous trend is losing momentum and approaching exhaustion, suggesting that a reversal may be imminent. The Doji-like second candle represents a state of market equilibrium where neither buyers nor sellers have gained control.
Like the regular harami pattern, the Harami Cross pattern can signal either bullish or bearish trend reversals depending on its position within the broader price chart context. The pattern's interpretation relies heavily on whether it appears after an uptrend or downtrend.
Many experienced traders attribute greater importance to the Harami Cross candle pattern compared to the regular harami pattern. This preference stems from the Doji-like second candle, which represents a more pronounced state of indecision and potential trend exhaustion. Just as with normal harami patterns, there are two distinct types of Harami Cross patterns: Bullish and Bearish.
Four Bullish Harami Cross Signs
- Typically appears during a sustained downward trend, indicating potential exhaustion of selling pressure.
- Signals that market momentum is transitioning from a downward trend to either a neutral consolidation phase or an emerging upward trend.
- The first candle displays a strong red (bearish) body, meaning the red candle is distinctively large and represents significant selling pressure.
- The second candle resembles a green Bullish Doji, characterized by its cross-like shape formed when opening and closing prices occur at nearly the same level. This candle must be completely contained within the range of the preceding red candle without extending beyond its boundaries.
Four Bearish Harami Cross Signs
- Typically appears during a sustained upward trend, suggesting potential exhaustion of buying pressure.
- Signals that market momentum is transitioning from an upward trend to either a neutral consolidation phase or an emerging downward trend.
- The first candle displays a strong green (bullish) body, meaning the green candle is distinctively large and represents significant buying pressure.
- The second candle resembles a red Bearish Doji, characterized by its cross-like shape where opening and closing prices are nearly identical. This candle must be completely contained within the range of the preceding green candle without extending beyond its boundaries.
Conclusion
While harami candles and harami cross patterns provide valuable insights into potential market reversals, it is crucial that traders maintain a comprehensive analytical approach rather than relying solely on these patterns for trading decisions. Successful trading requires integrating multiple sources of information and analysis techniques.
Traders should examine previous price trends to understand the broader market context, analyze price action patterns to identify support and resistance levels, and stay informed about project-specific developments and news that could impact cryptocurrency valuations. Additionally, understanding the larger macroeconomic environment, including factors such as regulatory changes, market sentiment, and institutional adoption trends, is essential for making informed trading decisions.
Without incorporating these additional layers of analysis, depending exclusively on harami candle patterns to establish trading positions carries excessive risk. A prudent trading strategy combines technical analysis tools like harami patterns with fundamental analysis, risk management principles, and a clear understanding of market dynamics. This holistic approach significantly improves the probability of successful trades while helping traders avoid false signals and minimize potential losses in the volatile cryptocurrency market.
FAQ
What are Bullish Harami and Bearish Harami candlestick patterns? What is the difference between them?
Bullish Harami signals a potential reversal of downtrends, while Bearish Harami indicates potential reversal of uptrends. Bullish Harami suggests price recovery ahead; Bearish Harami suggests price decline ahead. They differ in market sentiment reversal direction.
How to identify and correctly judge Harami candlestick patterns on K-line charts?
Identify Harami patterns by spotting a large bearish candle followed by a smaller bullish candle completely contained within its body. Bullish Harami signals upward reversal; bearish Harami signals downward reversal. Confirm with support/resistance levels and other technical indicators for accuracy.
Harami形态出现后通常预示什么样的价格走势?
Harami形态通常预示价格反转。牛市Harami在下降趋势中出现,预示价格可能反弹上升;熊市Harami在上升趋势中出现,预示价格可能下跌。这是重要的技术反转信号。
What are the trading strategies for Bullish Harami and Bearish Harami respectively?
Bullish Harami signals potential end of downtrend; traders buy after its formation. Bearish Harami indicates possible end of uptrend; traders sell after its appearance. Both patterns confirm trend reversal signals through subsequent candle confirmation.
What is the difference between Harami and Engulfing patterns?
Harami pattern occurs when the previous candle is partially engulfed by the current candle, while Engulfing pattern shows the previous candle completely engulfed. Engulfing signals stronger reversal strength than Harami.
What risk factors should be considered when trading with Harami patterns?
When trading Harami patterns, monitor market volatility and potential capital loss. System performance may be affected by market conditions and technical factors. Implement proper risk management and stop-loss strategies to protect your trades.
Is the reliability of Harami patterns the same across different time frames (daily, 4-hour, etc.)?
Harami reliability varies across time frames. Longer time frames like daily charts are more reliable, while shorter frames show higher noise. Multi-timeframe confirmation significantly improves signal accuracy and trading success rates.
How to combine other technical indicators to confirm the validity of Harami patterns?
Combine Harami patterns with moving averages, RSI, or MACD to enhance accuracy. Analyze trading volume changes and price action confirmation to validate the pattern's strength and reliability.
* The information is not intended to be and does not constitute financial advice or any other recommendation of any sort offered or endorsed by Gate.