This comprehensive guide explores the Golden Cross, a pivotal technical indicator where a shorter-term moving average crosses above a longer-term moving average, signaling bullish momentum. The article examines the three distinct stages: sustainable downtrend, moving average crossover, and uptrend development. It contrasts the Golden Cross with its bearish counterpart, the Death Cross, helping traders identify trend reversals on Gate. The guide emphasizes that while Golden Cross patterns serve as valuable tools for analyzing market momentum shifts, empirical research shows mixed results, with less than 35% of instances outperforming traditional buy-and-hold strategies. Crucially, the article stresses that no single indicator should operate in isolation. Successful trading requires combining Golden Cross signals with volume analysis, support-resistance levels, RSI, MACD, and fundamental factors. This holistic approach, paired with disciplined risk management and proper position sizing, forms the foundation for
Summary
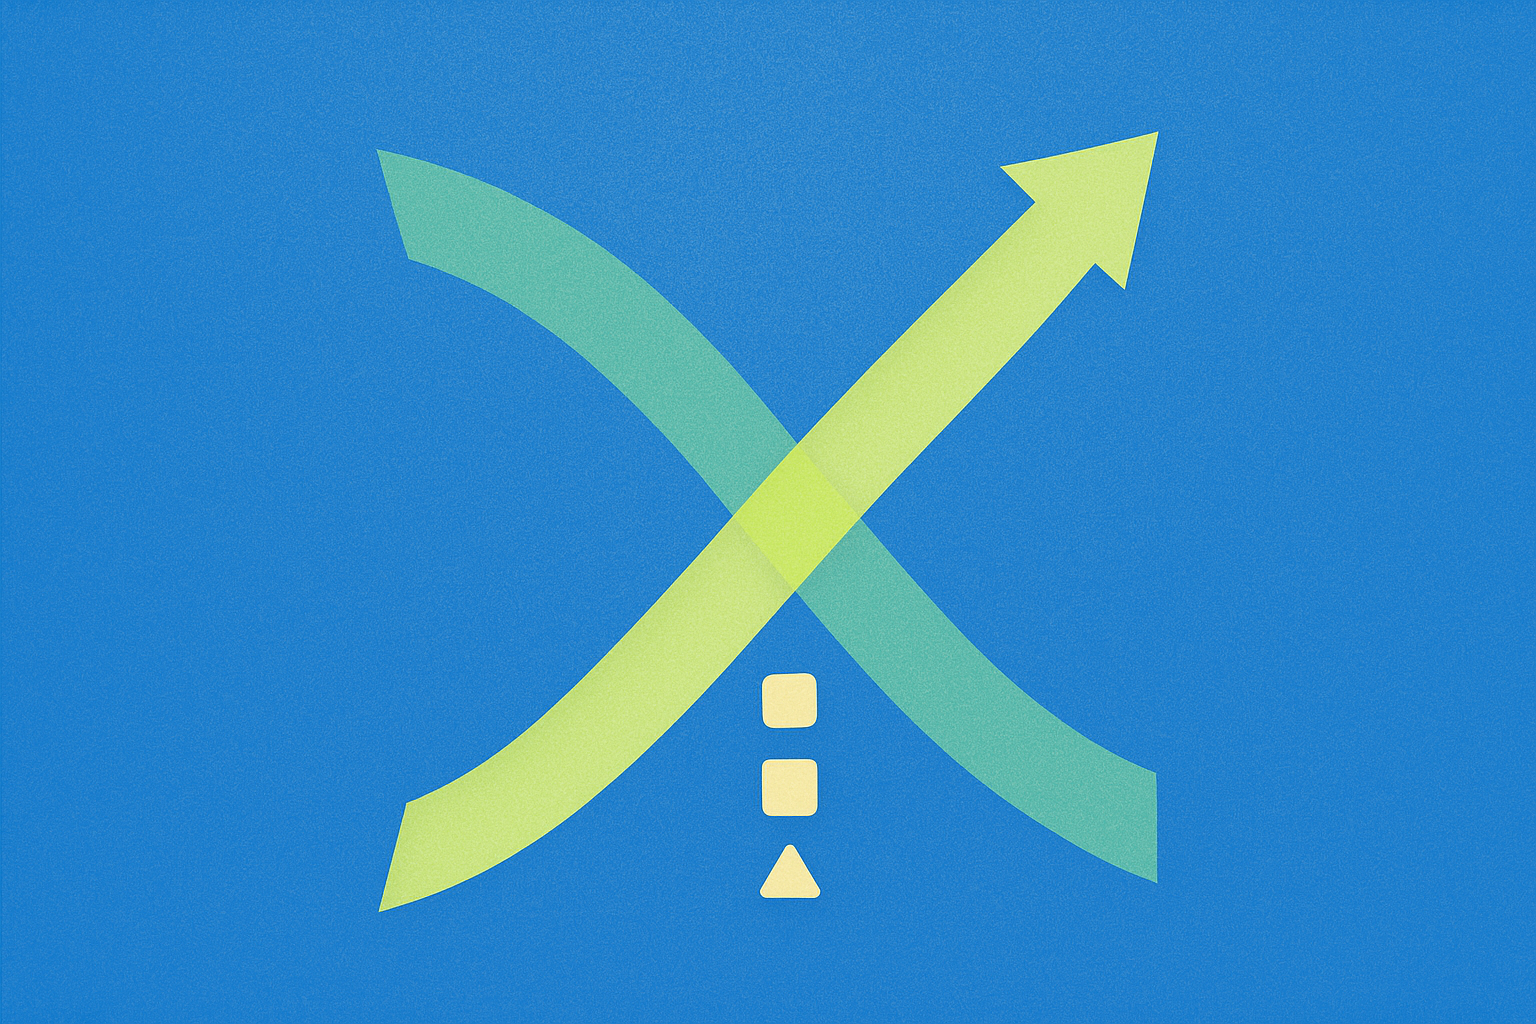
The Golden Cross is a technical indicator pattern that occurs when a shorter-term moving average crosses above a longer-term moving average. This crossover pattern is widely recognized in technical analysis as a potential bullish signal, suggesting that an asset's price may continue to rise in the long term.
While the Golden Cross formation indicates long-term profits and upward trends, the Death Cross represents the opposite scenario. The Death Cross predicts long-term losses and suggests that asset prices may decline to progressively lower support levels. Understanding both patterns is crucial for traders seeking to identify potential trend reversals and make informed trading decisions.
These crossover patterns serve as important tools in technical analysis, helping traders visualize market momentum shifts and potential entry or exit points. However, it's essential to note that no single indicator should be used in isolation, and these patterns work best when combined with other technical and fundamental analysis methods.
Crypto Trends & Indicators
From support and resistance levels to trend lines and technical indicators, trading involves monitoring various parameters that help predict market movements. Price patterns are typically identified using trend lines drawn on an asset's candlestick chart, providing visual representations of market behavior over time.
It's important to understand that patterns themselves don't influence market movements; markets move independently based on supply, demand, and numerous other factors. Patterns are simply tools that help us visualize and interpret these movements, allowing traders to make more informed decisions based on historical price action and statistical probabilities.
Technical indicators serve as mathematical calculations based on price, volume, or open interest data. They help traders identify trends, momentum, volatility, and potential reversal points. Among these indicators, moving averages stand out as one of the most fundamental and widely used tools in technical analysis.
Moving Average
A Moving Average is a technical indicator that smooths out price data by creating a constantly updated average price over a specific time period. Depending on its position and trajectory, a moving average can indicate both long-term and short-term potential market movements.
An ascending moving average may signify rapid gains and bullish momentum, suggesting that buyers are in control and pushing prices higher. Conversely, a descending moving average can predict imminent losses and bearish pressure, indicating that sellers are dominating the market.
Moving averages come in various types, including Simple Moving Averages (SMA) and Exponential Moving Averages (EMA). The choice between different moving average types and timeframes depends on a trader's strategy, risk tolerance, and investment horizon. Shorter-term moving averages react more quickly to price changes, while longer-term moving averages provide a broader perspective on overall trends.
Golden Cross and Death Cross
What is Golden Cross?
The Golden Cross is a bullish technical indicator pattern that occurs when a shorter-term moving average crosses above a longer-term moving average. This crossover suggests a potential shift from a bearish or consolidating market to a bullish trend, making it one of the most anticipated signals in technical analysis.
In standard practice, traders commonly use the 50-day and 200-day moving averages to monitor for Golden Cross formations. When the 50-day moving average crosses above the 200-day moving average, it generates a Golden Cross signal. A Golden Cross supported by high trading volume can serve as a strong indication of an incoming bull market, as increased volume confirms genuine market interest and participation.
The significance of a Golden Cross lies in its ability to capture major trend reversals. When shorter-term price momentum (represented by the 50-day MA) surpasses longer-term momentum (represented by the 200-day MA), it suggests that recent buying pressure has become strong enough to overcome the prevailing long-term trend, potentially marking the beginning of a sustained upward movement.
Three Stages of the Golden Cross Pattern
Understanding the Golden Cross requires recognizing its three distinct stages, each representing a different phase of market psychology and price action:
-
Sustainable Downtrend: The first stage involves a prolonged downtrend that exhausts sellers and creates capitulation. During this phase, selling pressure gradually diminishes as prices reach levels that attract value buyers. This stage typically results in a consolidating bottom, where prices stabilize and form a base. The exhaustion of sellers is crucial because it sets the stage for a potential reversal, as fewer participants are willing to sell at lower prices.
-
Moving Average Crossover: The second stage is the actual crossover event, where the shorter-term moving average (typically 50-day) crosses above the longer-term moving average (typically 200-day). This crossover triggers a breakout and represents a critical inflection point in market sentiment. The crossover suggests that recent price momentum has shifted decisively to the upside, with buying pressure overcoming the previous downward trend. Traders often view this as a signal to enter long positions or add to existing holdings.
-
Uptrend Development: The third stage involves the development of a sustained uptrend following the crossover. In this phase, both moving averages act as dynamic support levels, with prices typically remaining above them. As the uptrend continues, the moving averages push prices further upward, creating a self-reinforcing cycle. Buyers gain confidence from the bullish signal, leading to increased demand and further price appreciation. This stage can last for extended periods, depending on overall market conditions and the strength of the underlying trend.
What is Death Cross?
The Death Cross represents the exact opposite of the Golden Cross and serves as a bearish technical indicator. While the Golden Cross indicates long-term profits and upward momentum, the Death Cross signals long-term losses and suggests that asset prices may decline to progressively lower support levels.
A Death Cross occurs when a shorter-term moving average (typically the 50-day MA) crosses below a longer-term moving average (typically the 200-day MA). This crossover pattern suggests a shift from bullish or neutral market conditions to a bearish trend, indicating that recent selling pressure has become strong enough to overcome longer-term support.
The Death Cross is particularly significant because it often precedes extended periods of price decline. When short-term momentum turns negative relative to long-term trends, it suggests that market sentiment has deteriorated and that sellers have gained control. However, like the Golden Cross, the Death Cross should not be used in isolation and works best when confirmed by other technical indicators, volume analysis, and fundamental factors.
Traders often interpret a Death Cross as a signal to reduce long positions, implement stop-loss orders, or consider short positions, depending on their risk management strategy and market outlook. The pattern's reliability increases when accompanied by high trading volume and confirmed by other bearish indicators such as declining RSI or negative MACD divergence.
Is Golden Cross a Bullish Indicator?
Research presents conflicting views on whether the Golden Cross formation can reliably serve as a bullish indicator for future price performance. While many traders and analysts consider it a significant signal, empirical evidence suggests that its predictive power may be limited in certain market conditions.
An analysis conducted covering the period from 1950 to 2012 revealed that cross formations did not consistently produce strong growth results compared to traditional investment strategies. The observed data showed that less than 35% of instances demonstrated that the Golden Cross strategy outperformed simple buy-and-hold portfolios, raising questions about its universal applicability.
This finding suggests several important considerations for traders:
First, the effectiveness of the Golden Cross may vary depending on market conditions, asset classes, and timeframes. In strongly trending markets, the signal may work better than in choppy or sideways markets where false signals are more common.
Second, the Golden Cross should not be viewed as a standalone trading strategy but rather as one component of a comprehensive analytical framework. Successful traders typically combine moving average crossovers with other technical indicators, volume analysis, fundamental research, and risk management principles.
Third, the historical performance of any technical indicator may not guarantee future results, as market dynamics evolve over time. Factors such as algorithmic trading, increased market participation, and changing economic conditions can affect how traditional patterns perform in modern markets.
Despite these limitations, the Golden Cross remains a widely monitored indicator because it effectively captures shifts in market momentum and can help traders identify potential trend changes. Its value lies not in providing guaranteed predictions but in offering a structured framework for analyzing price movements and making informed trading decisions.
Conclusion
No indicator or analysis method can truly predict the future with absolute certainty. At best, technical indicators provide us with the information necessary to make reasoned estimates and probabilistic assessments of potential market movements. The Golden Cross and Death Cross patterns are valuable tools in a trader's arsenal, but they should never be relied upon exclusively.
Chart patterns and indicators should always be evaluated in conjunction with other metrics to conduct a more comprehensive market analysis. This holistic approach might include examining trading volume, relative strength indicators, MACD, Fibonacci retracements, support and resistance levels, and fundamental factors such as market sentiment, regulatory developments, and macroeconomic conditions.
Trading based solely on price movements and technical patterns can lead to significant losses, especially during periods of high volatility or when market conditions change rapidly. The evidence supporting the Golden Cross indicator remains largely ambiguous and dependent on specific market circumstances, asset classes, and timeframes.
Successful trading requires a balanced approach that combines technical analysis with risk management, position sizing, and emotional discipline. While the Golden Cross can signal potential opportunities, traders should always confirm signals with multiple indicators, maintain appropriate stop-loss levels, and never risk more capital than they can afford to lose.
Ultimately, the Golden Cross and Death Cross serve as useful reference points for understanding market momentum shifts, but they work best as part of a diversified analytical toolkit rather than as standalone predictive mechanisms. Continuous learning, adaptation to changing market conditions, and prudent risk management remain the cornerstones of long-term trading success.
FAQ
What is Golden Cross? What is its significance in technical analysis?
Golden Cross occurs when a short-term moving average crosses above a long-term moving average, signaling bullish momentum. Traders view it as a buy signal indicating potential uptrend in asset prices.
What is the difference between Golden Cross and Death Cross? How to distinguish between these two signals?
Golden Cross occurs when a short-term moving average crosses above a long-term moving average, signaling an uptrend. Death Cross happens when a short-term moving average crosses below a long-term moving average, indicating a downtrend. Distinguish them by observing the direction of the moving average crossover.
What does a golden cross mean? Is it a buy signal?
A golden cross occurs when a short-term moving average crosses above a long-term moving average. It's widely regarded as a bullish buy signal, indicating upward momentum. However, traders should combine it with other technical indicators for confirmation.
How to identify golden cross on charts? Which moving averages are needed?
Identify golden cross on charts using the 50-day and 200-day moving averages. A golden cross occurs when the 50-day moving average crosses above the 200-day moving average, signaling an uptrend.
How accurate is the Golden Cross? Is there significant risk when trading with it?
Golden Cross accuracy is moderate with inherent trading risks. It works best combined with other technical indicators. Using limit orders helps control potential losses. Success depends on market conditions and proper risk management strategy.
Does the golden cross have different applications in stocks and cryptocurrencies?
The golden cross applies similarly in both stocks and cryptocurrencies. Both use short-term moving averages crossing above long-term averages as bullish signals. However, crypto markets react faster due to 24/7 trading, making signals more frequent and volatile compared to traditional stock markets.
* The information is not intended to be and does not constitute financial advice or any other recommendation of any sort offered or endorsed by Gate.