After a 70% decline in US stock assets, I realized the true cause of the big crash

Author: XinGPT
As the wave of crashes around the Spring Festival continues, first gold and silver prices collapsed from high levels, then cryptocurrencies began flooding downward without support, breaking through all key support levels. Finally, U.S. stocks, Hong Kong stocks, and major A-shares kept plunging—losing in the daytime and again at night, losing on the left and on the right—asset allocations across different sectors all turned upside down.
Fortunately, I had mostly liquidated my crypto holdings earlier, but I couldn’t dodge the sharp decline in the stock market. Some stocks like Figma and Xpeng Motors dropped over 70% (not 70% of all assets, forgive me for once again using clickbait).
There are a few main interpretations circulating in the market:
- They say Anthropic’s legal AI is so powerful that in the future, professional software will be unnecessary—big models will suffice—causing software stocks to crash.
- They say Google’s earnings report was good, but its capital expenditure guidance was too high—50% above market expectations.
- They say that the upcoming Fed Chair Warsh is hawkish, aiming to maintain a strong dollar, not easing easily, and possibly shrinking the balance sheet.
I think all of the above are bullshit.
Analysts often find seemingly reasonable reasons for market declines after the fact, but these reasons are usually noise, masking the true core trend and operational logic of the market.
- No matter how powerful Anthropic’s legal AI is, has it generated significant revenue? Can it surpass SAP? SAP and other software vendors are just waiting to be disrupted without doing anything?
- If Google’s capital expenditure is high, you worry about cash flow; if it’s low, you worry about insufficient spending, AI upstream and downstream industries lack funds, and Google AI will fall behind.
- The Warsh scenario is even more absurd—he’s not even in office yet, and people are already fantasizing about what he will do. You’re more of a dreamer than a rookie investor. Even if Warsh takes office, completely overturning the Fed’s previous policy tone is very difficult, especially with poor employment data making it hard for the hawks to push aggressively.
I believe this wave of decline is caused by liquidity tightening and high valuations, leading to intense market volatility: just like Alex climbing Taipei 101— the higher he climbs, the stronger the wind, from a gentle breeze at ground level to fierce gales at 100 meters, making my heart sway more and more.
What is the current valuation level of U.S. stocks?
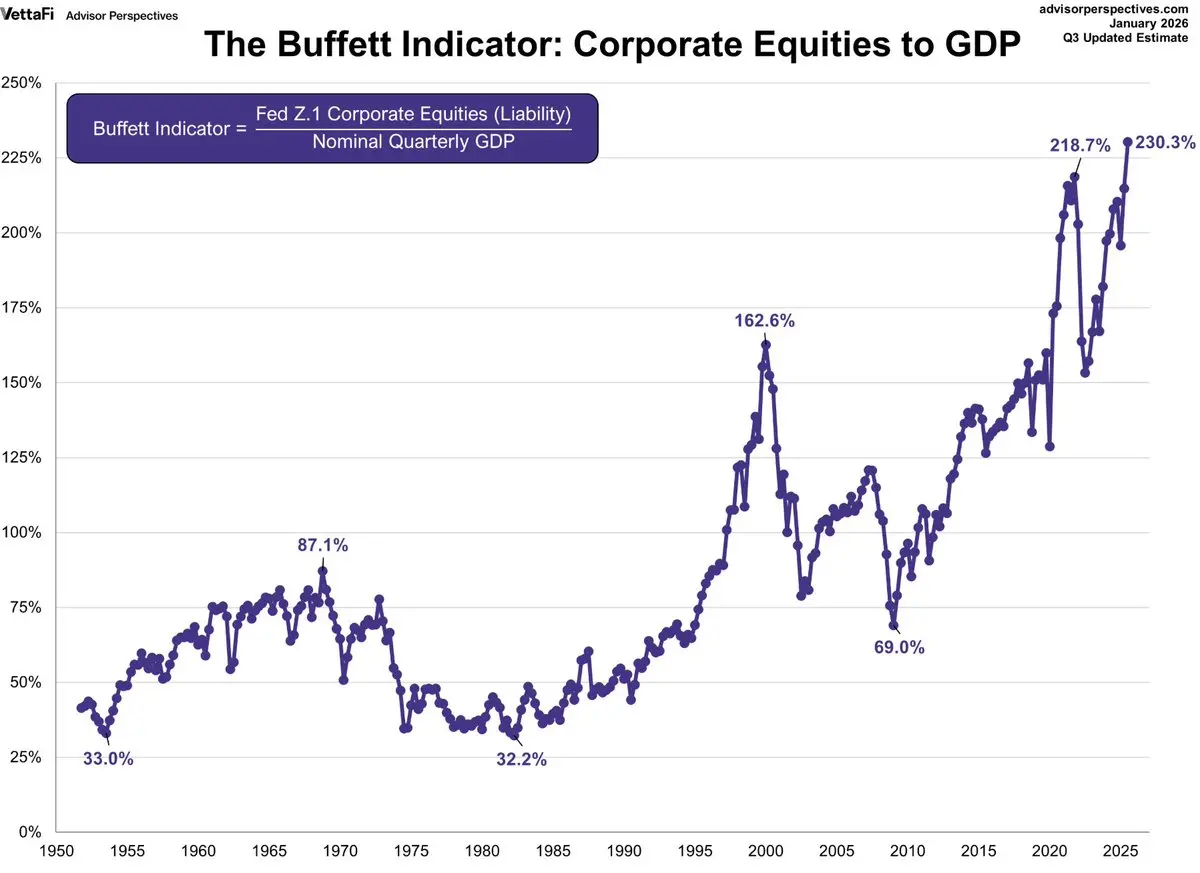
One indicator is the Buffett Indicator, which compares the total market capitalization to GDP. Buffett considers a ratio of 75%-90% reasonable; over 120% or higher is considered seriously overvalued—like playing with fire.
Currently, this indicator is at 230%.
Of course, high valuation doesn’t necessarily mean a crash is imminent. The Buffett Indicator is based on GDP data, which is lagging, so the actual situation might not be as extreme.
But stocks are definitely no longer undervalued, which will amplify market volatility, as profit-taking institutions can exit at any time.
The S&P 500 Forward P/E ratio is 22.0x, compared to the 30-year average of 17.1x; 22.0x is roughly (22.0-17.1)/(20.4-17.1) ≈ +1.5 standard deviations. That means valuations are in the “significantly expensive” zone, already above the “+1σ line” (20.4x). It’s approaching the P/E ratio of 25.2x seen during the 2000 dot-com bubble.
Meanwhile, the tightening of liquidity is like the wind in the sky, howling toward the market:
1. The first major blow to liquidity comes from Japanese bonds.
Every jump in Japanese government bond yields drains liquidity from the global markets.
Japan is the world’s largest creditor nation, and its long-standing zero-interest-rate policy has fostered a huge “yen carry trade”: global investors borrow low-cost yen to invest in higher-yield overseas assets (like U.S. stocks).
When Japanese bond yields rise rapidly, narrowing the interest rate differential, the appeal of carry trades diminishes or even turns into losses, triggering a large-scale unwinding: investors sell off overseas assets to buy yen and repay loans. This process causes a global “deleveraging” and asset sell-off.
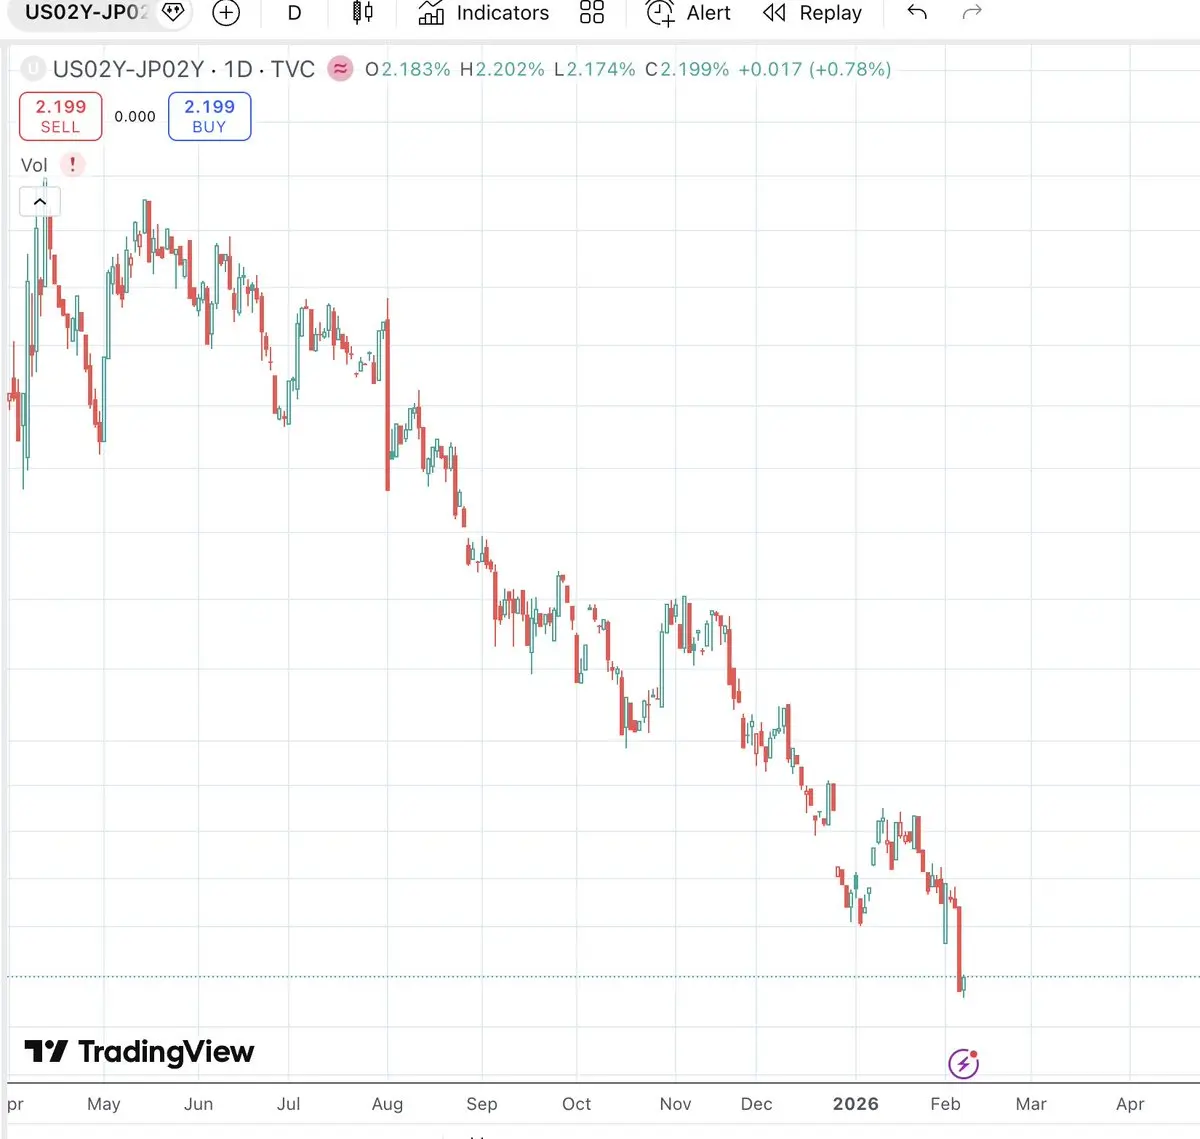
In early February, the short- to medium-term interest rate spread—specifically, the U.S. 2-year yield minus the Japanese 2-year yield—plummeted sharply; in other words, carry trade leverage is shrinking, and funds are being pulled back.
2. TGA account and government bond issuance: the root cause
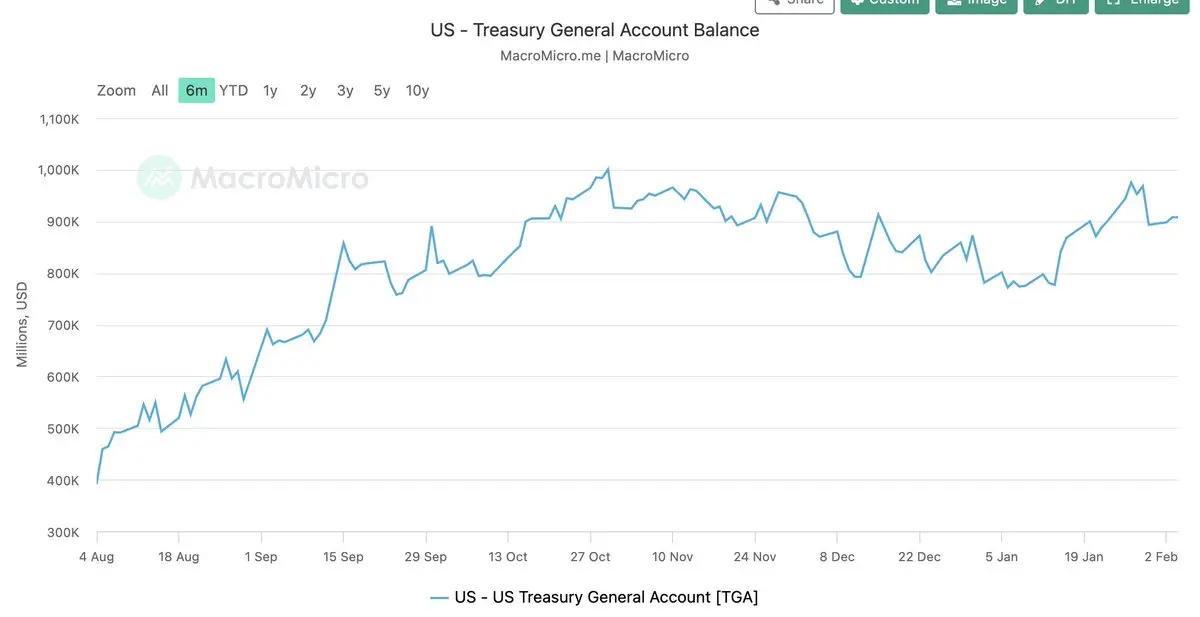
The U.S. Treasury General Account (TGA) is a key variable affecting market liquidity. When the Treasury increases TGA balances through debt issuance or tax receipts, it effectively withdraws funds from the financial system, reducing bank reserves and tightening liquidity. Conversely, when the Treasury spends (reducing TGA), it injects liquidity into the market.
In early February 2026, the market faces dual pressures: rebuilding the TGA and large-scale bond issuance:
• High TGA balance: As of early February, TGA stood at about $893.2 billion. The Treasury plans to keep it around $850 billion by the end of March and reach a peak of about $1.025 trillion by the end of April during tax season. This means continuous withdrawal of funds from the market.
• Large bond issuance: To replenish the TGA and finance the deficit, the Treasury announced significant quarterly refinancing plans in early February, further tightening liquidity.
This “draining the pond” operation directly reduces bank reserves, forcing financial institutions to tighten credit and sell assets for liquidity, triggering a chain reaction in the markets.
3. CME raising margin requirements: a historic “deleveraging”
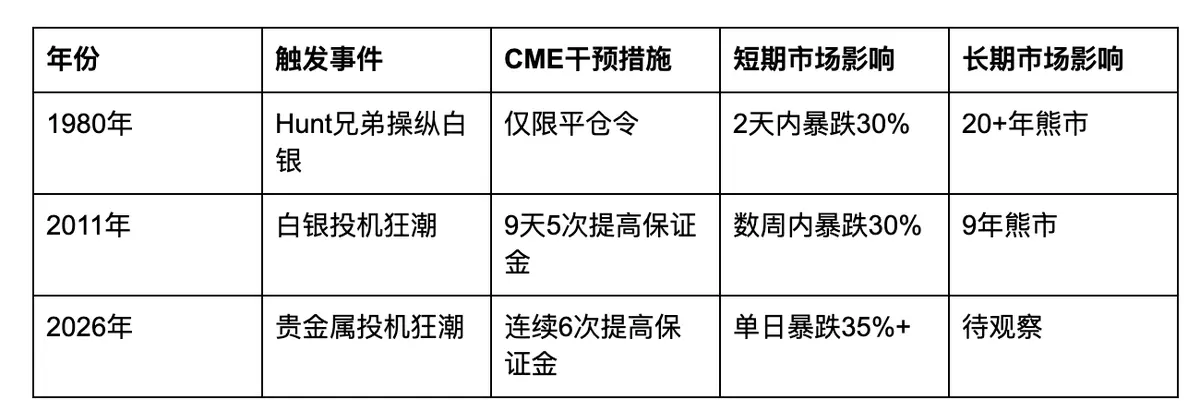
During extreme volatility in precious metals markets, the Chicago Mercantile Exchange (CME) has repeatedly raised margin requirements for futures contracts to force deleveraging, often ending bull markets.
The early February 2026 metal crash is highly correlated with CME’s continuous interventions. After silver hit a record high, CME raised margin requirements six times for gold and silver futures, with initial margin for silver increasing from 11% to 18%. For already battered longs, this was like “adding insult to injury,” triggering a stampede of forced liquidations.
Here are some notable past margin hikes and their subsequent impacts:
Liquidity issues require close attention to liquidity indicators.
Besides analyzing U.S. stock fundamentals and macro Fed statements, I believe these liquidity metrics are crucial:
- Settlement layer funds (water level)
Net liquidity = Fed total assets – TGA – ON RRP
- This indicates “available cash” in the market. A decline in net liquidity generally signals tightening financial conditions.
- Short-term funding costs (are money markets expensive?)
SOFR (Secured Overnight Financing Rate)
- An abnormal rise in SOFR indicates short-term funding is becoming more expensive, increasing market volatility.
- Interest rate volatility (can market makers and leverage withstand?)
MOVE (U.S. Treasury volatility index)
- An increase in MOVE means greater interest rate swings, leading to deleveraging, balance sheet reduction, and passive declines in risk assets.
- Global deleveraging chain (one of the most common “sudden tightening” causes)
-
USDJPY (whether the yen is rapidly appreciating)
-
US 2Y – JP 2Y spread (whether carry trade bottom is narrowing)
-
Yen appreciation combined with narrowing spreads resembles the start of carry trade deleveraging.
- Credit confirmation (has tension propagated to financing?)
HY OAS (High Yield Option-Adjusted Spread)
- Widening HY OAS indicates deteriorating financing conditions, making risk asset declines more contagious.
Later, I will analyze how AI vibe coding can be used to monitor and alert macro liquidity conditions.
Related reading: How I used $500 AI to achieve a $150K annual salary job: Personal Business Agent Upgrade Guide