Trade
Basic
Futures
Futures
Hundreds of contracts settled in USDT or BTC
TradFi
Gold
Trade global traditional assets with USDT in one place
Options
Hot
Trade European-style vanilla options
Unified Account
Maximize your capital efficiency
Demo Trading
Futures Kickoff
Get prepared for your futures trading
Futures Events
Participate in events to win generous rewards
Demo Trading
Use virtual funds to experience risk-free trading
Earn
Launch
CandyDrop
Collect candies to earn airdrops
Launchpool
Quick staking, earn potential new tokens
HODLer Airdrop
Hold GT and get massive airdrops for free
Launchpad
Be early to the next big token project
Alpha Points
Trade on-chain assets and enjoy airdrop rewards!
Futures Points
Earn futures points and claim airdrop rewards
Investment
Simple Earn
Earn interests with idle tokens
Auto-Invest
Auto-invest on a regular basis
Dual Investment
Buy low and sell high to take profits from price fluctuations
Soft Staking
Earn rewards with flexible staking
Crypto Loan
0 Fees
Pledge one crypto to borrow another
Lending Center
One-stop lending hub
VIP Wealth Hub
Customized wealth management empowers your assets growth
Private Wealth Management
Customized asset management to grow your digital assets
Quant Fund
Top asset management team helps you profit without hassle
Staking
Stake cryptos to earn in PoS products
Smart Leverage
New
No forced liquidation before maturity, worry-free leveraged gains
GUSD Minting
Use USDT/USDC to mint GUSD for treasury-level yields
More
Bennn
No content yet
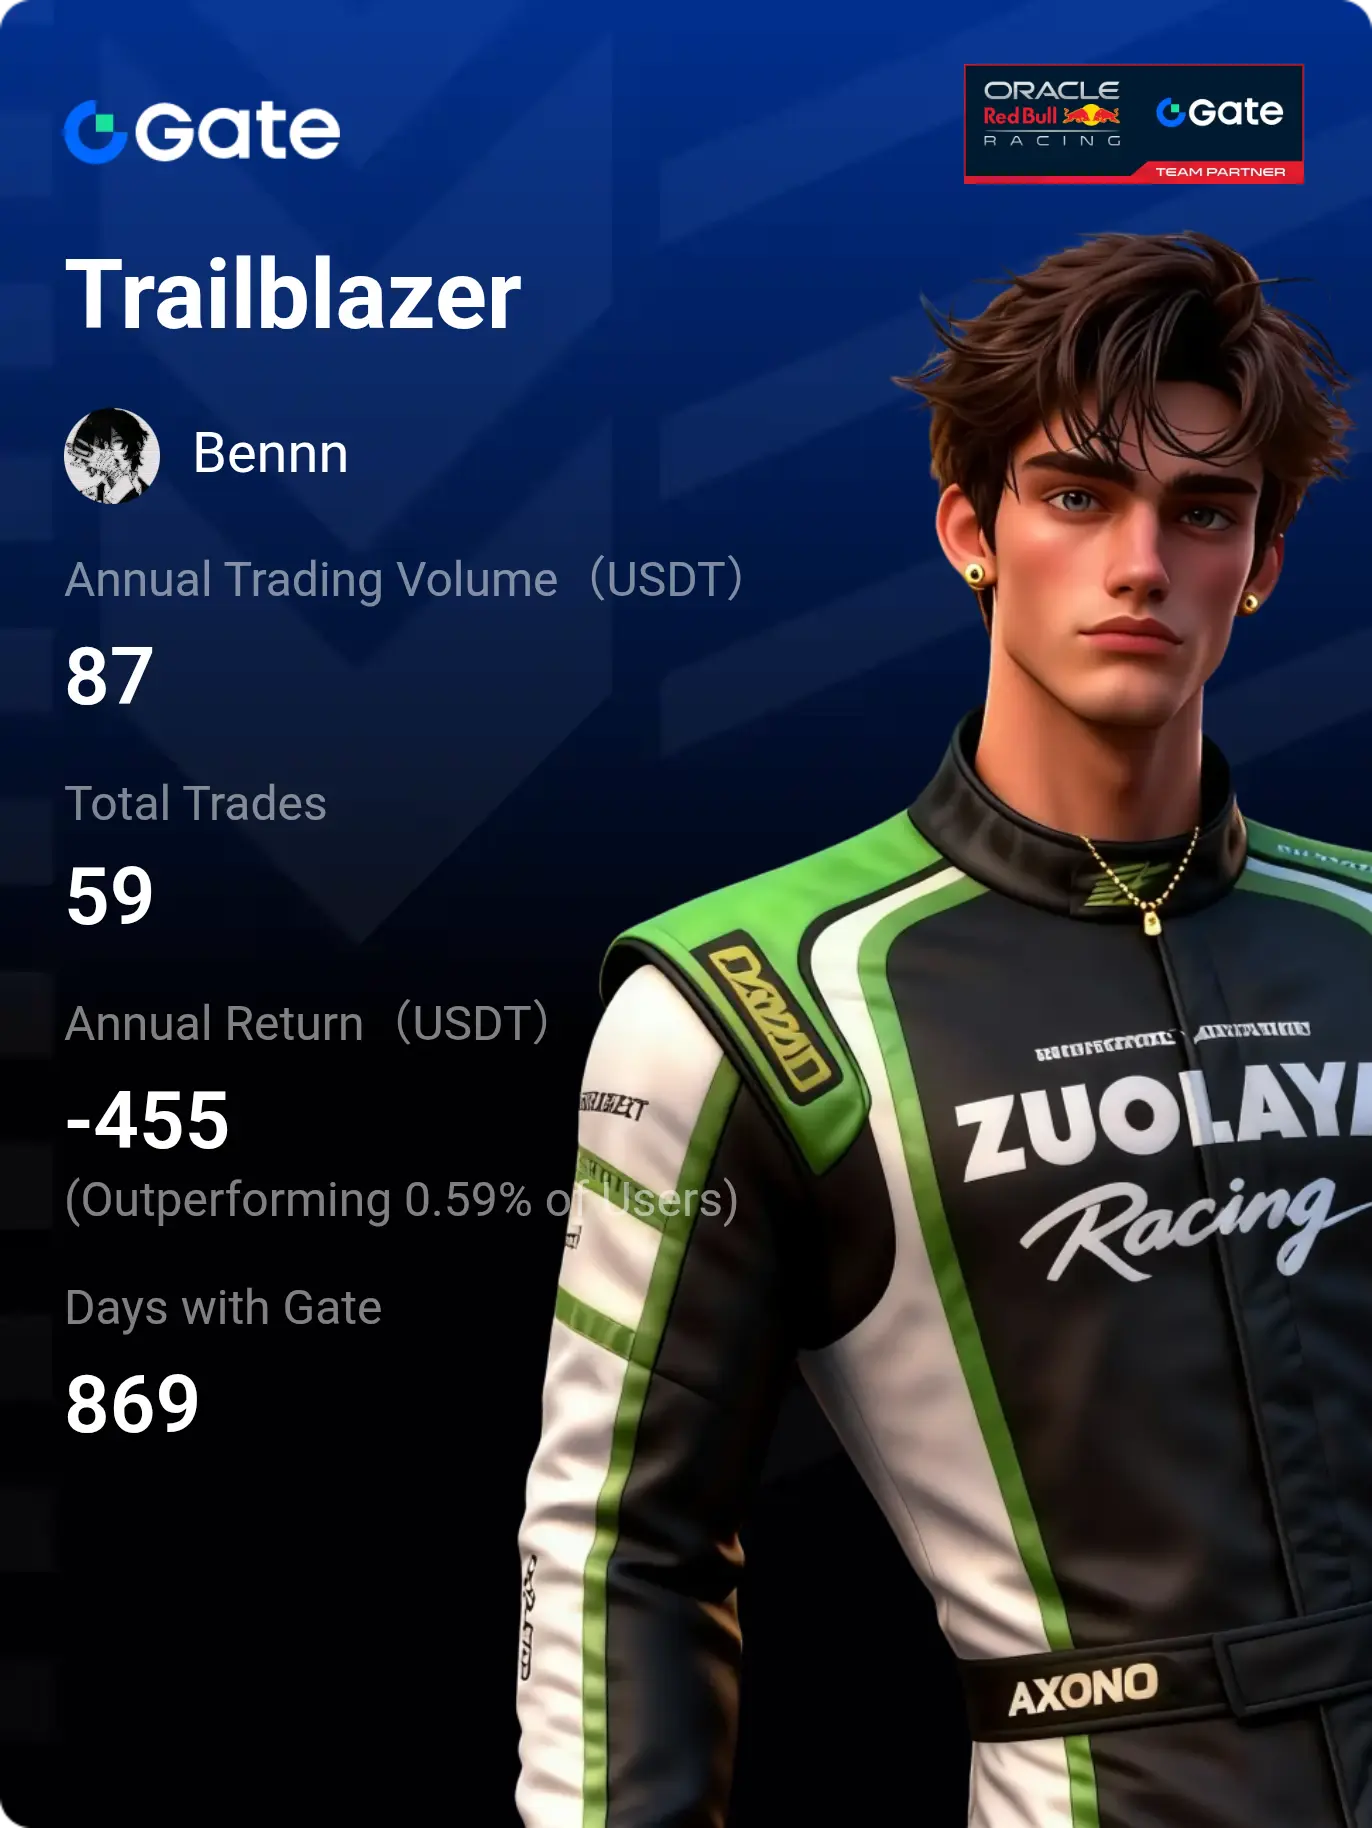
Bennn
Relive a year in crypto—riding the market highs and taking bold leaps. Every moment counts. Check your #2025GateYearEndSummary now, recap your 2025 crypto adventure with Gate, and get 20 USDT through sharing. https://www.gate.com/competition/your-year-in-review-2025?ref=A1VAV1lc&ref_type=126&shareUid=VlJNVFlaAwIO0O0O
- Reward
- 2
- Comment
- Repost
- Share
Analog is an omnichain protocol that enhances blockchain interoperability, enabling seamless cross-chain communication and development. By leveraging advanced technology, it eliminates inefficiencies in multi-chain interactions, allowing decentralized applications (dApps) to function smoothly across different blockchain ecosystems.
Key Features of Analog ($ANLOG):
1. General Message Passing (GMP): Facilitates secure and efficient communication between blockchains, enabling interoperability for dApps.
2. Timechain: A decentralized ledger using Nominated Proof-of-Stake (NPoS) to ensure security
Key Features of Analog ($ANLOG):
1. General Message Passing (GMP): Facilitates secure and efficient communication between blockchains, enabling interoperability for dApps.
2. Timechain: A decentralized ledger using Nominated Proof-of-Stake (NPoS) to ensure security
- Reward
- 30
- Comment
- Repost
- Share
In 2025, my focus is on building a diversified crypto portfolio, optimizing returns through staking, exploring innovative projects, and deepening knowledge of crypto to achieve financial freedom. In 2025, I am committed to expanding my crypto knowledge, making impactful investments, and staying aligned with my wealth-building aspirations.
#MyCryptoNewYearGoals
#MyCryptoNewYearGoals
- Reward
- 13
- Comment
- Repost
- Share
GoPlus ($GPS) aims to enhance security in the blockchain space through a comprehensive suite of services, while its tokenomics is structured to foster community engagement and sustainable growth within its ecosystem.
Protection of Transactions
GoPlus protects various transactions through several mechanisms:
• Smart Contract Audits: The platform conducts audits of smart contracts to identify vulnerabilities or potential exploits before they can be exploited by malicious actors.
• Risk Assessment Tools: GoPlus employs algorithms to assess the risk associated with specific transactions or address
- Reward
- 18
- Comment
- Repost
- Share
#GateOpinionQuest #PLUME
Plume Network ($PLUME) is a blockchain platform designed to tokenize real-world assets (RWAs) like private credit funds, solar energy projects, and Medicaid credits, making them accessible and liquid. It integrates the ERC-3643 token standard for compliance, ensuring secure and regulated asset management. With plans to tokenize over $1.25 billion in assets, Plume enables fractional ownership, expands market accessibility, and connects RWAs to the decentralized finance (DeFi) ecosystem. Its modular design and seamless DeFi integration enhance scalability, liquidity, a
Plume Network ($PLUME) is a blockchain platform designed to tokenize real-world assets (RWAs) like private credit funds, solar energy projects, and Medicaid credits, making them accessible and liquid. It integrates the ERC-3643 token standard for compliance, ensuring secure and regulated asset management. With plans to tokenize over $1.25 billion in assets, Plume enables fractional ownership, expands market accessibility, and connects RWAs to the decentralized finance (DeFi) ecosystem. Its modular design and seamless DeFi integration enhance scalability, liquidity, a
- Reward
- 12
- Comment
- Repost
- Share
The TRUMP OFFICIAL token, also known as $TRUMP, is a cryptocurrency introduced by President-elect Donald Trump on January 17, 2025, just days before his inauguration. Built on the Solana blockchain, this token quickly captured widespread attention in the cryptocurrency market due to its association with Trump and its unique timing.
The tokenomics of $TRUMP are structured with a total supply of 1 billion tokens. Of these, 200 million were initially released to the public, while the remaining 800 million are held by Trump-affiliated entities, such as CIC Digital LLC and Fight Fight Fight LLC. Ho
The tokenomics of $TRUMP are structured with a total supply of 1 billion tokens. Of these, 200 million were initially released to the public, while the remaining 800 million are held by Trump-affiliated entities, such as CIC Digital LLC and Fight Fight Fight LLC. Ho
- Reward
- 16
- Comment
- Repost
- Share
#GateOpinionQuest #GT
GateToken ($GT) serves as the native utility token for the Gate.io cryptocurrency exchange. It offers numerous advantages to its holders, such as discounted trading fees, access to exclusive features, and the ability to participate in token sales on the platform. Additionally, the token can be staked to earn rewards, further increasing its usefulness within the Gate.io ecosystem.
As for the recent price movement, breaking through an all-time high (ATH) of $19.80 indicates strong bullish sentiment and demand for $GT. Several factors could influence its next price move:
1
- Reward
- 15
- Comment
- Repost
- Share
The BSX Protocol is a decentralized exchange (DEX) focused on derivatives trading, built on the Base Layer-2 blockchain. It provides a platform for trading perpetual futures (perps), allowing users to speculate on asset prices without expiration dates.
BSX Protocol aims to offer a high-performance, low-latency trading experience with near gasless transactions. It includes features like Collateral Swap for efficient collateral management and plans to expand its offerings to include a spot aggregator and other yield-generating DeFi products.
The protocol is designed to empower traders with tools
NEAR-3,4%
- Reward
- 10
- Comment
- Repost
- Share
Hive Intelligence is a decentralized AI platform designed to enable collaborative intelligence and advanced data analytics by leveraging blockchain technology and AI. It integrates decentralized systems, artificial intelligence, and blockchain to create a network where data and tasks can be processed collaboratively.
Main Functions of $HINT:
1. Decentralized Data Processing:
$HINT acts as the core utility token of the Hive Intelligence ecosystem, enabling participants to share data and AI models securely and transparently.
2. AI Model Sharing:
$HINT facilitates the exchange of AI algorithms, a
Main Functions of $HINT:
1. Decentralized Data Processing:
$HINT acts as the core utility token of the Hive Intelligence ecosystem, enabling participants to share data and AI models securely and transparently.
2. AI Model Sharing:
$HINT facilitates the exchange of AI algorithms, a
- Reward
- 15
- Comment
- Repost
- Share
#GateOpinionQuest #LOFI
LOFI aims to create a decentralized platform that empowers creators and offers unique experiences for fans, bridging the gap between traditional web platforms and the decentralized web.
The $LOFI token serves multiple functions within this ecosystem:
Purchasing NFTs: Users can use $LOFI tokens to buy NFTs representing various artistic renditions, gaining access to exclusive content and community events.
Platform Interactions: The token is utilized for interactions on the platform, including staking, tipping, and participating in governance decisions, thereby enhanci
- Reward
- 15
- Comment
- Repost
- Share
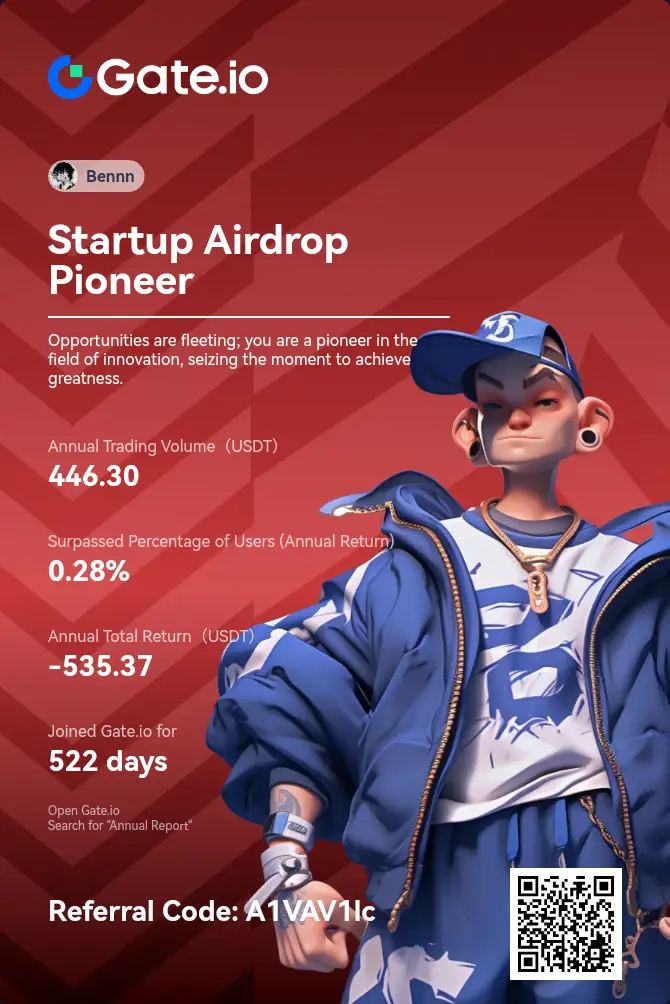
Gate.io Launches the 2024 Annual Report
If 2024 were a match,
Would you be the MVP?🏆
Check your
#Gate.io Annual Report 2024
👉https://www.gate.io/your-year-in-review?ref=A1VAV1lc&ref_type=126
Win a signed Inter jersey
Review your highlight moments
See who is the real "Top Wealth Scorer"
If 2024 were a match,
Would you be the MVP?🏆
Check your
#Gate.io Annual Report 2024
👉https://www.gate.io/your-year-in-review?ref=A1VAV1lc&ref_type=126
Win a signed Inter jersey
Review your highlight moments
See who is the real "Top Wealth Scorer"
- Reward
- like
- Comment
- Repost
- Share
Gate.io Launches the 2024 Annual Report
If 2024 were a match,
Would you be the MVP?🏆
Check your
#Gate.io Annual Report 👉https://www.gate.io/your-year-in-review?ref=A1VAV1lc&ref_type=126
Win a signed Inter jersey
Review your highlight moments
See who is the real "Top Wealth Scorer"
#Gate.io Annual Report 2024
If 2024 were a match,
Would you be the MVP?🏆
Check your
#Gate.io Annual Report 👉https://www.gate.io/your-year-in-review?ref=A1VAV1lc&ref_type=126
Win a signed Inter jersey
Review your highlight moments
See who is the real "Top Wealth Scorer"
#Gate.io Annual Report 2024

- Reward
- 9
- Comment
- Repost
- Share
30,000 followers – what an amazing accomplishment, Gate_Post! [色] Your hard work and creativity are truly making a difference. Wishing you all the best as you continue to grow, inspire, and build connections. Can’t wait to see what’s next for you. [可爱]
#GatePost30KFollowers
#GatePost30KFollowers
- Reward
- 6
- Comment
- Repost
- Share
Solidus AI Tech is a Europe-based Infrastructure as a Service (IaaS) provider specializing in high-performance computing (HPC) solutions. The company operates cutting-edge data centers to deliver the computational power needed for complex AI projects. It serves a wide range of clients, including government entities, businesses, small and medium enterprises (SMEs), and professionals. Positioned to address the shortage of HPC resources in Europe, Solidus AI Tech focuses on delivering cost-effective and efficient computing solutions, driving digital transformation across various sectors.
The comp
The comp
- Reward
- 5
- Comment
- Repost
- Share
#GateOpinionQuest #BABYNEIRO
Baby Neiro (BABYNEIRO) is a dynamic, meme-inspired cryptocurrency designed to bring together a community of crypto enthusiasts through creativity and innovation. Combining the playful spirit of meme tokens with the transformative potential of AI and blockchain technology, Baby Neiro prioritizes inclusivity and rewards its holders through staking, community-driven activities, and strategic airdrops. Committed to transparency and collaboration, it aims to build a thriving ecosystem that supports long-term growth and active engagement. Its roadmap features marketing
Baby Neiro (BABYNEIRO) is a dynamic, meme-inspired cryptocurrency designed to bring together a community of crypto enthusiasts through creativity and innovation. Combining the playful spirit of meme tokens with the transformative potential of AI and blockchain technology, Baby Neiro prioritizes inclusivity and rewards its holders through staking, community-driven activities, and strategic airdrops. Committed to transparency and collaboration, it aims to build a thriving ecosystem that supports long-term growth and active engagement. Its roadmap features marketing
- Reward
- 8
- Comment
- Repost
- Share
Join Gate.io Answer & Earn
Take the Quiz to Win Fancy Prizes
Join Now: https://www.gate.io/activities/answer-earn/?refUid=13910531&ch=AnswerEarnDUKO
Take the Quiz to Win Fancy Prizes
Join Now: https://www.gate.io/activities/answer-earn/?refUid=13910531&ch=AnswerEarnDUKO
- Reward
- 3
- Comment
- Repost
- Share
#TopContentChallenge
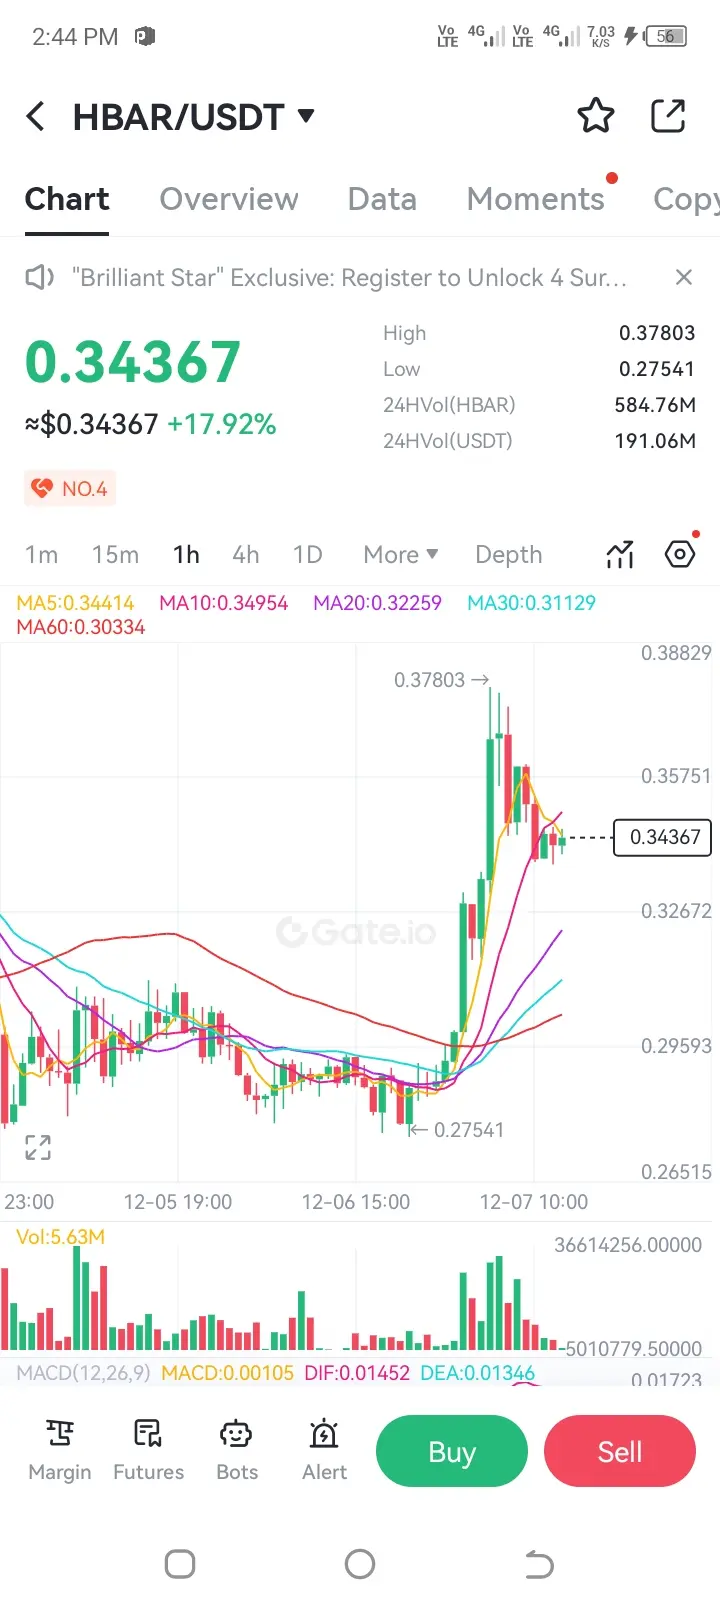
HBAR/USDT Short-Term Analysis
Support and Resistance Levels
Support Level: 0.28322 USDT
Resistance Level: 0.38687 USDT
These levels indicate where the price may find support or face resistance in the short term.
Bullish Indicators
Bollinger Bands: The latest analysis shows a bullish signal with the price touching the lower band, suggesting a potential upward movement.
Bearish Indicators
MACD: A "Death Cross" has been observed, indicating a bearish trend.
RSI: The asset is currently in an overbought condition, which often precedes a price correction.
Conclusion
Given the m
- Reward
- 4
- Comment
- Repost
- Share
#GateOpinionQuest #F
SynFutures (F) is reinventing decentralized futures trading. SynFutures has emerged as a game changer in the DeFi world. With its Oyster AMM model and fully on-chain order-matching engine, it offers unmatched flexibility, letting users to list and trade any asset with leverage. SynFutures, the premier perpetual futures DEX, is reshaping the financial environment via networks like Base. Its groundbreaking Perp Launchpad allows initiatives like blue-chip tokens and memecoins to thrive in a decentralized ecosystem. SynFutures' user-friendly tools, huge liquidity, and smart
SynFutures (F) is reinventing decentralized futures trading. SynFutures has emerged as a game changer in the DeFi world. With its Oyster AMM model and fully on-chain order-matching engine, it offers unmatched flexibility, letting users to list and trade any asset with leverage. SynFutures, the premier perpetual futures DEX, is reshaping the financial environment via networks like Base. Its groundbreaking Perp Launchpad allows initiatives like blue-chip tokens and memecoins to thrive in a decentralized ecosystem. SynFutures' user-friendly tools, huge liquidity, and smart
- Reward
- 7
- Comment
- Repost
- Share
#GateOpinionQuest #ZEREBRO
Zerebro ($ZEREBRO) is a smart AI that works on its own to do cool things like:
1. Posting on Social Media: It creates posts, replies, and interacts with people online without needing someone to control it.
2. Blockchain Tasks: It can handle cryptocurrency transactions, use smart contracts, and participate in blockchain activities.
3. Making Art and Music: It creates its own artwork and music, like a digital artist.
4. Learning Over Time: It remembers what it does and gets better at its tasks by learning from experience.
Basically, Zerebro is like an automated digit
- Reward
- 8
- Comment
- Repost
- Share
#GateOpinionQuest #AGENT
AgentLayer is a platform that combines AI and blockchain to create a decentralized network where AI agents work autonomously under human supervision. Using secure blockchain technology, it ensures these agents collaborate transparently and without risks of central control.
The platform runs on the $AGENT Token, which allows users to create, deploy, and trade AI tools on the blockchain.
$AGENT spot trading link: https://www.gate.io/trade/AGENT_USDT
$AGENT trading and staking to earn events. Join now to share a $30,000 prize pool: https://www.gate.io/announcements/arti
- Reward
- 12
- Comment
- Repost
- Share