This comprehensive article analyzes Alchemy Pay (ACH), a hybrid payment infrastructure bridging fiat and cryptocurrency economies, currently trading at $0.012539 with a market cap of $61.99 million. The guide examines ACH's historical price evolution, market sentiment, and holding distribution patterns across multiple exchange platforms including Gate. Key price predictions span 2026-2031, with 2026 forecasts ranging from $0.00922 to $0.01301, escalating to potential $0.02529 by 2031 under optimal conditions. The article presents three investment strategies: long-term holding for infrastructure believers, active trading leveraging technical analysis, and dollar-cost averaging to mitigate volatility risks. Essential risk management covers asset allocation frameworks, portfolio diversification, and secure storage solutions via Gate Web3 Wallet. Critical risks include price volatility, regulatory compliance challenges across 70+ countries, and smart contract vulnerabilities, making this suitable for experienced
Introduction: ACH's Market Position and Investment Value
Alchemy Pay (ACH), as a hybrid payment infrastructure bridging fiat and cryptocurrency economies, has established meaningful presence since its founding in 2018. As of 2026, ACH maintains a market capitalization of approximately $61.99 million, with a circulating supply of around 4.94 billion tokens and a current price hovering near $0.01254. This asset, recognized for its payment solution capabilities, is playing an increasingly important role in facilitating cryptocurrency-to-fiat transactions for merchants and consumers globally.
This article will comprehensively analyze ACH's price trends from 2026 to 2031, combining historical patterns, market supply-demand dynamics, ecosystem development, and macroeconomic conditions to provide investors with professional price forecasts and practical investment strategies.
I. ACH Price History Review and Market Status
ACH Historical Price Evolution Trajectory
- 2021: Token launched and reached historical peak during market euphoria, with price climbing to notable levels in early August
- 2021: Experienced significant volatility following initial launch period, with price fluctuating between extreme ranges
- 2022-2025: Underwent extended market adjustment phase alongside broader cryptocurrency market cycles
ACH Current Market Situation
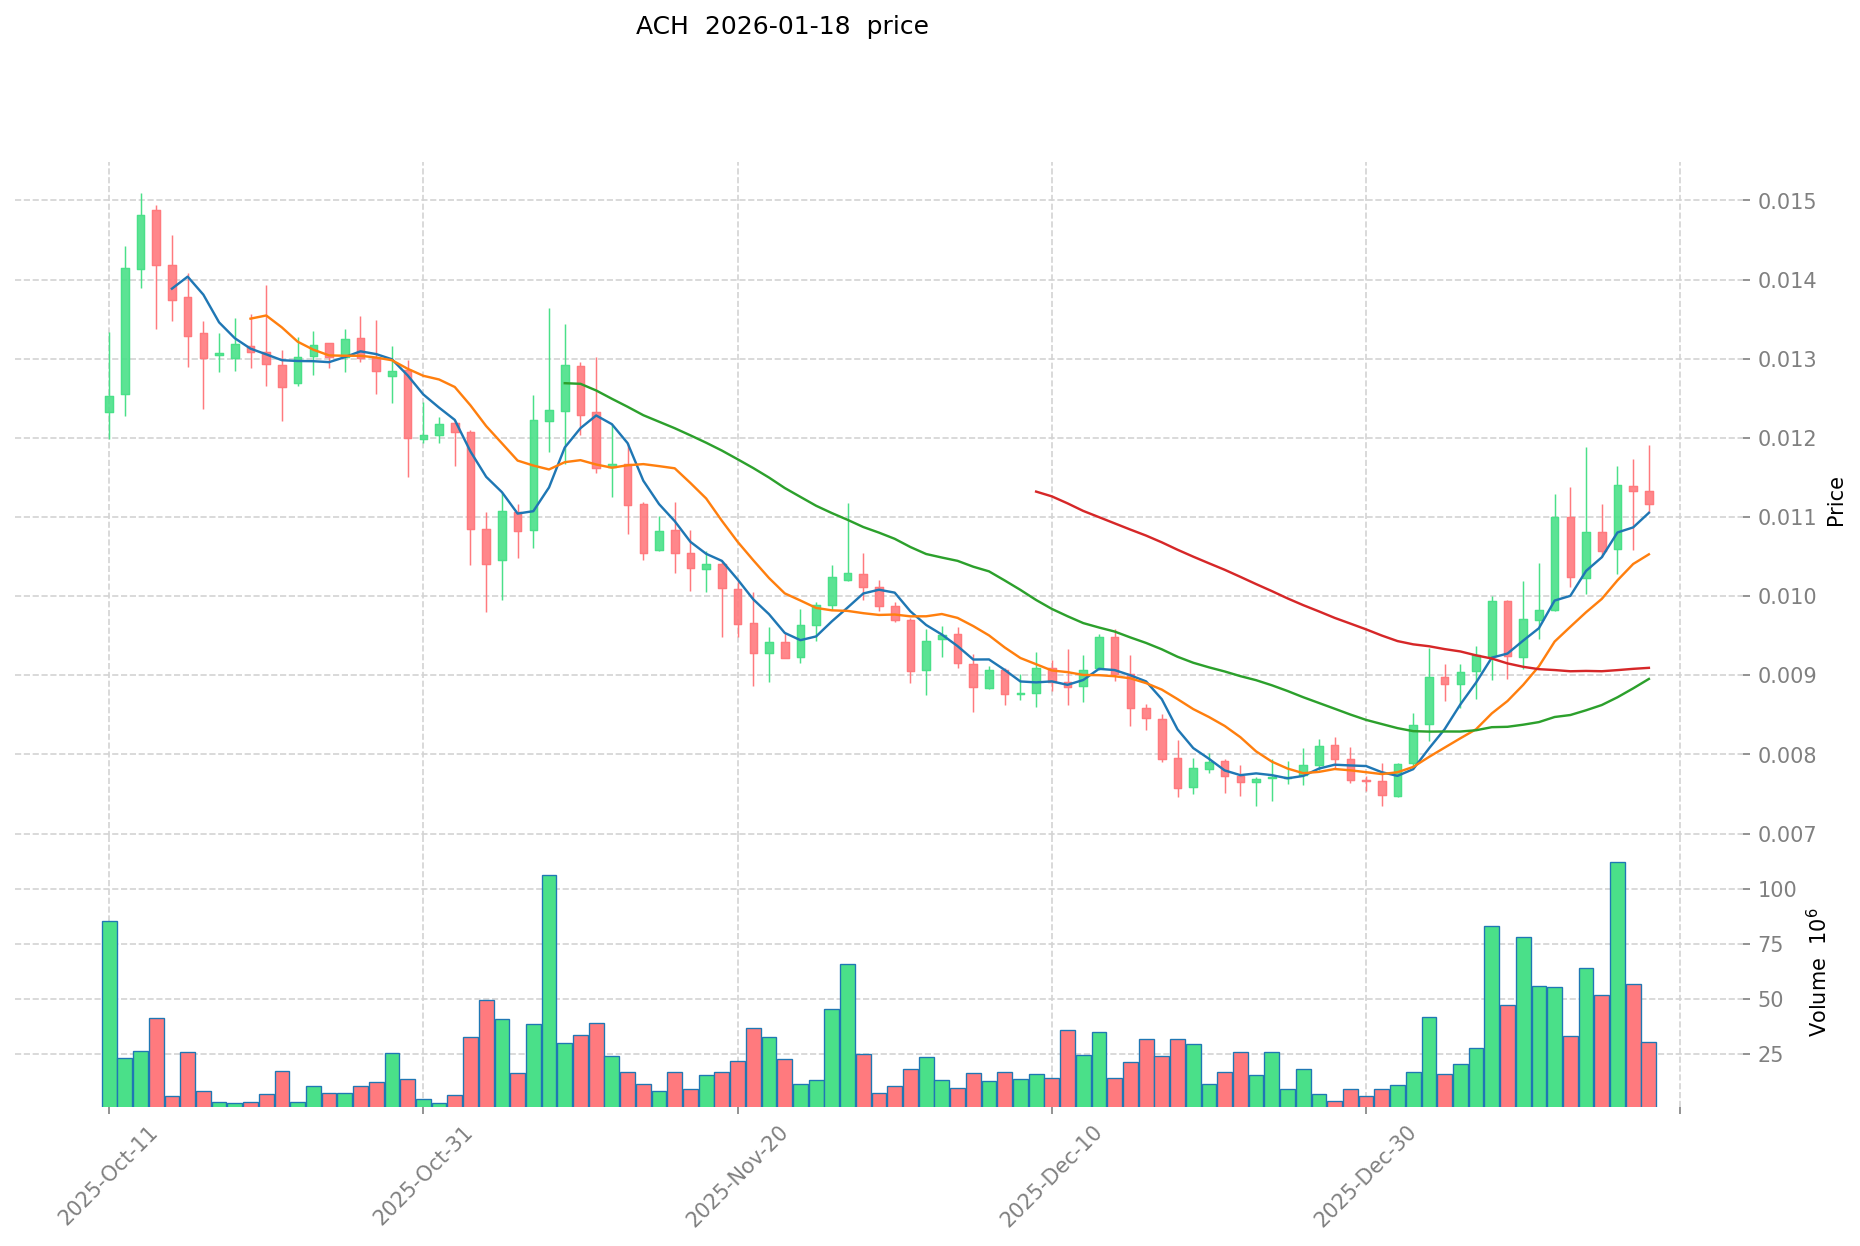
As of January 19, 2026, ACH is trading at $0.012539, representing a market capitalization of approximately $61.99 million. The token ranks 473rd by market capitalization and holds a 0.0037% share of the total cryptocurrency market.
Recent price performance shows mixed momentum across different timeframes. Over the past hour, ACH recorded a modest gain of 0.96%. The 24-hour period demonstrates stronger upward movement with a 9.78% increase, while the weekly performance shows a 12.95% advance. The most significant movement appears in the 30-day timeframe, with ACH posting a 64.61% gain.
The token's 24-hour trading volume stands at $923,908, with price fluctuating between a low of $0.01102 and a high of $0.012718 during this period. The current circulating supply represents 49.44% of the total supply, with 4.94 billion ACH tokens in circulation out of a maximum supply of 10 billion tokens.
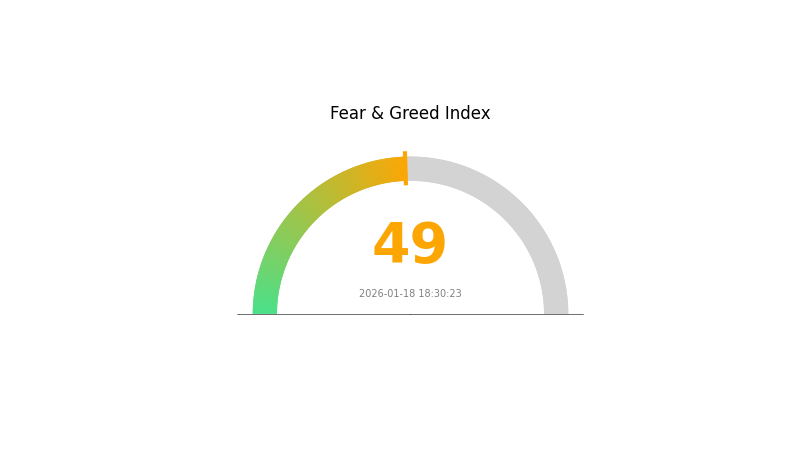
ACH's fully diluted market capitalization is calculated at approximately $125.39 million. The token is listed on 33 exchanges and has attracted a holder base of 37,396 addresses. The Gate.com crypto fear and greed index currently reads 49, indicating a neutral market sentiment.
Click to view current ACH market price
ACH Market Sentiment Indicator
2026-01-18 Fear and Greed Index: 49 (Neutral)
Click to view the current Fear & Greed Index
The ACH market currently displays a neutral sentiment with a Fear and Greed Index reading of 49. This balanced position suggests that market participants are neither overwhelmingly fearful nor excessively greedy. Investors should maintain a measured approach, as moderate sentiment typically indicates a transitional phase in market dynamics. Both bullish and bearish scenarios remain plausible, making risk management and diversification essential strategies during this neutral period. Monitor key support and resistance levels closely for potential trend confirmation.
ACH Holding Distribution
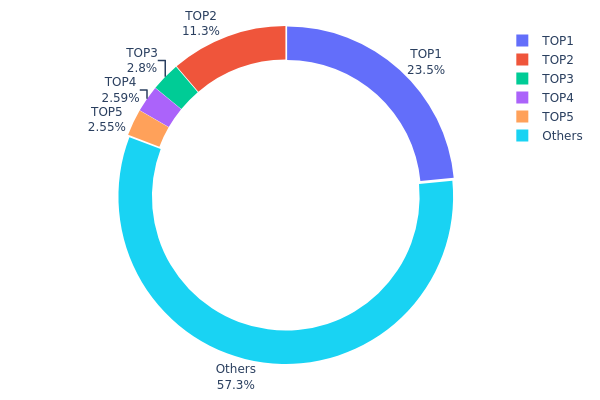
The address holding distribution chart reflects the proportion of total ACH tokens held by different wallet addresses, serving as a key indicator for assessing token concentration and decentralization within the blockchain network. By analyzing the distribution patterns across major holders and remaining addresses, we can evaluate the market's structural health and potential centralization risks.
According to current on-chain data, ACH exhibits a moderately concentrated holding pattern. The top holder (0xf977...41acec) controls 23.48% of the total supply, while the second-largest address (0x7196...97c3fe) holds 11.26%. The top five addresses collectively account for 42.67% of total circulation, with the remaining 57.33% distributed among other addresses. This concentration level indicates that while no single entity dominates the market, a relatively small group of large holders maintains significant influence over the token's supply dynamics.
This holding structure presents both opportunities and risks for market participants. On one hand, the fact that over half of the supply remains dispersed suggests a reasonable degree of decentralization, which helps mitigate the risk of coordinated market manipulation. On the other hand, the substantial holdings by top addresses create potential volatility concerns, as large-scale movements from these wallets could trigger significant price fluctuations. Investors should monitor these major addresses for any unusual activity, as their trading decisions can materially impact market liquidity and price discovery mechanisms.
Click to view current ACH Holding Distribution
| Top |
Address |
Holding Qty |
Holding (%) |
| 1 |
0xf977...41acec |
2348495.40K |
23.48% |
| 2 |
0x7196...97c3fe |
1126652.68K |
11.26% |
| 3 |
0x0529...c553b7 |
280101.19K |
2.80% |
| 4 |
0x2111...d47d8a |
258966.39K |
2.58% |
| 5 |
0x8132...3c0b64 |
255467.90K |
2.55% |
| - |
Others |
5730316.45K |
57.33% |
II. Core Factors Influencing ACH's Future Price
Supply Mechanism
The specific supply mechanism details for ACH are not covered in the available materials. However, understanding token supply dynamics remains important for evaluating potential price movements in cryptocurrency markets.
Institutional and Major Holder Dynamics
Current information regarding institutional holdings, corporate adoption, or government-level policies specifically related to ACH is not available in the provided materials. These factors can play significant roles in cryptocurrency valuation when they occur.
Macroeconomic Environment
- Monetary Policy Impact: Interest rate changes and monetary policy decisions by central banks represent key influences on cryptocurrency markets. Shifts in interest rates can affect liquidity cycles and investor appetite for digital assets.
- Inflation Hedge Attributes: Broader macroeconomic conditions, including inflation trends, may influence how investors view cryptocurrencies as alternative assets during different economic cycles.
- Geopolitical Factors: Global economic trends and international developments can create market uncertainty that impacts cryptocurrency trading patterns and investor sentiment.
Technology Development and Ecosystem Building
- Market Sentiment: Overall market sentiment remains a fundamental driver of ACH price movements, reflecting collective investor attitudes and trading behavior.
- Trading Volume: Trading volume levels serve as indicators of market activity and liquidity, potentially signaling shifts in investor interest and price momentum.
- Technological Advancements: Continued technology development and innovation cycles within the cryptocurrency sector may influence user adoption trends and market positioning.
- User Adoption Trends: The pace and pattern of user adoption represent important metrics for evaluating long-term growth potential and ecosystem development.
III. 2026-2031 ACH Price Prediction
2026 Outlook
- Conservative prediction: $0.00922 - $0.01263
- Neutral prediction: around $0.01263
- Optimistic prediction: up to $0.01301 (requires favorable market conditions)
2027-2029 Outlook
- Market stage expectation: ACH may experience gradual growth with potential volatility, as the cryptocurrency market continues to mature and regulatory frameworks become clearer
- Price range prediction:
- 2027: $0.00756 - $0.01333
- 2028: $0.01151 - $0.01752
- 2029: $0.01254 - $0.01683
- Key catalysts: broader adoption of payment solutions, enhanced ecosystem partnerships, and potential technological upgrades could serve as primary drivers for price appreciation
2030-2031 Long-term Outlook
- Baseline scenario: $0.01189 - $0.01606 (assuming steady market development and moderate adoption growth)
- Optimistic scenario: $0.01897 - $0.02345 (assuming accelerated merchant adoption and favorable regulatory environment)
- Transformational scenario: up to $0.02529 (requires breakthrough partnerships, significant ecosystem expansion, and widespread mainstream adoption)
- 2026-01-19: ACH is positioned in an early growth phase with potential for gradual appreciation over the forecast period
| Year |
Predicted High Price |
Predicted Average Price |
Predicted Low Price |
Price Change |
| 2026 |
0.01301 |
0.01263 |
0.00922 |
0 |
| 2027 |
0.01333 |
0.01282 |
0.00756 |
2 |
| 2028 |
0.01752 |
0.01308 |
0.01151 |
4 |
| 2029 |
0.01683 |
0.0153 |
0.01254 |
22 |
| 2030 |
0.02345 |
0.01606 |
0.01189 |
28 |
| 2031 |
0.02529 |
0.01976 |
0.01897 |
57 |
IV. ACH Professional Investment Strategies and Risk Management
ACH Investment Methodology
(I) Long-term Holding Strategy
- Suitable for: Investors seeking exposure to blockchain payment infrastructure with a medium to long-term horizon
- Operational Recommendations:
- Consider accumulating positions during market corrections when ACH trades below its historical average
- Monitor partnership announcements and merchant adoption metrics as potential entry signals
- Utilize secure storage solutions such as Gate Web3 Wallet for long-term holdings, ensuring private key security through multi-signature or hardware wallet integration
(II) Active Trading Strategy
- Technical Analysis Tools:
- Moving Averages: Utilize 50-day and 200-day moving averages to identify trend direction and potential crossover signals
- Volume Analysis: Monitor trading volume spikes (current 24h volume: $923,908) relative to historical averages to confirm breakout or breakdown patterns
- Swing Trading Considerations:
- ACH has demonstrated significant volatility with a 30-day price change of approximately 64.61%, presenting opportunities for swing traders
- Establish clear entry and exit points based on support levels near recent lows and resistance near recent highs
ACH Risk Management Framework
(I) Asset Allocation Principles
- Conservative Investors: 1-3% of crypto portfolio allocation
- Moderate Investors: 3-5% of crypto portfolio allocation
- Aggressive Investors: 5-10% of crypto portfolio allocation
(II) Risk Hedging Solutions
- Portfolio Diversification: Balance ACH holdings with established cryptocurrencies and stablecoins to reduce concentration risk
- Stop-Loss Implementation: Set stop-loss orders at 10-15% below entry price to limit downside exposure
(III) Secure Storage Solutions
- Software Wallet Recommendation: Gate Web3 Wallet offers convenient access with enhanced security features for active traders
- Hardware Wallet Solution: For long-term holdings exceeding significant value thresholds, consider cold storage options with offline private key management
- Security Precautions: Never share private keys or seed phrases; enable two-factor authentication on all exchange accounts; verify contract addresses (ETH: 0xed04915c23f00a313a544955524eb7dbd823143d, BSC: 0xBc7d6B50616989655AfD682fb42743507003056D) before transactions
V. ACH Potential Risks and Challenges
ACH Market Risks
- Price Volatility: ACH has experienced substantial price fluctuations, with a 1-year decline of approximately 50.94%, indicating significant volatility that may result in substantial losses
- Liquidity Concerns: With a 24-hour trading volume of approximately $923,908, liquidity may be limited during certain market conditions, potentially impacting execution prices
- Market Capitalization Risk: Current market cap of approximately $61.99 million represents a relatively small-cap asset subject to higher volatility compared to larger cryptocurrencies
ACH Regulatory Risks
- Payment Processing Regulations: As a payment solution provider operating across 70+ countries, Alchemy Pay faces evolving regulatory frameworks governing crypto-to-fiat transactions
- Jurisdictional Compliance: Changes in cryptocurrency regulations in key markets could impact operational capabilities and market access
- KYC/AML Requirements: Increasing global regulatory scrutiny on crypto payment platforms may affect user onboarding and transaction processing
ACH Technical Risks
- Smart Contract Vulnerabilities: As an ERC-20 token deployed on Ethereum and BSC, ACH is subject to potential smart contract bugs or exploits
- Blockchain Dependency: Performance and security rely on underlying blockchain networks (Ethereum, BSC), with network congestion or security incidents potentially affecting token functionality
- Integration Challenges: Technical difficulties in maintaining partnerships or integrating with merchant platforms could impact adoption and utility
VI. Conclusion and Action Recommendations
ACH Investment Value Assessment
Alchemy Pay (ACH) represents a specialized investment opportunity within the blockchain payment infrastructure sector, serving as a bridge between traditional fiat and cryptocurrency economies across 70+ countries. The project's partnerships with notable platforms and access to over 2 million merchants demonstrate operational traction. However, the significant 1-year price decline of approximately 50.94% and relatively small market capitalization indicate substantial volatility and risk. Long-term value proposition depends on continued merchant adoption, regulatory navigation, and successful execution of technical roadmap, while short-term risks include market volatility, liquidity constraints, and regulatory uncertainties.
ACH Investment Recommendations
✅ Beginners: Consider starting with minimal allocation (1-2% of crypto portfolio) after thorough research; prioritize learning about payment token economics before investing
✅ Experienced Investors: May allocate 3-5% of crypto portfolio based on risk tolerance; actively monitor partnership announcements and adoption metrics for position adjustment
✅ Institutional Investors: Conduct comprehensive due diligence on regulatory compliance, partnership sustainability, and competitive positioning before considering meaningful allocation
ACH Trading Participation Methods
- Spot Trading: Purchase ACH directly on Gate.com with support for multiple trading pairs, suitable for both long-term holding and short-term trading strategies
- Dollar-Cost Averaging: Implement systematic purchase plans to mitigate timing risk and reduce impact of price volatility
- Portfolio Rebalancing: Periodically adjust ACH allocation based on performance and overall portfolio objectives to maintain target risk exposure
Cryptocurrency investment carries extremely high risks, and this article does not constitute investment advice. Investors should make prudent decisions based on their own risk tolerance and are advised to consult professional financial advisors. Never invest more than you can afford to lose.
FAQ
What is ACH token and what is its purpose?
ACH is the token issued by Alchemy Pay with a total supply of 10 billion. It serves three main purposes: ecosystem incentives, governance participation, and system consumption fees within the Alchemy Pay network.
What are the main factors influencing ACH price?
ACH price is primarily influenced by market supply and demand, investor sentiment, trading volume, blockchain adoption trends, and overall cryptocurrency market conditions. These factors collectively determine its market performance and price movements.
How to analyze ACH's price trends and technical aspects?
Analyze ACH using technical indicators like moving averages, oscillators, and pivot points via TradingView. Monitor trading volume and market sentiment. Expert predictions for 2026 range from $0.008 to $0.018. Track fundamental developments and overall crypto market conditions for comprehensive analysis.
ACH reached an all-time high of $0.19750365 and an all-time low of $0.00133775. In recent performance, ACH declined 0.17% in the past hour and rose 23.55% over the past 7 days.
What are the risks to consider when investing in ACH?
ACH token investments carry market volatility risks,regulatory uncertainty,and liquidity risks. Consider price fluctuations,project development changes,and market adoption challenges. Conduct thorough research before investing.
What advantages does ACH have compared to other payment tokens?
ACH token offers faster settlement, lower transaction costs, and broader North American payment infrastructure integration. It enables efficient cross-border payments with enhanced security and scalability compared to traditional payment alternatives.
Alchemy Pay项目的未来发展前景如何?
Alchemy Pay has strong development prospects with expanded cryptocurrency payment solutions. The project demonstrates significant potential through its robust ecosystem roadmap and infrastructure enhancements, positioning itself as a leading payment platform in the crypto industry.
* The information is not intended to be and does not constitute financial advice or any other recommendation of any sort offered or endorsed by Gate.