This comprehensive analysis examines AMP's price trajectory from 2026 to 2031, providing professional forecasts for investors in the Flexa payment network's collateral token. As of January 2026, AMP trades at $0.002209 with a market cap of $186.18 million, having recovered 14.099% over 30 days from its historical low. The article evaluates core price drivers including fixed token supply mechanics, institutional adoption trends, macroeconomic conditions, and ecosystem development within the Flexa payment infrastructure. Expert predictions indicate potential growth ranging from $0.00209-$0.0028 (2026) to $0.00377-$0.00522 (2031), representing approximately 87% upside potential. The guide presents differentiated investment strategies for beginners, experienced, and institutional investors, emphasizing risk management through portfolio allocation and secure storage on Gate. Key challenges include 68% year-over-year decline, concentrated holder distribution, and regulatory uncertainty surrounding crypto payment sy
Introduction: AMP's Market Position and Investment Value
Amp (AMP) serves as the native collateral token of the Flexa payment network, facilitating cryptocurrency payment acceptance for merchants since its launch in 2020. As of January 16, 2026, AMP maintains a market capitalization of approximately $186.18 million, with a circulating supply of around 84.28 billion tokens and a trading price near $0.002209. This digital asset, designed to enable real-world cryptocurrency transactions through collateralization mechanisms, continues to play a growing role in bridging digital assets with everyday commerce.
This article comprehensively analyzes AMP's price trajectory from 2026 to 2031, incorporating historical patterns, market dynamics, ecosystem developments, and macroeconomic conditions to provide investors with professional price forecasts and practical investment strategies.
I. AMP Price History Review and Market Status
AMP Historical Price Evolution Trajectory
- 2020: AMP launched on October 29, 2020, with an initial offering price of $0.00167, representing the project's entry into the cryptocurrency payment collateral market.
- 2021: During the cryptocurrency market boom, AMP reached its all-time high of $0.120813 on June 17, 2021, reflecting strong market interest in payment infrastructure tokens.
- 2023: Amid broader market corrections, AMP touched its historical low of $0.00140933 on October 13, 2023, representing a significant retracement from peak levels.
AMP Current Market Dynamics
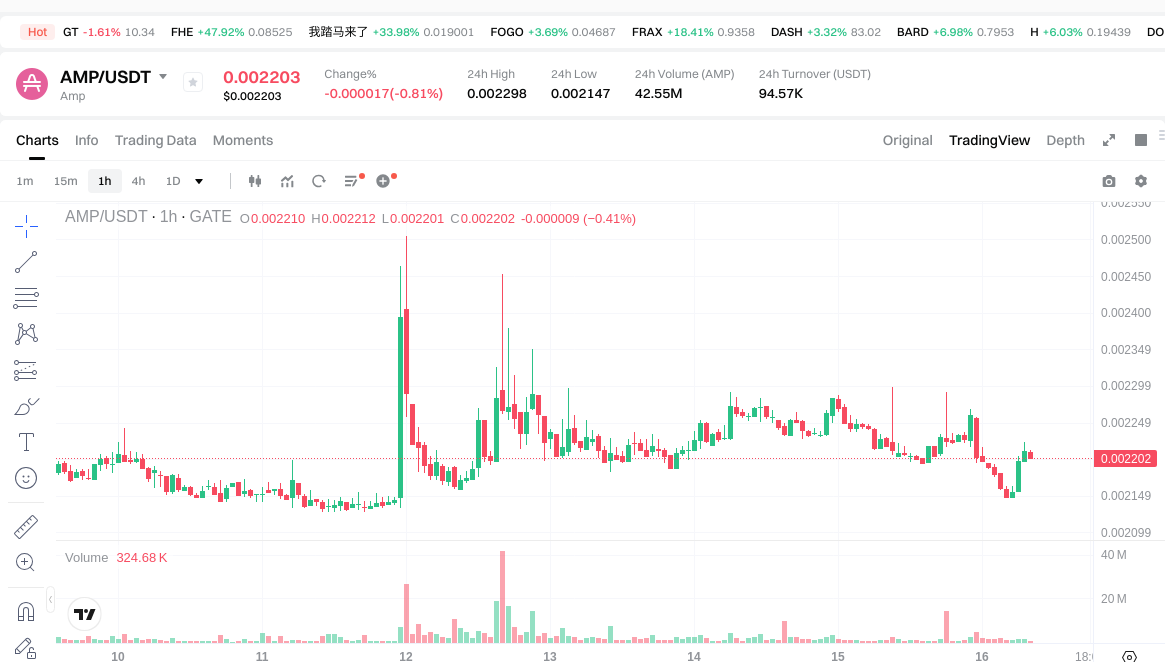
As of January 16, 2026, AMP is trading at $0.002209, showing recent volatility across different timeframes. The token has experienced a decline of 0.36% over the past hour and 0.67% over the past 24 hours, with a 24-hour trading range between $0.002147 and $0.002298. On a weekly basis, AMP has decreased by 1.069%.
However, the 30-day performance presents a contrasting picture, with AMP gaining 14.099%, indicating recent positive momentum. The annual performance shows a decline of 68.35%, reflecting the token's distance from previous higher price levels.
AMP maintains a market capitalization of approximately $186.18 million, ranking 249th in the cryptocurrency market with a 0.0065% market dominance. The token's circulating supply stands at 84.28 billion AMP, representing 84.28% of the maximum supply of 100 billion tokens. The fully diluted market cap is approximately $220.28 million, with a 24-hour trading volume of $94,727.75.
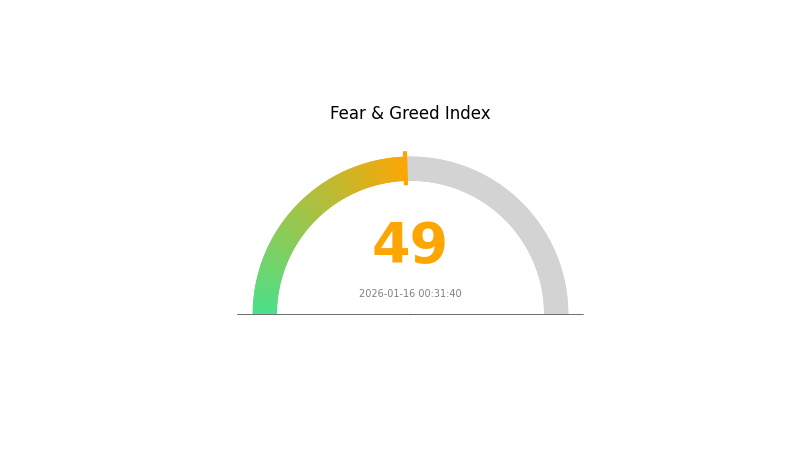
The token is currently trading approximately 98.17% below its all-time high and approximately 56.73% above its all-time low. According to the Gate.com crypto fear and greed index, the current market sentiment indicator stands at 49, suggesting a neutral market environment.
AMP is supported by 101,691 token holders and is listed on 34 cryptocurrency exchanges, demonstrating reasonable liquidity and accessibility for traders and investors.
Click to view current AMP market price
AMP Market Sentiment Indicator
2026-01-16 Fear and Greed Index: 49 (Neutral)
Click to view the current Fear & Greed Index
The cryptocurrency market is currently operating in a balanced state, with the Fear and Greed Index at 49 indicating neutral sentiment. This reading suggests that market participants are neither excessively fearful nor overly greedy, reflecting a stable and measured approach to trading. Investors should maintain a cautious yet opportunistic stance, as neutral conditions often present measured entry and exit opportunities. Monitor key market developments closely, as sentiment can shift rapidly in response to regulatory news, macroeconomic factors, or significant price movements.
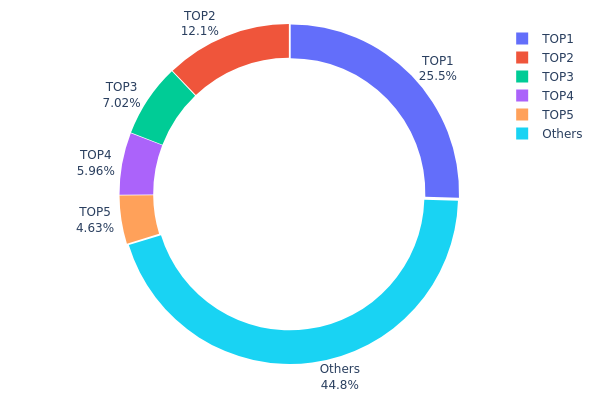
AMP Holding Distribution
According to the latest on-chain data, AMP's holding distribution exhibits a relatively high concentration pattern. The top address holds approximately 25.46% of the total supply (25.40 billion tokens), followed by the second-largest address with 12.13% (12.10 billion tokens). The top five addresses collectively control 55.18% of the circulating supply, indicating a significant concentration of tokens among major holders. The remaining 44.82% is distributed across other addresses, reflecting a moderate level of decentralization outside the top tier.
This concentration level presents a dual-edged characteristic for AMP's market structure. On one hand, such distribution suggests that a limited number of entities possess substantial influence over token circulation and price formation, potentially increasing vulnerability to large-scale selling pressure or coordinated market movements. The dominance of the top address, holding over one-quarter of the supply, raises concerns about potential single-point volatility risks. On the other hand, if these major holders represent project treasury, ecosystem reserves, or long-term strategic investors, this concentration could indicate stability and commitment to the project's long-term vision rather than immediate speculative intent.
From a market microstructure perspective, this holding pattern may contribute to reduced liquidity depth and amplified price volatility during significant trading activities. The concentrated supply could facilitate easier manipulation scenarios if major holders coordinate actions, though it simultaneously suggests lower immediate selling pressure if these entities maintain holding strategies. The current distribution reflects a market still in its maturation phase, where institutional or early-stage participants retain substantial positions, while broader retail participation remains developing.
Click to view current AMP Holding Distribution
| Top |
Address |
Holding Qty |
Holding (%) |
| 1 |
0x5d27...1d675f |
25397845.52K |
25.46% |
| 2 |
0xcd0c...40f7c3 |
12098972.89K |
12.13% |
| 3 |
0x9eda...69fd62 |
7000000.00K |
7.01% |
| 4 |
0x0c3a...60c7bd |
5938990.20K |
5.95% |
| 5 |
0x706d...e7c578 |
4618029.43K |
4.63% |
| - |
Others |
44666168.89K |
44.82% |
II. Core Factors Influencing AMP's Future Price
Supply Mechanism
- Fixed Total Supply: AMP operates with a capped total supply structure. As a collateral token within the Flexa payment network, AMP's supply dynamics are directly linked to its staking and collateralization functions.
- Historical Patterns: Since its launch in September 2020, AMP's price exhibited significant volatility. Initial trading occurred at fractions of a cent, followed by periods of appreciation as adoption expanded. Supply constraints combined with increased demand from merchant adoption have historically created upward price pressure.
- Current Impact: The growth in Flexa network merchant participation and total payment volumes processed continues to drive demand for AMP as collateral. As more value flows through the payment infrastructure, the requirement for staked AMP tokens increases, potentially creating supply pressure that may influence price movements.
Institutional and Major Holder Dynamics
- Institutional Holdings: While specific institutional holding data for AMP remains limited in the provided materials, the token's integration within the Flexa payment infrastructure positions it for potential institutional interest as digital payment adoption expands.
- Enterprise Adoption: The Flexa network's merchant adoption rate represents a critical factor. As the number of merchants accepting Flexa payments increases and total payment processing volumes grow, the fundamental demand for AMP as collateral strengthens.
- Regulatory Environment: The regulatory landscape for digital assets continues to evolve. Policy changes and regulatory clarity in major markets may significantly impact AMP's valuation and adoption trajectory.
Macroeconomic Environment
- Market Sentiment: Broader cryptocurrency market trends and investor sentiment play substantial roles in AMP's price movements. Periods of positive sentiment across digital asset markets tend to lift AMP alongside other tokens.
- Economic Trends: Macroeconomic factors, including global monetary policy shifts and economic uncertainty, influence investor appetite for alternative payment solutions and digital assets, indirectly affecting AMP's market position.
Technological Development and Ecosystem Building
- Payment Infrastructure Evolution: AMP's core value proposition centers on its role as collateral within the Flexa payment network. Technological advancements in payment processing speed, security enhancements, and network efficiency directly impact AMP's utility and attractiveness.
- Ecosystem Expansion: The growth potential of the Flexa ecosystem, including the addition of supported payment methods, geographic expansion, and partnerships with payment processors, represents a fundamental driver of long-term demand for AMP tokens.
- Application Development: As the broader digital payment landscape evolves, AMP's integration possibilities with emerging payment technologies and platforms may create additional use cases, potentially expanding demand beyond its current collateral function.
III. 2026-2031 AMP Price Prediction
2026 Outlook
- Conservative prediction: $0.00209 - $0.0022
- Neutral prediction: $0.0022 - $0.0028
- Optimistic prediction: $0.0028 (requires favorable market conditions and increased adoption)
2027-2029 Outlook
- Market stage expectation: The token is anticipated to enter a gradual growth phase, with price volatility reflecting broader market sentiment and project development milestones.
- Price range predictions:
- 2027: $0.00228 - $0.0037, representing approximately 13% growth
- 2028: $0.00161 - $0.0035, with an estimated 40% price change
- 2029: $0.00244 - $0.00482, potentially reaching 49% price variation
- Key catalysts: Market adoption trends, technological developments within the ecosystem, and broader cryptocurrency market dynamics may influence price movements during this period.
2030-2031 Long-term Outlook
- Baseline scenario: $0.00276 - $0.00406 (assuming steady ecosystem growth and moderate market conditions)
- Optimistic scenario: $0.00406 - $0.00422 in 2030, with potential expansion to $0.00377 - $0.00522 by 2031 (driven by strong adoption and favorable regulatory environment)
- Transformational scenario: $0.00522 or higher (contingent upon significant breakthroughs in utility, partnerships, or mass adoption)
- 2026-01-16: AMP price predictions suggest an 83% increase potential by 2030 and 87% by 2031 compared to the baseline low estimates (based on historical data analysis and market trend projections)
| Year |
Predicted High Price |
Predicted Average Price |
Predicted Low Price |
Price Change |
| 2026 |
0.0028 |
0.0022 |
0.00209 |
0 |
| 2027 |
0.0037 |
0.0025 |
0.00228 |
13 |
| 2028 |
0.0035 |
0.0031 |
0.00161 |
40 |
| 2029 |
0.00482 |
0.0033 |
0.00244 |
49 |
| 2030 |
0.00422 |
0.00406 |
0.00276 |
83 |
| 2031 |
0.00522 |
0.00414 |
0.00377 |
87 |
IV. AMP Professional Investment Strategies and Risk Management
AMP Investment Methodology
(1) Long-term Holding Strategy
- Target Investors: Investors seeking exposure to digital payment infrastructure and decentralized collateral systems with a medium to long-term investment horizon
- Operational Recommendations:
- Consider accumulating positions during market corrections, as AMP has shown a 14.099% increase over the past 30 days, indicating potential recovery momentum from its historical low of $0.00140933
- Monitor the circulating supply ratio of 84.28%, which suggests limited token unlock pressure and relatively stable supply dynamics
- Storage Solution: Utilize Gate Web3 Wallet for secure, self-custody storage, or consider hardware wallet solutions for larger holdings
(2) Active Trading Strategy
- Technical Analysis Tools:
- Volume Analysis: Monitor the 24-hour trading volume of $94,727.75 to identify liquidity patterns and potential breakout opportunities
- Price Range Trading: Utilize the recent 24-hour range between $0.002147 and $0.002298 to establish short-term entry and exit points
- Swing Trading Considerations:
- Pay attention to the -1.069% weekly performance versus the +14.099% monthly trend to identify potential reversal patterns
- Set stop-loss orders below key support levels to manage downside risk in this volatile asset
AMP Risk Management Framework
(1) Asset Allocation Principles
- Conservative Investors: 1-2% of crypto portfolio allocation
- Aggressive Investors: 3-5% of crypto portfolio allocation
- Professional Investors: Up to 5-8% with active hedging strategies
(2) Risk Hedging Solutions
- Portfolio Diversification: Balance AMP exposure with established cryptocurrencies and stablecoins to mitigate sector-specific risks
- Position Sizing: Given the -68.35% year-over-year performance, implement gradual position building rather than lump-sum investments
(3) Secure Storage Solutions
- Hot Wallet Recommendation: Gate Web3 Wallet for active trading and staking participation on the Flexa network
- Cold Storage Option: Hardware wallets for long-term holdings exceeding $1,000 in value
- Security Considerations: Always verify the official Ethereum contract address (0xff20817765cb7f73d4bde2e66e067e58d11095c2) before any transactions, enable two-factor authentication, and never share private keys
V. AMP Potential Risks and Challenges
AMP Market Risks
- Historical Volatility: AMP has experienced an approximate 98% decline from its all-time high of $0.120813 (June 17, 2021) to current levels, demonstrating significant volatility and downside risk
- Low Market Dominance: With only 0.0065% market share and ranking at #249, AMP faces liquidity challenges and heightened vulnerability to market-wide downturns
- Adoption Dependency: The token's value is closely tied to the growth and adoption of the Flexa payment network, which operates in a competitive digital payments landscape
AMP Regulatory Risks
- Payment Network Scrutiny: As Flexa facilitates merchant cryptocurrency payments, increased regulatory oversight of crypto payment processors could impact operational capacity
- Securities Classification Uncertainty: Staking rewards and governance features may attract regulatory attention regarding potential securities classification
- Compliance Requirements: Evolving AML/KYC regulations for crypto payment systems could increase operational costs and restrict certain use cases
AMP Technical Risks
- Smart Contract Dependencies: AMP's collateral manager and token partition systems rely on complex smart contract infrastructure, exposing users to potential vulnerabilities or exploits
- Ethereum Network Risks: As an Ethereum-based token, AMP is subject to network congestion, high gas fees, and potential protocol-level issues
- Staking Mechanism Complexity: The collateral staking system requires locked tokens that may become inaccessible during network issues or smart contract failures
VI. Conclusion and Action Recommendations
AMP Investment Value Assessment
AMP presents a specialized investment opportunity focused on the digital payments infrastructure sector. The token's primary value proposition lies in its role as collateral within the Flexa payment network, enabling instant cryptocurrency settlements for merchants. With over 101,691 holders and availability on 34 exchanges, AMP demonstrates reasonable community engagement. However, the significant 68.35% year-over-year decline and distance from its historical peak indicate substantial market challenges. The recent 30-day recovery of 14.099% suggests potential stabilization, but the low market capitalization of approximately $186 million and minimal market dominance of 0.0065% position AMP as a high-risk, speculative asset primarily suitable for investors with strong risk tolerance and belief in the long-term adoption of cryptocurrency payment systems.
AMP Investment Recommendations
✅ Beginners: Limit exposure to no more than 1-2% of total crypto portfolio; prioritize education about payment network mechanics and staking systems before investing; consider starting with small amounts on Gate.com to understand market dynamics
✅ Experienced Investors: Evaluate AMP within a diversified DeFi and payment infrastructure thesis; consider the 84.28% circulating supply and relatively low fully diluted valuation gap as positive tokenomics factors; implement dollar-cost averaging during favorable market conditions
✅ Institutional Investors: Conduct thorough due diligence on Flexa network adoption metrics and merchant partnerships; assess regulatory risk exposure for payment-focused crypto assets; consider AMP as a satellite position within broader digital commerce and infrastructure allocations
AMP Trading Participation Methods
- Spot Trading: Access AMP/USDT trading pairs on Gate.com with competitive liquidity and trading fees; suitable for both short-term trading and long-term accumulation strategies
- Staking Participation: Stake AMP tokens directly through the Flexa network to earn rewards from transaction fees while providing collateral to secure merchant payments
- Portfolio Integration: Include AMP as part of a diversified payment and infrastructure token portfolio alongside complementary assets in the crypto commerce ecosystem
Cryptocurrency investment carries extremely high risks. This article does not constitute investment advice. Investors should make prudent decisions based on their own risk tolerance and are advised to consult professional financial advisors. Never invest more than you can afford to lose.
FAQ
What is AMP token and what is its practical use?
AMP is a digital collateral token enabling instant and secure cryptocurrency transfers. It's used for merchant payments, personal transfers, and DeFi applications, supporting ERC standards for efficient value exchange.
What is AMP's historical price trend? What is the price prediction for 2024?
AMP's historical price has shown consistent growth. The 2024 price prediction ranges from 0.00310 USD to 0.00762 USD, with an expected upward momentum continuing in the coming years.
What are the main factors affecting AMP price?
AMP price is primarily influenced by Flexa network adoption rate, including merchant numbers and payment volumes. Market demand and ecosystem expansion potential are also key drivers affecting price movement.
What are the security risks of purchasing AMP tokens?
AMP token risks include market volatility, price manipulation, regulatory uncertainty, and potential network security vulnerabilities. Users should conduct thorough research and use secure wallets to protect their assets.
What is the difference between AMP and other payment tokens such as USDC and DAI?
AMP is an upgradeable token using proxy architecture for dynamic adjustments. USDC uses modern proxy patterns with clear separation between proxy and implementation. DAI is a stablecoin with different mechanisms. AMP offers greater flexibility for protocol evolution compared to traditional payment tokens.
What is the role of AMP in the Flexa payment network?
AMP serves as a collateral token in Flexa network, ensuring fast and secure payments while reducing transaction failure and fraud risks. It provides backing for transactions to enhance network reliability.
How do professional analysts predict AMP's future price?
Professional analysts project AMP's 12-month average target price at 1.91, with maximum predictions reaching 2.2 and minimum predictions at 1.6, based on comprehensive market analysis and technical indicators.
How to buy and store AMP tokens on exchanges?
Purchase AMP tokens on major cryptocurrency platforms that support AMP trading. Transfer your tokens to a secure wallet for storage. Consider using hardware wallets for enhanced security of your AMP holdings.
* The information is not intended to be and does not constitute financial advice or any other recommendation of any sort offered or endorsed by Gate.