This comprehensive guide analyzes API3's market position and provides detailed price predictions for 2026-2031. API3, a decentralized oracle solution enabling direct API-to-blockchain data feeds, currently trades at $0.44 with $62 million market cap. The article examines historical price evolution from its $10.31 peak in 2021 to current consolidation levels, evaluates core factors including token supply dynamics, ecosystem development, and macroeconomic influences. Expert forecasts range from conservative $0.356-$0.400 (2026) to transformational $0.647-$0.847 (2031) scenarios. The guide presents actionable investment strategies for beginners through institutional investors, detailed risk management frameworks including portfolio allocation guidelines, and secure storage recommendations. Additionally, it addresses potential risks from market volatility, regulatory uncertainty, and technical competition. Ideal for investors seeking professional API3 analysis and trading strategies on Gate exchange.
Introduction: API3's Market Position and Investment Value
API3, a decentralized data oracle solution enabling APIs to directly feed data to blockchain applications without third-party intermediaries, has been making significant strides in the Web3 infrastructure space since its launch in 2020. As of January 19, 2026, API3 maintains a market capitalization of approximately $62.05 million, with a circulating supply of around 139.9 million tokens, and a current price hovering near $0.44. This asset, recognized as a "first-party oracle solution," is playing an increasingly vital role in connecting traditional Web APIs with decentralized applications through its innovative Airnode middleware and Beacon data feeds.
This article will comprehensively analyze API3's price trajectory from 2026 to 2031, incorporating historical patterns, market supply-demand dynamics, ecosystem development, and macroeconomic conditions to provide investors with professional price forecasts and practical investment strategies.
I. API3 Price History Review and Market Status
API3 Historical Price Evolution Trajectory
- 2021: API3 token launched and reached its all-time high, with the price climbing to $10.3 on April 7, 2021
- 2021-2025: The token experienced a significant correction period, with the price declining substantially from its peak levels
- 2025: Market reached a cyclical low point, with the price touching $0.373481 on December 19, 2025, marking the all-time low
API3 Current Market Situation
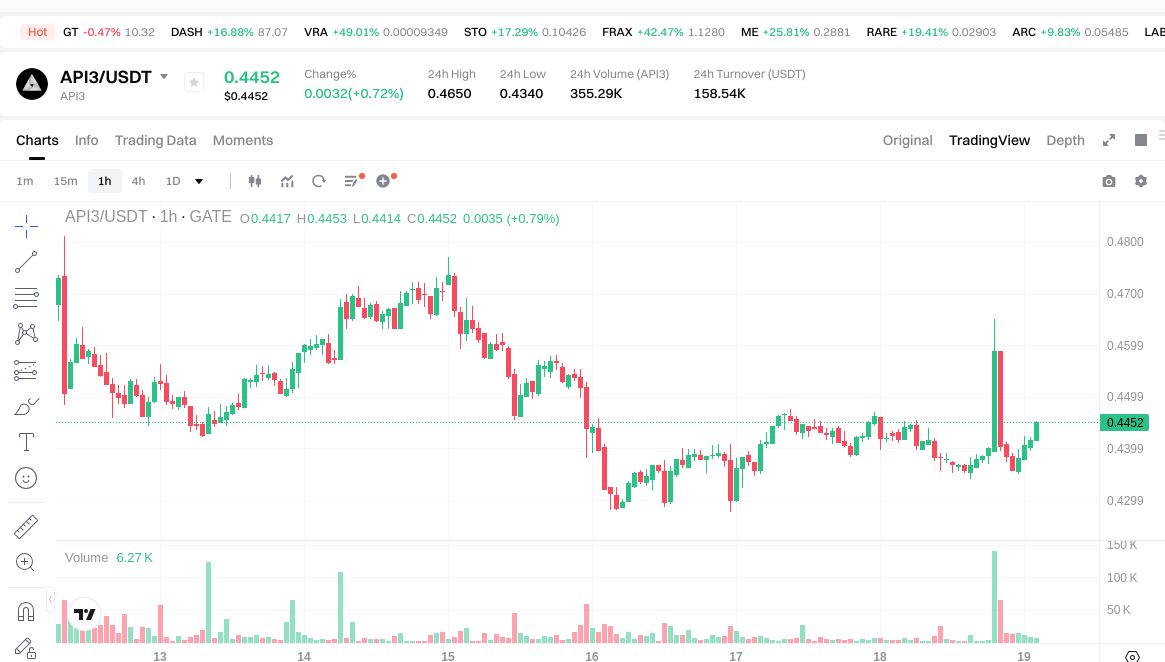
As of January 19, 2026, API3 is trading at $0.4435, representing a modest recovery from its recent low. The token has shown a slight positive movement of 0.18% over the past 24 hours and 0.75% in the last hour, indicating short-term stabilization. However, the weekly performance shows a decline of 7.35%, suggesting ongoing market volatility.
The 30-day performance demonstrates an 11.21% increase, reflecting some recovery momentum in the medium term. The year-over-year data shows a decline of 72.57%, illustrating the challenging market conditions that API3 has faced.
API3 currently holds a market ranking of 472, with a circulating supply of 139,899,133.75 tokens out of a total supply of 158,696,215.16 tokens, representing a circulation ratio of approximately 89.93%. The market capitalization stands at $62,045,265.82, with a fully diluted valuation of $70,381,771.42. The 24-hour trading volume reaches $158,262.30, and the token is listed on 32 exchanges.
The API3 token is held by 23,896 addresses, indicating a distributed holder base. The token maintains a market dominance of 0.0020%, with the ratio between market cap and fully diluted valuation at 89.93%. Current market sentiment indicators suggest a neutral status with a volatility index of 49.
Click to view current API3 market price
API3 Market Sentiment Indicator
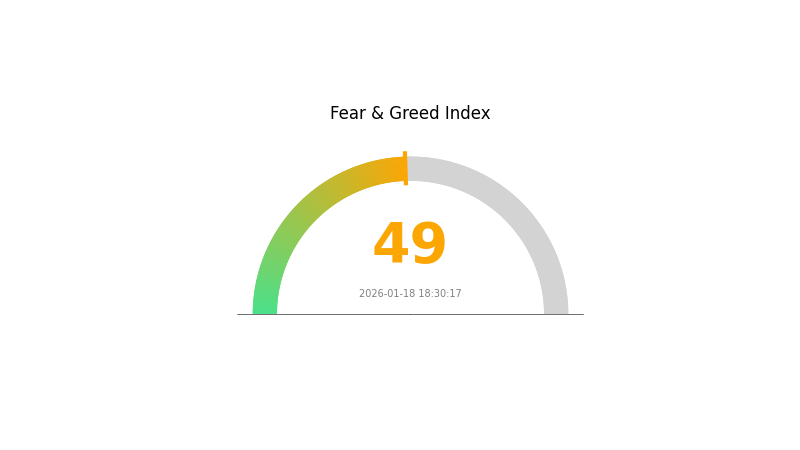
2026-01-18 Fear and Greed Index: 49 (Neutral)
Click to view current Fear & Greed Index
The API3 market currently maintains a neutral sentiment with a fear and greed index of 49, indicating balanced market conditions. Investors are neither overly pessimistic nor excessively optimistic, suggesting a stable trading environment. This neutral stance reflects cautious market behavior, where participants are evaluating opportunities without significant panic or euphoria. Traders should monitor market developments closely as sentiment may shift with upcoming economic data or industry news.
API3 Holding Distribution
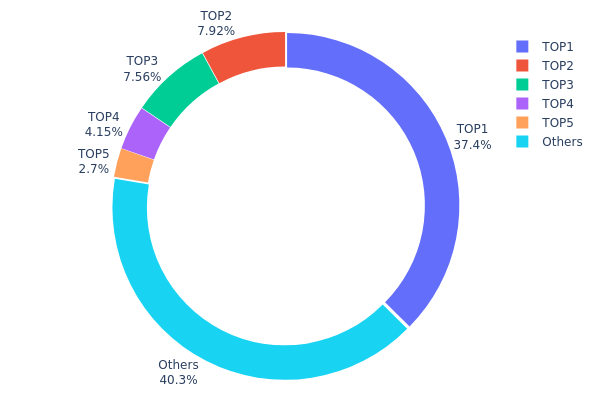
The holding distribution chart illustrates the concentration of token ownership across different wallet addresses, providing insights into the degree of decentralization and potential market influence by major holders. This metric is crucial for assessing the structural stability of a cryptocurrency's on-chain ecosystem.
According to the current data, API3 exhibits a relatively high concentration pattern. The top-ranked address holds approximately 59.37 million tokens, accounting for 37.41% of the total supply, while the top five addresses collectively control 55.71% of the circulating tokens. This concentration level indicates that a significant portion of API3's supply is held by a limited number of major addresses, which may include exchanges, institutional investors, or team-related wallets.
From a market structure perspective, such concentration carries dual implications. On one hand, it may introduce heightened volatility risks, as large holders possess substantial market-moving capabilities that could trigger significant price fluctuations through major transactions. On the other hand, if these major holders represent long-term strategic investors or ecosystem development reserves, it could reflect confidence in the project's long-term value. The "Others" category, comprising 40.29% of holdings, suggests a moderate level of token distribution among smaller participants, indicating that while major holders dominate, there exists a foundation of broader community participation.
Click to view current API3 Holding Distribution
| Top |
Address |
Holding Qty |
Holding (%) |
| 1 |
0x6dd6...c76d76 |
59369.58K |
37.41% |
| 2 |
0xf977...41acec |
12560.95K |
7.91% |
| 3 |
0xa15b...a397b4 |
12003.68K |
7.56% |
| 4 |
0xd9f8...6704ae |
6583.87K |
4.14% |
| 5 |
0x8e03...308b24 |
4283.81K |
2.69% |
| - |
Others |
63894.33K |
40.29% |
II. Core Factors Influencing API3's Future Price
Supply Mechanism
- Token Distribution Model: API3 operates with a governance token model designed to support its decentralized oracle network. The token supply follows a predetermined distribution schedule that influences market availability.
- Historical Patterns: Changes in token circulation and unlocking events have historically created supply-side pressures that correlate with price movements in the broader cryptocurrency market.
- Current Impact: The ongoing token release schedule continues to be a consideration for market participants evaluating supply dynamics.
Institutional and Major Holder Dynamics
The reference materials did not provide specific information regarding institutional holdings, enterprise adoption patterns, or nation-state policies related to API3.
Macroeconomic Environment
- Monetary Policy Impact: Cryptocurrency prices, including API3, remain susceptible to global monetary policy shifts and interest rate decisions by major central banks, which affect risk asset valuations.
- Inflation Hedge Characteristics: As with many digital assets, API3's performance may be influenced by broader market sentiment regarding inflation and alternative store-of-value narratives.
- Geopolitical Factors: International regulatory developments and macroeconomic trends continue to shape the overall cryptocurrency market environment, creating indirect effects on individual token prices.
Technology Development and Ecosystem Building
- Decentralized API (dAPI) System: API3's core innovation centers on providing decentralized API services that enable blockchain applications to access off-chain data without relying on centralized intermediaries. This technical foundation supports use cases across DeFi, IoT, and other emerging sectors.
- Oracle Network Competition: The project operates in a competitive landscape with other oracle solutions, where technical reliability, data security, and network performance serve as key differentiators for ecosystem adoption.
- Ecosystem Applications: As decentralized data services see increased demand from DeFi protocols and IoT applications, API3's technology infrastructure positions it to potentially capture value from this growing sector.
The token's price trajectory remains subject to multiple variables including project execution, market demand for decentralized oracle services, technical advancement pace, competitive positioning, and broader cryptocurrency market conditions. External regulatory changes and overall market sentiment also play significant roles in shaping price dynamics.
III. 2026-2031 API3 Price Predictions
2026 Outlook
- Conservative forecast: $0.356 - $0.400
- Neutral forecast: $0.400 - $0.445
- Optimistic forecast: $0.445 - $0.480 (contingent upon favorable market conditions and ecosystem expansion)
2027-2029 Mid-term Outlook
- Market phase expectation: The token may experience moderate volatility as the project continues development and adoption efforts, with potential fluctuations reflecting broader market sentiment shifts
- Price range forecasts:
- 2027: $0.264 - $0.639
- 2028: $0.314 - $0.567
- 2029: $0.358 - $0.648
- Key catalysts: Strategic partnerships development, protocol enhancements, increasing adoption of decentralized oracle solutions, and overall cryptocurrency market momentum
2030-2031 Long-term Outlook
- Baseline scenario: $0.332 - $0.604 (assuming steady ecosystem growth and maintained market relevance)
- Optimistic scenario: $0.604 - $0.730 (with accelerated adoption and favorable regulatory developments)
- Transformational scenario: $0.647 - $0.847 (under exceptionally favorable conditions including widespread enterprise integration and significant protocol upgrades)
- 2026-01-19: API3 positioned at early stage of potential multi-year growth trajectory
| Year |
Predicted High Price |
Predicted Average Price |
Predicted Low Price |
Price Change |
| 2026 |
0.48049 |
0.4449 |
0.35592 |
0 |
| 2027 |
0.63852 |
0.4627 |
0.26374 |
4 |
| 2028 |
0.56713 |
0.55061 |
0.31385 |
24 |
| 2029 |
0.64829 |
0.55887 |
0.35768 |
26 |
| 2030 |
0.73033 |
0.60358 |
0.33197 |
36 |
| 2031 |
0.84703 |
0.66695 |
0.64694 |
50 |
IV. API3 Professional Investment Strategy and Risk Management
API3 Investment Methodology
(1) Long-term Holding Strategy
- Suitable for: Blockchain infrastructure believers and oracle technology enthusiasts who recognize the value of decentralized data feeds
- Operational Recommendations:
- Consider accumulating positions during market corrections when API3 trades below its 30-day average
- Evaluate the project's development progress through GitHub activity and partnership announcements
- Store assets in Gate Web3 Wallet or other secure self-custody solutions for long-term holdings
(2) Active Trading Strategy
- Technical Analysis Tools:
- Volume Analysis: Monitor the 24-hour trading volume of $158,262 to identify accumulation or distribution patterns
- Support and Resistance Levels: Current 24-hour range between $0.434-$0.465 provides short-term trading boundaries
- Swing Trading Considerations:
- API3 has shown 11.21% growth over 30 days, suggesting potential medium-term momentum
- The 7-day decline of -7.35% may present entry opportunities for swing traders
API3 Risk Management Framework
(1) Asset Allocation Principles
- Conservative Investors: 1-3% of crypto portfolio allocation
- Aggressive Investors: 5-8% of crypto portfolio allocation
- Professional Investors: Up to 10% with active hedging strategies
(2) Risk Hedging Solutions
- Portfolio Diversification: Combine API3 with other oracle and infrastructure tokens to reduce sector-specific risks
- Position Sizing: Scale entries based on market conditions rather than deploying capital all at once
(3) Secure Storage Solutions
- Hot Wallet Solution: Gate Web3 Wallet for active trading and DeFi interactions
- Cold Storage Approach: Hardware wallet storage for long-term holdings exceeding $10,000
- Security Precautions: Never share private keys, enable two-factor authentication, and regularly verify contract addresses on Etherscan
V. API3 Potential Risks and Challenges
API3 Market Risks
- High Volatility: API3 has experienced a 72.57% decline over the past year, demonstrating significant price volatility
- Limited Liquidity: With a 24-hour trading volume of $158,262, sudden large orders may experience slippage
- Market Capitalization Position: Ranked #472 with 0.0020% market dominance, making it susceptible to broader market downturns
API3 Regulatory Risks
- Oracle Service Classification: Evolving regulatory frameworks may impose new compliance requirements on decentralized oracle providers
- Cross-border Data Transmission: API data feeds may face scrutiny under different jurisdictions' data protection regulations
- Token Utility Classification: Regulatory clarity on governance and staking tokens remains uncertain in multiple markets
API3 Technical Risks
- Oracle Security Dependencies: Smart contract vulnerabilities in the Airnode system could impact data feed reliability
- Network Competition: Competing oracle solutions may capture market share and reduce API3's value proposition
- Integration Complexity: Technical barriers to Airnode deployment may slow adoption among traditional API providers
VI. Conclusion and Action Recommendations
API3 Investment Value Assessment
API3 presents a compelling value proposition in the decentralized oracle space through its first-party data feed approach, eliminating third-party intermediaries that have historically been points of failure. The project's 89.93% circulating supply ratio demonstrates a relatively mature token distribution, while the staking mechanism provides utility beyond speculation. However, investors must weigh this potential against substantial short-term risks, including the 72.57% year-over-year price decline and ongoing market volatility. The project's focus on Beacons and Airnode technology positions it within the critical blockchain infrastructure sector, but success depends on continued developer adoption and ecosystem growth.
API3 Investment Recommendations
✅ Beginners: Start with minimal exposure (under 2% of crypto portfolio) and focus on understanding oracle technology before increasing positions. Use Gate.com's spot trading to avoid leverage risks.
✅ Experienced Investors: Consider dollar-cost averaging during the current consolidation phase, with positions sized at 3-5% of crypto portfolio. Monitor the 30-day trend and community governance participation for entry timing.
✅ Institutional Investors: Evaluate API3 as part of a diversified blockchain infrastructure thesis, with positions up to 5-8% of digital asset allocation. Conduct thorough due diligence on smart contract audits and partnership developments.
API3 Trading Participation Methods
- Spot Trading on Gate.com: Direct purchase and sale of API3 tokens with transparent pricing and deep liquidity
- Staking Participation: Engage with the API3 insurance staking pool to earn rewards while supporting oracle security
- Governance Involvement: Acquire tokens to participate in API3 DAO proposals and project decision-making
Cryptocurrency investments carry extremely high risks, and this article does not constitute investment advice. Investors should make cautious decisions based on their own risk tolerance and are advised to consult professional financial advisors. Never invest more than you can afford to lose.
FAQ
What is API3 token? What are its uses?
API3 token is the native token of the API3 platform, used for payments and community governance. It enables stakeholders to participate in DAO decisions and stake in insurance contracts.
What are the main factors affecting API3 price?
API3 price is influenced by market sentiment, trading volume, technological innovations, and overall market trends. Investor confidence and adoption of the API3 protocol also play significant roles in price movements.
What is the historical price trend of API3?
API3 reached its all-time high of over $10.31 USD on April 6, 2021. The price subsequently experienced significant fluctuations, hitting its lowest point on December 18, 2025. As of January 18, 2026, API3 continues to trade in the market with ongoing price movements influenced by market demand and ecosystem developments.
What price will API3 reach in 2024?
API3 reached $1.86 in December 2024. As of January 2026, the price has adjusted to $1.27. Future price movements depend on market dynamics, adoption rates, and broader crypto market conditions.
What are the risks of investing in API3?
API3 investment risks include market volatility, cryptocurrency price fluctuations, and market uncertainty. Digital assets can experience significant price swings, potentially resulting in losses. Market conditions and adoption rates directly impact token value performance.
What are the advantages of API3 compared to other oracle projects like Chainlink?
API3 delivers superior data accuracy and lower latency than Chainlink. With a significantly smaller market cap, it offers substantial growth potential. API3's innovative oracle architecture positions it as a compelling alternative in the oracle ecosystem.
* The information is not intended to be and does not constitute financial advice or any other recommendation of any sort offered or endorsed by Gate.