# 2025 APP Price Prediction: Expert Analysis and Market Forecast
This comprehensive guide delivers professional price forecasts and investment strategies for Moon App (APP) through 2030. Designed for retail traders, experienced investors, and DeFi enthusiasts, the article analyzes APP's historical performance, current market conditions, and core ecosystem factors influencing token valuation. Readers will discover detailed price predictions across multiple scenarios, risk management frameworks, and practical trading approaches via Gate exchange. The analysis combines technical indicators, holdings distribution data, and macroeconomic insights to equip investors with actionable intelligence for navigating this high-volatility microcap asset in the on-chain trading automation sector.
Introduction: Market Position and Investment Value of APP
Moon App (APP) is an Injective-focused superapp that integrates advanced on-chain trading bots including trading, on-chain limit orders, presale sniping, liquidity sniping, and sandwiching bots for retail users. Since its launch in early 2024, the project has established itself as a specialized trading infrastructure solution. As of December 2025, APP has a market capitalization of approximately $911,548.75, with a circulating supply of about 1,985,944,981.93 tokens, trading at around $0.000459 per token.
This innovative on-chain trading tool is playing an increasingly important role in democratizing advanced trading strategies and bot functionalities for retail participants in the decentralized finance ecosystem.
This article will comprehensively analyze APP's price trends during 2025-2030, combining historical patterns, market supply and demand dynamics, ecosystem development, and macroeconomic factors to provide investors with professional price forecasts and practical investment strategies.
Moon App (APP) Market Analysis Report
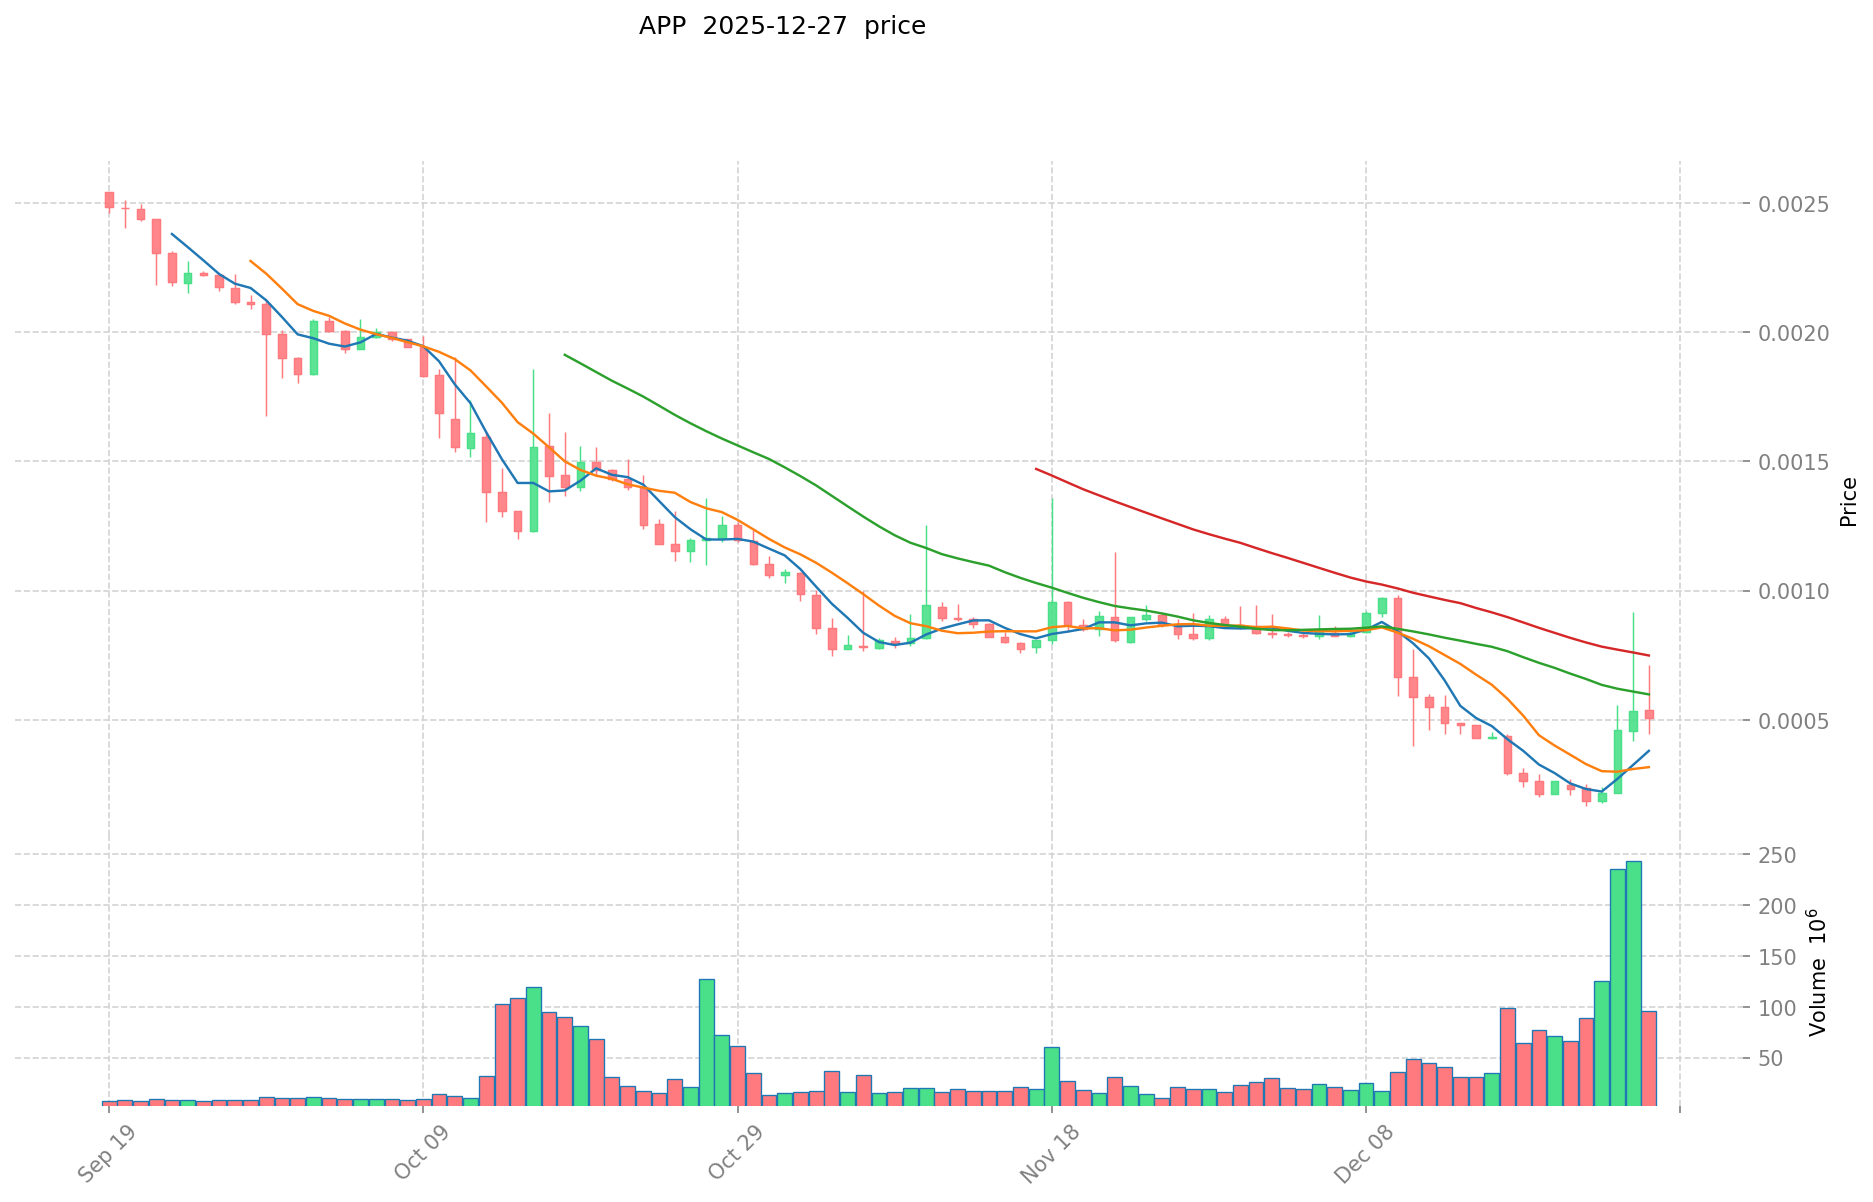
I. APP Price History Review and Current Market Status
APP Historical Price Trajectory
-
January 2024: Project launch with initial pricing at $0.0067. The token reached its all-time high of $0.051 on January 16, 2024, reflecting strong early market enthusiasm following the launch of Moon App as an Injective-focused superapp.
-
2024-2025 Period: Significant market correction phase. The token experienced a sustained downtrend from its peak, declining approximately 93.38% over the one-year period, reflecting broader market conditions and token performance challenges.
-
December 2025: Further deterioration with the token reaching its all-time low of $0.000169 on December 22, 2025. This marks the lowest valuation point since the project's inception.
APP Current Market Conditions
As of December 27, 2025, APP is trading at $0.000459, representing a 14.71% decline over the past 24 hours. The token is currently ranked #2,694 by market capitalization with a fully diluted valuation of $1,377,000 and a circulating market cap of $911,548.75.
The 24-hour trading volume stands at $42,949.19, with the token fluctuating between a 24-hour low of $0.0004081 and a high of $0.0005547. Short-term momentum shows weakness, with a 1-hour decline of 0.11%. However, the 7-day period demonstrates a notable recovery with a 95.89% gain, suggesting some volatility in market sentiment.
The token's circulating supply comprises 1,985,944,981.94 APP out of a maximum total supply of 3,000,000,000 tokens, representing a 66.2% circulation ratio. There are currently 1,766 token holders on the network.
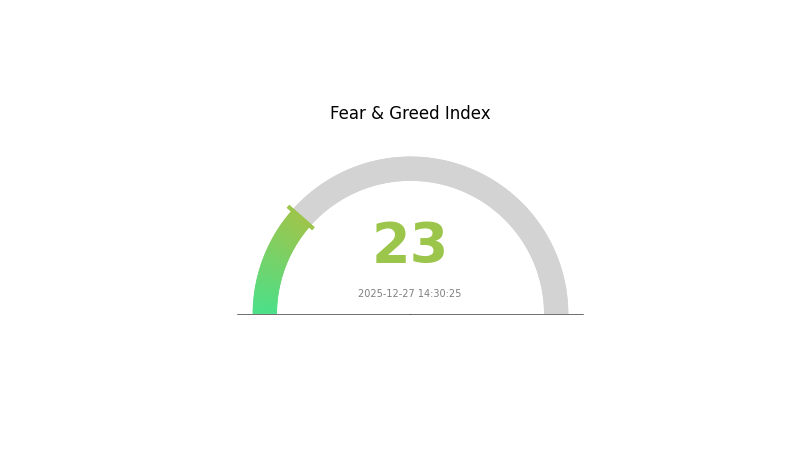
Moon App maintains a market dominance share of 0.000043%, indicating minimal influence on the broader cryptocurrency market. The current market emotion index registers at 1, coinciding with an "Extreme Fear" sentiment (VIX: 23) across the cryptocurrency market.
View current APP market price
APP Market Sentiment Index
2025-12-27 Fear and Greed Index: 23 (Extreme Fear)
The crypto market is currently experiencing extreme fear, with the Fear and Greed Index at 23. This indicates heightened market pessimism and risk aversion among investors. Such conditions often present buying opportunities for contrarian traders, as extreme fear typically precedes market recoveries. However, exercise caution and conduct thorough research before making investment decisions. Monitor market developments closely and consider dollar-cost averaging strategies during volatile periods.
Click to view the current Fear & Greed Index
APP Holdings Distribution
Click to view current APP holdings distribution
The address holdings distribution represents the concentration of token ownership across the blockchain network, revealing the structural characteristics of asset allocation among major stakeholders. By analyzing the top holders and their respective proportions, this metric provides critical insights into the decentralization level, market stability, and potential vulnerability to coordinated actions within the ecosystem.
The current distribution exhibits moderate concentration characteristics. The top five addresses collectively control approximately 43.01% of total holdings, with the largest holder commanding 14.37% and the second-largest holding 11.20% of the circulating supply. This concentration level indicates that while significant capital is consolidated among major stakeholders, the distribution remains relatively dispersed compared to highly centralized projects. The remaining 56.99% of tokens distributed across numerous other addresses suggests a reasonably healthy decentralization structure, where no single entity or collusion of a few actors can unilaterally manipulate market dynamics or governance mechanisms.
From a market stability perspective, this distribution pattern presents a balanced profile. The presence of substantial holdings among top addresses creates potential liquidity providers and price stabilizers, though it simultaneously introduces risks of coordinated selling or strategic token releases affecting price volatility. The significant proportion held by dispersed addresses (56.99%) serves as a stabilizing factor, reducing the likelihood of extreme price manipulation. The current holdings configuration reflects a maturing ecosystem with institutional participation while maintaining sufficient decentralization to support organic market development and community engagement.
</Holdings Distribution Analysis>
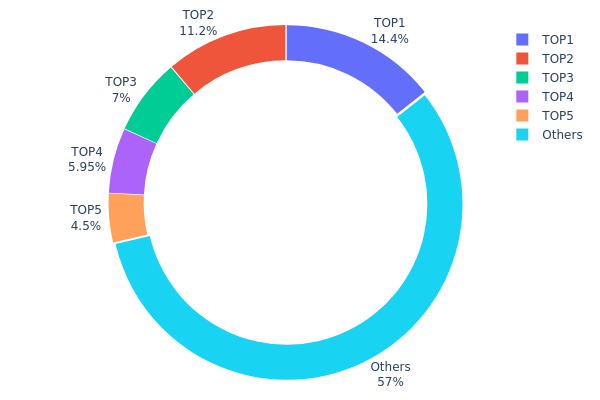
| Top |
Address |
Holding Qty |
Holding (%) |
| 1 |
0x0d07...b492fe |
431123.64K |
14.37% |
| 2 |
0x5ddd...cc6cfb |
336000.00K |
11.20% |
| 3 |
0xe190...170182 |
210000.00K |
7.00% |
| 4 |
0x4a12...00a795 |
178419.13K |
5.94% |
| 5 |
0xe459...c5d02f |
135000.03K |
4.50% |
| - |
Others |
1709457.20K |
56.99% |
Core Factors Influencing Future App Price Trends
Based on the provided materials, the core factors affecting an app's future price are primarily development-related rather than cryptocurrency market dynamics. The following analysis outlines the key determinants:
II. Core Factors Influencing App Future Price
Functional Complexity
-
Complexity Impact: The functional complexity of an app is the primary factor determining development costs and long-term pricing. Simple utility apps with minimal features command lower prices, while comprehensive applications incorporating social features, real-time communications, and big data analytics require significantly higher investment.
-
Historical Pattern: As app markets mature and user expectations increase, feature-rich applications consistently maintain premium pricing compared to basic tools.
-
Current Influence: Modern apps require increasingly sophisticated functionality to remain competitive, directly translating to higher development and maintenance costs.
Design and User Experience Requirements
-
UI/UX Investment: Professional interface design and seamless user experience significantly impact both initial development costs and ongoing pricing. Custom, high-end designs requiring extended design iterations increase overall expenses substantially.
-
Multi-platform Considerations: Apps supporting both iOS and Android platforms through separate development processes incur approximately double the baseline costs compared to single-platform solutions.
Development Timeline and Team Expertise
-
Timeline Impact: Extended development cycles directly correlate with increased personnel costs and overhead expenses, making accelerated timelines more cost-intensive.
-
Team Qualifications: Experienced development teams command higher rates than emerging teams, yet provide superior quality assurance and faster delivery cycles, ultimately affecting the app's market viability and pricing strategy.
Post-Launch Maintenance and Updates
-
Ongoing Costs: Professional maintenance services, security updates, and feature enhancements constitute significant operational expenses. Service quality levels directly correlate with provider pricing.
-
Market Stability: Continuous updates and optimization ensure application stability and security, critical factors for user retention and long-term market performance.
Technology Stack Selection
-
Development Efficiency: Mature, stable technology stacks reduce costs and accelerate deployment timelines. Conversely, emerging or proprietary technologies increase development complexity and expenses.
-
Cross-Platform Solutions: While cross-platform development reduces initial costs, potential functional compromises may limit the application's market competitiveness.
Note: The provided materials focus on app development economics rather than cryptocurrency asset pricing mechanisms. Traditional app pricing is determined by development resource allocation, market positioning, and service delivery quality rather than supply dynamics or macroeconomic factors typically analyzed in cryptocurrency markets.
Three、2025-2030 APP Price Forecast
2025 Outlook
- Conservative Forecast: $0.00030 - $0.00040
- Neutral Forecast: $0.00046
- Optimistic Forecast: $0.00057 (requires sustained market sentiment and adoption growth)
2026-2028 Mid-term Outlook
- Market Stage Expectation: Consolidation phase with gradual recovery, characterized by incremental value accumulation and market maturation
- Price Range Forecast:
- 2026: $0.00031 - $0.00056 (12% appreciation potential)
- 2027: $0.00045 - $0.00074 (16% appreciation potential)
- 2028: $0.00033 - $0.00070 (38% appreciation potential)
- Key Catalysts: Ecosystem expansion, institutional adoption recognition, technological upgrades, and improved market liquidity on platforms such as Gate.com
2029-2030 Long-term Outlook
- Base Case: $0.00041 - $0.00074 (assuming steady ecosystem development and moderate market conditions)
- Optimistic Case: $0.00060 - $0.00081 (assuming accelerated adoption, positive regulatory environment, and strong market momentum)
- Transformative Case: $0.00081+ (contingent on breakthrough technological innovations, mainstream institutional adoption, and favorable macroeconomic conditions)
Note: Price forecasts are subject to market volatility, regulatory changes, and broader cryptocurrency market dynamics. Investors should conduct thorough due diligence before making investment decisions.
| 年份 |
预测最高价 |
预测平均价格 |
预测最低价 |
涨跌幅 |
| 2025 |
0.00057 |
0.00046 |
0.0003 |
0 |
| 2026 |
0.00056 |
0.00051 |
0.00031 |
12 |
| 2027 |
0.00074 |
0.00053 |
0.00045 |
16 |
| 2028 |
0.0007 |
0.00064 |
0.00033 |
38 |
| 2029 |
0.00074 |
0.00067 |
0.00041 |
45 |
| 2030 |
0.00081 |
0.0007 |
0.0006 |
52 |
APP Token Investment Analysis Report
IV. APP Professional Investment Strategy and Risk Management
APP Investment Methodology
(1) Long-Term Holding Strategy
- Target Investors: Retail users interested in on-chain trading automation and decentralized finance tools
- Operational Recommendations:
- Accumulate APP tokens during market downturns when volatility is high, as the token has experienced significant depreciation (-93.38% year-over-year)
- Hold tokens for extended periods to participate in potential ecosystem growth as Moon App expands its user base and feature adoption
- Dollar-cost averaging (DCA) approach to mitigate short-term price volatility and reduce average entry costs
(2) Active Trading Strategy
- Technical Analysis Tools:
- Support and Resistance Levels: Monitor the all-time high of $0.051 (January 16, 2024) and current trading levels around $0.000459 to identify reversal patterns
- Volume Analysis: Track the 24-hour trading volume ($42,949.19) to identify liquidity conditions and potential breakout opportunities
- Wave Trading Key Points:
- Capitalize on the recent 7-day surge of +95.89% to identify short-term momentum shifts
- Monitor 30-day downtrend patterns (-46.91%) to anticipate potential recovery phases
APP Risk Management Framework
(1) Asset Allocation Principles
- Conservative Investors: 1-2% of total portfolio allocation
- Aggressive Investors: 3-5% of total portfolio allocation
- Professional Investors: 5-10% of total portfolio allocation with sophisticated hedging strategies
(2) Risk Hedging Solutions
- Portfolio Diversification: Combine APP holdings with established cryptocurrency assets and traditional investments to reduce concentration risk
- Position Sizing: Implement strict position limits to prevent catastrophic losses from adverse price movements
(3) Secure Storage Solutions
- Hot Wallet Option: Gate Web3 Wallet for frequent trading and DeFi interaction, offering convenient access to Moon App's trading features
- Cold Storage Method: Transfer tokens to secure offline storage for long-term holdings exceeding six months, reducing exposure to exchange hacks
- Security Considerations: Always enable two-factor authentication, maintain private key backups in secure locations, and verify contract addresses before transactions
V. APP Potential Risks and Challenges
APP Market Risk
- Extreme Volatility: APP has experienced -93.38% depreciation over one year, indicating severe price instability and significant downside risk potential
- Liquidity Constraints: With only 3 exchanges offering APP trading and modest 24-hour volume of $42,949.19, market liquidity remains limited, causing potential execution challenges
- Low Market Capitalization: Current market cap of approximately $911,548 indicates a microcap asset vulnerable to price manipulation and sudden collapse
APP Regulatory Risk
- Uncertain Regulatory Status: Trading bot functionality and automated transaction features may face regulatory scrutiny from financial authorities worldwide
- Compliance Challenges: The Injective blockchain ecosystem operates in a rapidly evolving regulatory landscape with varying requirements across jurisdictions
- Policy Changes: Future regulations targeting automated trading tools or DeFi protocols could materially impact APP token value and platform operations
APP Technical Risk
- Smart Contract Vulnerabilities: On-chain trading bot infrastructure may contain undiscovered security flaws or exploit vectors
- Blockchain Dependency: Moon App's functionality depends entirely on the stability and security of the Injective blockchain protocol
- Integration Risks: Complex integration of multiple trading bot functions (limit orders, sniping, sandwich trading) increases potential failure points
VI. Conclusion and Action Recommendations
APP Investment Value Assessment
APP represents a high-risk, speculative investment opportunity within the decentralized trading automation sector. The token's dramatic 93.38% depreciation over one year, combined with low liquidity and limited exchange availability, suggests significant downside exposure. However, the recent 7-day recovery of +95.89% indicates potential short-term momentum opportunities. Moon App's innovative approach to combining multiple on-chain trading functions for retail users addresses a genuine market need in the DeFi ecosystem. Investors should approach APP as a highly volatile speculative position rather than a stable long-term holding, carefully evaluating their risk tolerance against potential gains.
APP Investment Recommendations
✅ Beginners: Start with minimal allocation (0.5-1% of portfolio) only if you understand the technology and can afford total loss. Focus on educational research before purchasing.
✅ Experienced Investors: Consider DCA strategies during high volatility periods, maintain strict stop-loss orders at 20-30% below entry price, and rebalance portfolio quarterly.
✅ Institutional Investors: Conduct comprehensive due diligence on Moon App's development team, smart contract audit reports, and Injective ecosystem integration stability before any allocation decision.
APP Trading Participation Methods
- Gate.com Exchange: Trade APP directly through Gate.com's spot trading markets for ETH and BSC blockchain versions, accessing professional-grade charting and order management tools
- DeFi Interaction: Use Gate Web3 Wallet to interact directly with Moon App's on-chain trading features and access decentralized liquidity pools
- Token Staking: Monitor Moon App's official channels for potential staking opportunities, yield farming programs, or governance participation mechanisms
Cryptocurrency investment carries extreme risk. This report does not constitute investment advice. Investors must make decisions based on personal risk tolerance and financial circumstances. Always consult qualified financial advisors before investing. Never invest funds you cannot afford to lose completely.
FAQ
Is APP a good stock to buy?
APP has received a "Strong Buy" rating from analysts with a 12-month price target of $761.94, indicating strong growth potential. The strong analyst consensus suggests positive market outlook for APP.
Can AppLovin stock reach $1000?
AppLovin stock reaching $1,000 would require approximately 60% growth from current levels. The company would need annual earnings near $6 billion with sustained 35-40% margins. While ambitious, it's achievable if AppLovin maintains AI-driven ad market dominance and scales revenue to $12-13 billion annually.
How high will AppLovin stock go?
AppLovin stock could reach $1,000 per share if it achieves $6 billion in annual earnings with strong margins. Current valuation is around $220 billion. Future growth depends on sustained dominance in AI-driven advertising technology.
What will AppLovin stock be worth in 2030?
AppLovin stock is predicted to be worth between $2,239.37 and $3,246.64 in 2030, based on current market trends and historical performance analysis.
What factors influence AppLovin (APP) stock price predictions?
AppLovin stock price predictions are influenced by its faster growth compared to major peers, strong Axon platform performance, AI-powered ad solutions, and S&P 500 inclusion. Market competition from Unity and IronSource, along with revenue growth rates, also impact valuations.
AppLovin stock has demonstrated strong upward momentum recently, with a 7.1% gain recorded on May 24, 2025. The performance reflects positive market sentiment and company growth prospects. Historical trends indicate bullish momentum in the stock's valuation trajectory.
What are the risks and uncertainties in predicting APP stock price?
Price prediction risks include market volatility, model limitations, unexpected economic events, and unpredictable external factors. Trading volume fluctuations and sentiment shifts can significantly impact accuracy.
* The information is not intended to be and does not constitute financial advice or any other recommendation of any sort offered or endorsed by Gate.