The article offers a thorough analysis of Archway (ARCH), focusing on its market position, price history, current valuation, and future projections. It examines the factors influencing ARCH's price movements, including supply mechanics and macroeconomic impacts, while providing investment strategies and risk management solutions. Addressing the needs of both novice and seasoned investors, it discusses market sentiment, regulatory and technical risks, and offers detailed forecasts for 2025-2030. This content serves as a valuable guide for understanding ARCH's potential, optimizing investment decisions, and navigating market volatility.
Introduction: ARCH's Market Position and Investment Value
Archway (ARCH) is an incentivized smart contract platform designed to reward developers and foster the next generation of decentralized applications. Since its launch, Archway has established itself as a unique Layer-1 blockchain that democratizes access to capital and opportunities for developers worldwide by embedding reward mechanisms directly into the protocol itself. As of December 26, 2025, ARCH has a market capitalization of $2,602,898.66, with a circulating supply of approximately 640.03 million tokens, currently trading at $0.002263. This innovative platform, recognized for its developer-centric incentive model, is playing an increasingly important role in building a diverse and sustainable ecosystem of cross-chain decentralized applications.
This article will provide a comprehensive analysis of ARCH's price trajectory through 2025-2030, combining historical price patterns, market supply and demand dynamics, ecosystem developments, and macroeconomic factors to deliver professional price forecasts and practical investment strategies for both novice and experienced investors.
Archway (ARCH) Market Analysis Report
I. ARCH Price History Review and Current Market Status
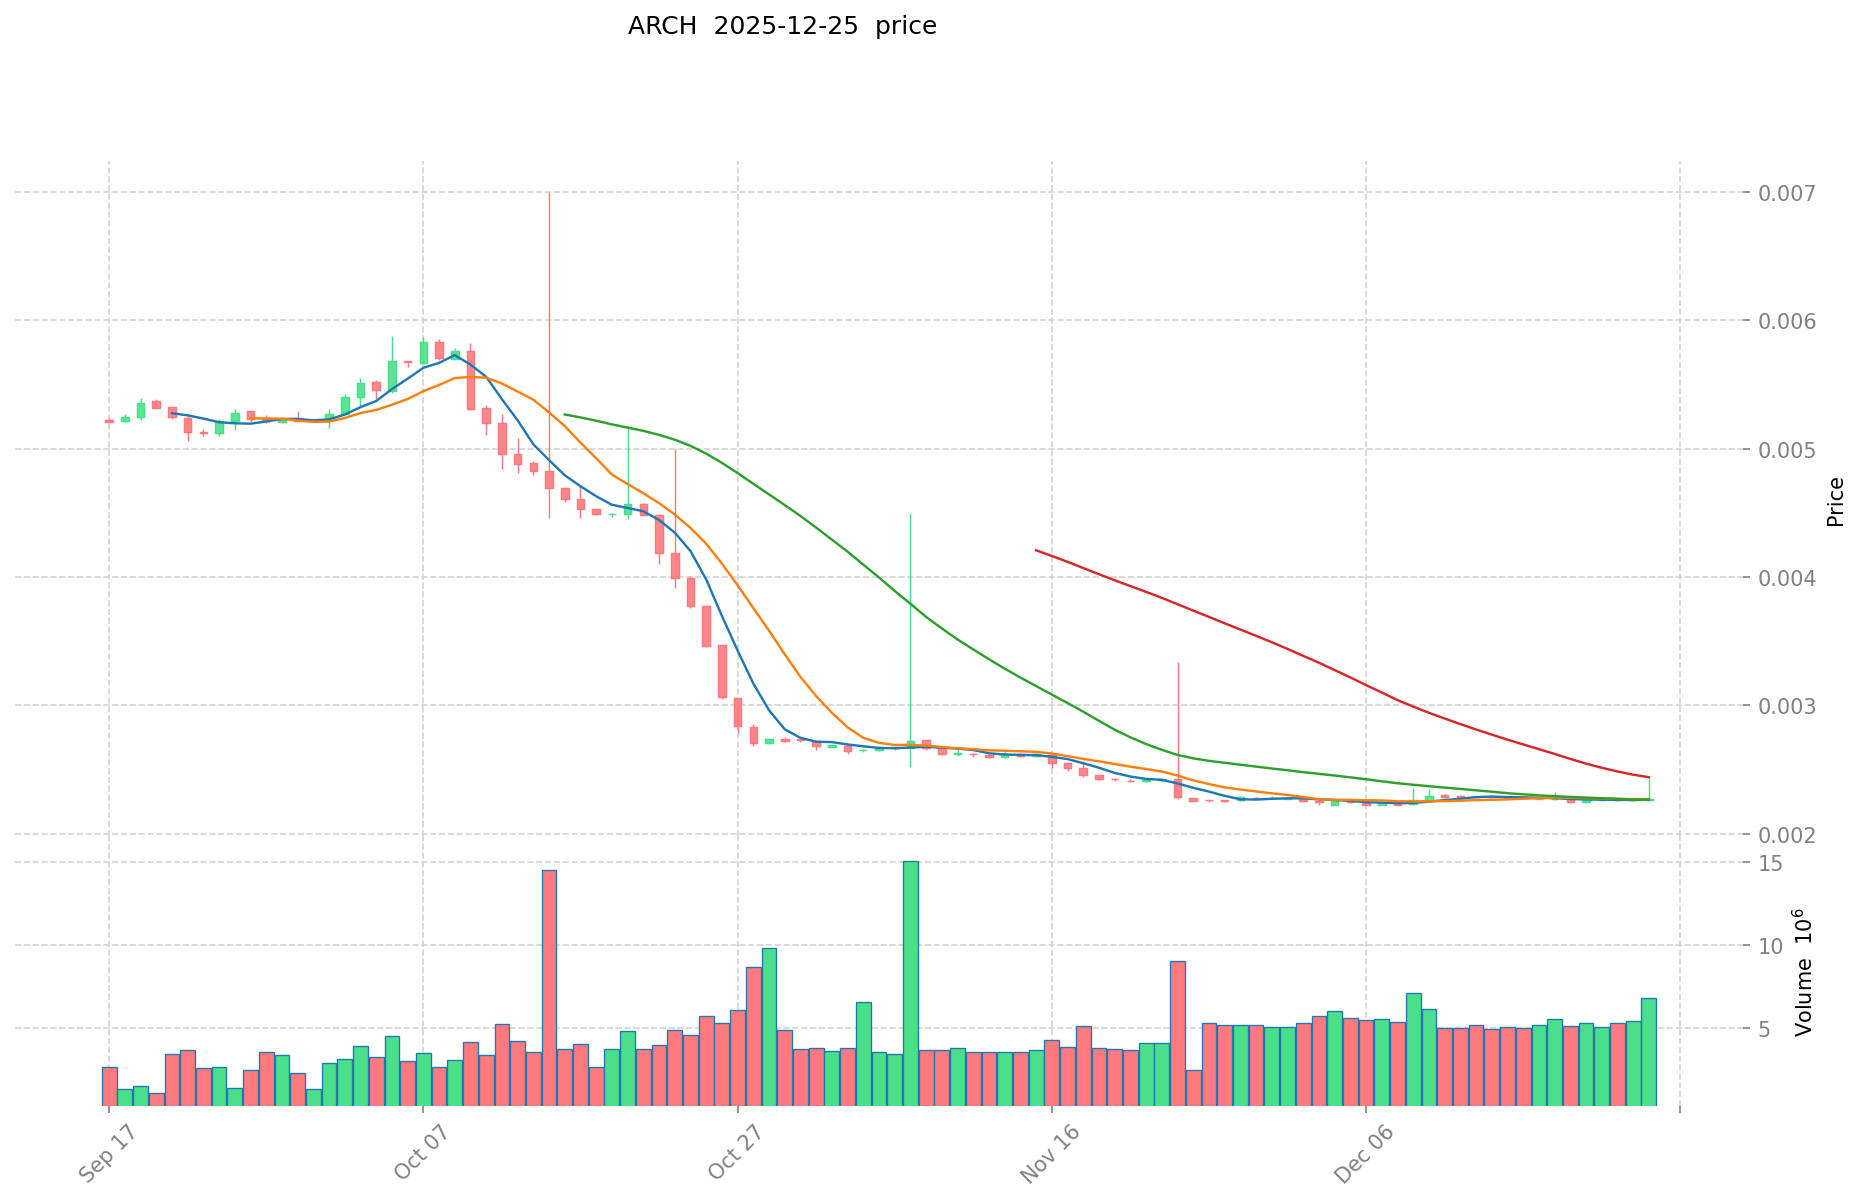
ARCH Historical Price Movement Trajectory
- December 24, 2023: ARCH reached its all-time high (ATH) of $0.28899, marking a peak in market valuation during the 2023 bull cycle.
- December 6, 2025: ARCH hit its all-time low (ATL) of $0.002221, representing a significant decline from historical peaks.
ARCH Current Market Conditions
As of December 26, 2025, ARCH is trading at $0.002263, with a market capitalization of approximately $1.45 million and a fully diluted valuation of $2.60 million. The token currently ranks #2357 by market cap with a market dominance of 0.000081%.
24-Hour Performance: ARCH declined by 0.48% in the past 24 hours, with a trading range between $0.002252 (24H low) and $0.00228 (24H high). Daily trading volume stands at $12,082.85.
Medium-Term Trends: The token has experienced consistent downward pressure over extended timeframes:
- 7-Day Change: -0.75%
- 30-Day Change: -0.96%
- Year-to-Date Change: -91.85%
Circulating Supply Metrics: ARCH has a circulating supply of 640,028,533.55 tokens out of a total supply of 1,150,198,258.67 tokens, representing approximately 64% circulation. The maximum supply cap is set at 1 billion tokens.
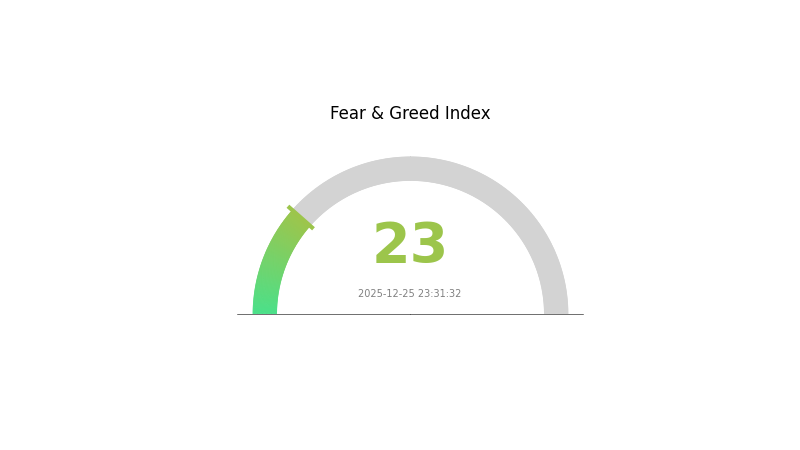
Market Sentiment: Current market conditions reflect extreme fear with a VIX reading of 23, indicating heightened volatility and risk aversion across the broader cryptocurrency market.
Visit ARCH Market Price on Gate.com
ARCH Market Sentiment Index
2025-12-25 Fear and Greed Index: 23 (Extreme Fear)
Click to view current Fear & Greed Index
The crypto market is currently in a state of extreme fear, with the Fear and Greed Index plummeting to 23. This indicates heightened market anxiety and strong bearish sentiment among investors. During such periods, risk-averse traders typically reduce positions, while contrarian investors may view this as a potential buying opportunity. It's crucial to maintain a rational investment strategy and avoid panic selling. On Gate.com, you can access real-time market data and comprehensive analysis tools to help navigate these volatile conditions effectively.
ARCH Token Holdings Distribution
The address holdings distribution represents the concentration of ARCH tokens across different wallet addresses on the blockchain. This metric serves as a critical indicator of token decentralization and market structure, revealing how evenly or unevenly tokens are distributed among holders. A highly concentrated distribution suggests that a small number of addresses control a significant portion of the token supply, which can pose risks to market stability and governance integrity. Conversely, a more distributed holding pattern indicates stronger decentralization and a more resilient market structure.
Due to the absence of specific holding data in the provided dataset, a comprehensive assessment of ARCH's current concentration characteristics cannot be conducted at this time. However, the importance of monitoring this metric cannot be overstated. The degree of address concentration directly influences price volatility, potential market manipulation risks, and the overall health of the token's ecosystem. When token holdings are excessively concentrated among a limited number of addresses, the risk of coordinated selling or market manipulation increases substantially. Such scenarios could trigger sharp price fluctuations and undermine market confidence.
To accurately evaluate ARCH's decentralization status and on-chain structure stability, detailed holdings data across different address tiers would be essential. Regular monitoring of this distribution metric enables stakeholders to assess whether the token maintains adequate decentralization or whether concentration risks are emerging. This analysis remains fundamental for understanding the long-term viability and market dynamics of the ARCH token ecosystem.
Visit ARCH Holdings Distribution on Gate.com for real-time data.

| Top |
Address |
Holding Qty |
Holding (%) |
II. Core Factors Influencing ARCH's Future Price
Supply Mechanism
-
Inflationary Issuance Model: ARCH employs an inflationary token issuance mechanism with continuous new token generation. This ongoing expansion of token supply is a fundamental characteristic of the protocol's economic design.
-
Historical Trends: Historical supply growth has generally exerted downward pressure on ARCH's price. Past patterns demonstrate that increased token circulation tends to create bearish market conditions without corresponding demand increases.
-
Current Impact: The sustained inflationary mechanism continues to impact ARCH's near-term price dynamics, as new tokens entering circulation may suppress price appreciation unless matched by robust ecosystem adoption and demand growth.
Macroeconomic Environment
-
Monetary Policy Impact: Central bank interest rate policies directly influence ARCH's price trajectory. Rate increases may reduce investment attractiveness for ARCH by elevating opportunity costs and making risk-free assets more attractive to investors.
-
Inflation Hedge Properties: ARCH demonstrates characteristics as an inflation hedge asset. During periods of elevated inflation, investors may increase allocation to ARCH as a store of value protection mechanism, potentially supporting price appreciation in inflationary environments.
III. 2025-2030 ARCH Price Forecast
2025 Outlook
- Conservative Forecast: $0.00147 - $0.00226
- Neutral Forecast: $0.00226
- Bullish Forecast: $0.00317 (requires sustained market momentum and increased institutional adoption)
2026-2028 Medium-term Outlook
- Market Phase Expectation: Gradual recovery and stabilization phase with incremental growth trajectory
- Price Range Predictions:
- 2026: $0.00193 - $0.00378 (20% upside potential)
- 2027: $0.00231 - $0.00464 (43% upside potential)
- 2028: $0.00367 - $0.00521 (74% upside potential)
- Key Catalysts: Enhanced protocol development, expanded ecosystem partnerships, growing user adoption on Gate.com and other platforms, and improved market sentiment toward the asset class
2029-2030 Long-term Outlook
- Base Case Scenario: $0.00261 - $0.00499 (assumes steady ecosystem growth and moderate market conditions)
- Bullish Scenario: $0.00458 - $0.00703 (assumes accelerated technological advancement and mainstream adoption)
- Transformative Scenario: $0.00703+ (assumes breakthrough utility implementation and significant market expansion with 111% cumulative gains by 2030)
- 2030-12-26: ARCH targets $0.00703 (potential peak valuation based on cumulative growth trajectory of 102-111% from 2025 levels)
| 年份 |
预测最高价 |
预测平均价格 |
预测最低价 |
涨跌幅 |
| 2025 |
0.00317 |
0.00226 |
0.00147 |
0 |
| 2026 |
0.00378 |
0.00272 |
0.00193 |
20 |
| 2027 |
0.00464 |
0.00325 |
0.00231 |
43 |
| 2028 |
0.00521 |
0.00394 |
0.00367 |
74 |
| 2029 |
0.00499 |
0.00458 |
0.00261 |
102 |
| 2030 |
0.00703 |
0.00478 |
0.00306 |
111 |
Archway (ARCH) Professional Investment Strategy and Risk Management Report
IV. ARCH Professional Investment Strategy and Risk Management
ARCH Investment Methodology
(1) Long-term Holding Strategy
- Suitable for: Developers and dApp builders seeking protocol exposure, believers in developer-incentivized platforms, institutional investors with extended time horizons
- Operational Recommendations:
- Accumulate ARCH during market downturns when valuations are depressed, leveraging dollar-cost averaging to reduce timing risk
- Hold positions through protocol development cycles and ecosystem expansion phases, as long-term value accrual depends on successful dApp launches and network adoption
- Monitor quarterly developments in the developer rewards mechanism and cross-chain scalability improvements to assess protocol maturation
(2) Active Trading Strategy
- Technical Analysis Tools:
- Moving Averages (20-day and 50-day): Use crossovers to identify trend reversals; currently, ARCH shows downward momentum across all timeframes
- Relative Strength Index (RSI): Monitor oversold conditions below 30 to identify potential bounce opportunities; support reversal signals with volume confirmation
- Wave Segment Operation Points:
- Current price level of $0.002263 represents a 92% decline from the all-time high of $0.28899 (reached December 24, 2023), suggesting potential capitulation and possible mean reversion opportunities
- Watch for resistance at previous support levels and monitor trading volume during recovery attempts; sustained volume above the 24-hour average of 12,082.85 units indicates genuine buyer interest
ARCH Risk Management Framework
(1) Asset Allocation Principles
- Conservative Investors: 1-2% maximum portfolio allocation to ARCH, given its high volatility and current market downturn
- Active Investors: 3-5% portfolio allocation, with systematic rebalancing triggers at 10% portfolio value changes
- Professional Investors: 5-10% allocation with hedging strategies, potentially utilizing options or inverse positions to manage directional risk
(2) Risk Hedging Solutions
- Stablecoin Reserves: Maintain 40-50% of intended ARCH position value in USDT or USDC to enable rapid redeployment during favorable entry points
- Dollar-Cost Averaging: Deploy capital in fixed monthly or quarterly tranches to reduce exposure to single-point valuation risks and smooth entry prices over extended periods
(3) Secure Storage Solutions
- Hot Wallet Recommendation: Gate.com Web3 Wallet for frequent traders requiring daily liquidity and dApp interaction capabilities within the Archway ecosystem
- Cold Storage Strategy: For positions exceeding 30% of portfolio value, utilize hardware wallet solutions with multi-signature authentication to ensure long-term security
- Security Considerations: Enable two-factor authentication on all exchange accounts, utilize whitelisted withdrawal addresses exclusively, maintain encrypted backup seed phrases in geographically dispersed secure locations, and never share private keys or recovery phrases with anyone
V. ARCH Potential Risks and Challenges
ARCH Market Risks
- Extreme Valuation Collapse: ARCH has declined 91.85% over the past year, indicating severe investor sentiment deterioration and potential liquidity challenges during panic sell-offs
- Low Trading Volume: The 24-hour trading volume of $12,082.85 is extremely limited relative to market capitalization, creating significant slippage risk and potential price manipulation vulnerabilities for large trades
- Market Concentration: Current circulating supply of 640,028,533.5 tokens represents 64% of total supply, suggesting significant dilution potential as additional tokens unlock from vesting schedules
ARCH Regulatory Risks
- Evolving Compliance Framework: Smart contract platforms face increasing regulatory scrutiny regarding developer incentive mechanisms, which could necessitate protocol modifications affecting token economics
- Jurisdiction-Specific Restrictions: Certain jurisdictions may classify ARCH as a security or restrict developer reward distributions, potentially limiting adoption in key markets and reducing dApp incentive effectiveness
- Tax Treatment Uncertainty: Developer rewards distributed through the protocol may face ambiguous tax classification, creating compliance challenges for token recipients and potentially reducing the attractiveness of building on Archway
ARCH Technical Risks
- Cross-chain Execution Risk: Scalable cross-chain dApp functionality depends on complex interoperability infrastructure, and failures in bridge mechanisms could undermine core value propositions
- Developer Adoption Uncertainty: The success of the incentive model depends entirely on attracting quality developers; if experienced developers continue gravitating toward competing platforms, the ecosystem faces stagnation
- Smart Contract Vulnerabilities: As a platform supporting third-party dApps, security breaches in deployed contracts could damage ecosystem reputation and trigger mass token liquidations
VI. Conclusions and Action Recommendations
ARCH Investment Value Assessment
Archway presents a contrarian opportunity for sophisticated investors believing in the long-term potential of developer-incentivized protocols, but current valuation metrics and extreme price weakness demand disciplined entry strategies. The 92% decline from ATH suggests either severe market misjudgment or fundamental challenges in protocol adoption and developer attraction. The extremely limited trading volume and continued negative momentum across all timeframes indicate weak institutional interest and potential capitulation selling. However, the underlying concept—democratizing developer rewards and capital access—remains structurally sound if the ecosystem successfully executes on scaling and dApp onboarding initiatives. Investment should be contingent on evidence of accelerating developer activity, increasing total value locked, and sustainable dApp-driven transaction growth.
ARCH Investment Recommendations
✅ Beginners: Start with micro-positions representing 0.5-1% of investment capital through Gate.com's spot trading platform; use this allocation to learn about developer-incentivized protocols while minimizing exposure to this high-volatility asset class. Avoid leverage trading entirely.
✅ Experienced Investors: Implement systematic dollar-cost averaging over 6-12 months with monthly purchase tranches; combine this with technical analysis indicators to scale position size during oversold conditions (RSI below 20-25). Consider 3-5% portfolio allocation maximum.
✅ Institutional Investors: Conduct deep-dive technical due diligence on the developer rewards algorithm and cross-chain architecture; negotiate OTC trades through Gate.com institutional services to minimize slippage impact; structure positions with hedging layers to manage downside exposure while maintaining upside optionality.
ARCH Trading Participation Methods
- Spot Trading: Execute direct ARCH purchases on Gate.com against USDT, USDC, or other major stablecoins; this method provides straightforward ownership with no leverage risk
- Grid Trading: Utilize Gate.com's automated grid trading feature to execute systematic buy/sell orders within defined price ranges, capturing volatility while reducing manual execution burden
- Staking and Protocol Participation: If platform availability emerges, participate in protocol staking to earn additional ARCH rewards while holding core positions; verify staking mechanics and unbonding periods before committing capital
Cryptocurrency investment carries extreme risk and volatility. This report does not constitute investment advice. Investors must conduct independent research and consult professional financial advisors before making allocation decisions. Only invest capital you can afford to lose completely. Past performance does not guarantee future results. Regulatory changes, market manipulation, and technical failures can rapidly eliminate token value.
FAQ
Is Arch a good stock to buy?
Arch shows attractive valuation metrics with strong fundamentals, making it potentially a good investment for value-focused investors. Its market performance and trading volume indicate solid market interest and liquidity potential.
What is the price target for Arch in 2025?
The price target for Arch in 2025 is $150, based on analyst consensus as of December 2025. This represents analyst expectations for the year. Forecasts may change based on market conditions and performance metrics.
Where will ACHR stock be in 5 years?
ACHR's 5-year trajectory depends on market adoption and company execution. With growing demand for innovative solutions in the crypto space, ACHR could experience significant appreciation if development milestones are achieved and market conditions remain favorable.
* The information is not intended to be and does not constitute financial advice or any other recommendation of any sort offered or endorsed by Gate.