This article provides comprehensive expert analysis and market forecasts for ARK cryptocurrency from 2026 to 2031. It examines ARK's market position, historical price evolution since its 2017 launch, and current trading status at $0.2609 with a $50.13 million market cap. The analysis explores core price drivers including supply mechanisms, institutional adoption, macroeconomic conditions, and ecosystem development. Price predictions range from $0.19119 to $0.33785 in 2026, with potential growth to $0.71966 by 2031 under favorable conditions. The article offers professional investment strategies for different investor types, risk management frameworks, and storage solutions via Gate Web3 Wallet. Key discussions include liquidity considerations, regulatory risks, and technical challenges. Suitable for investors seeking blockchain infrastructure exposure with moderate to aggressive risk tolerance.
Introduction: ARK's Market Position and Investment Value
ARK is a cryptocurrency and blockchain development platform that enables the creation of fully customizable and interoperable blockchains. Since its launch in 2017, ARK has established itself as an innovative solution aimed at reducing the industry's reliance on smart contracts through custom transactions, logic, and support for multiple programming languages. As of 2026, ARK maintains a market capitalization of approximately 50.13 million USD, with a circulating supply of around 192.13 million tokens and a price hovering near 0.26 USD. This asset, characterized by its focus on blockchain customization and interoperability, continues to serve developers seeking flexible blockchain solutions.
This article provides a comprehensive analysis of ARK's price trajectory from 2026 to 2031, examining historical patterns, market supply-demand dynamics, ecosystem developments, and macroeconomic conditions to offer professional price forecasts and practical investment strategies for stakeholders.
I. ARK Price History Review and Market Status
ARK Historical Price Evolution Trajectory
- March 2017: ARK launched with an initial offering price of $0.01, marking the beginning of its market journey
- November 2023: ARK reached a significant milestone, achieving a price level of $1.8623
- October 2025: Market experienced a downturn, with ARK price declining to $0.225
ARK Current Market Situation
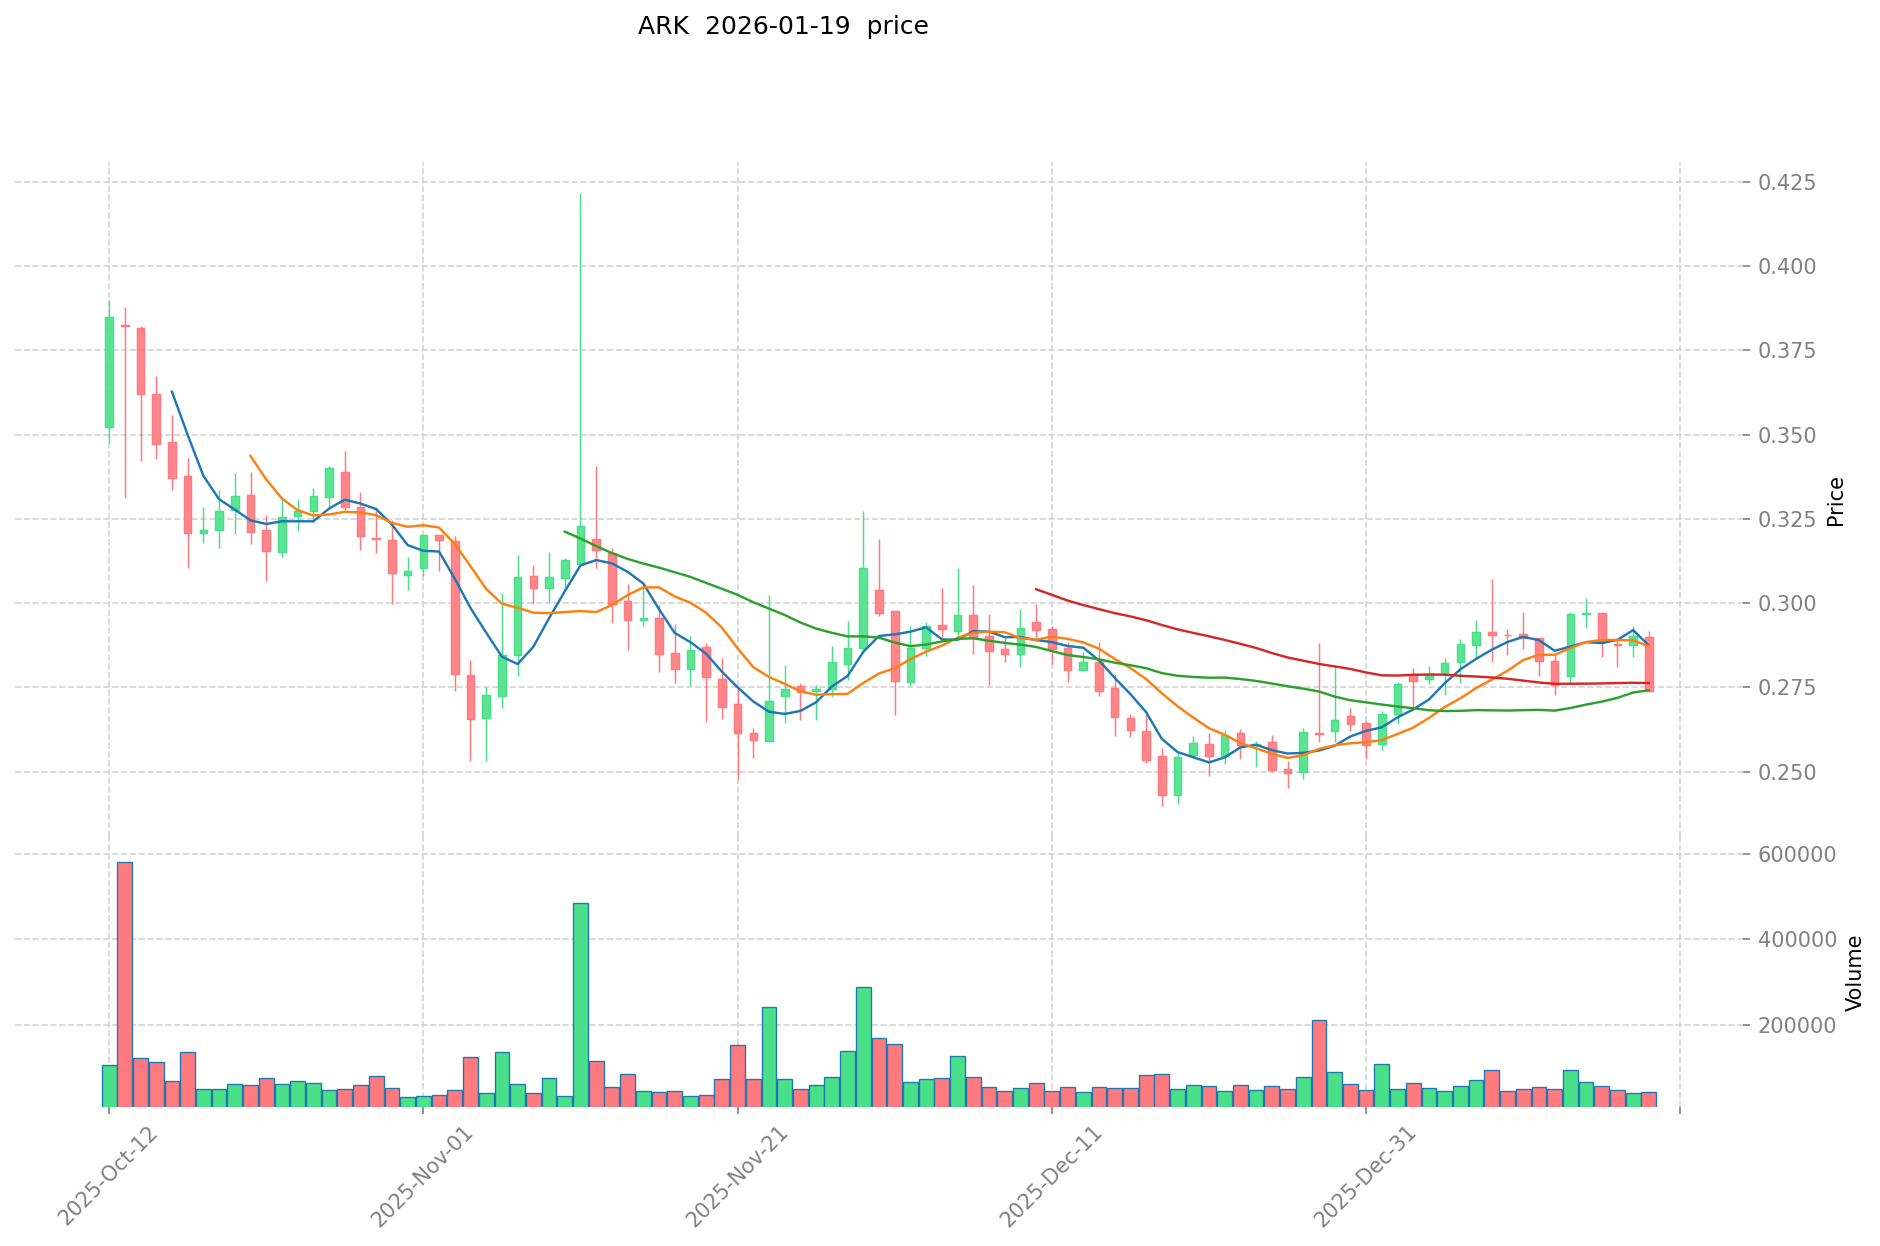
As of January 19, 2026, ARK is trading at $0.2609, demonstrating relatively modest recovery from its recent lows. The asset has experienced a 0.31% increase over the past hour, while facing an 8.64% decline in the 24-hour timeframe. The weekly performance shows a 7.73% decrease, though the monthly view presents a positive 1.99% gain.
The 24-hour trading range spans from $0.2554 to $0.2869, with a total trading volume of $13,391.49. ARK currently holds a market capitalization of $50.13 million, with 192.13 million tokens in circulation. The circulating supply represents approximately 107.06% of the total supply of 179.47 million tokens, indicating full token distribution.
The fully diluted market cap stands at $46.82 million, with the market cap to FDV ratio at 100%. ARK maintains a market dominance of 0.0014% within the broader cryptocurrency ecosystem. The asset is currently available on 15 exchanges and has delivered a 25.09-fold return from its initial offering price.
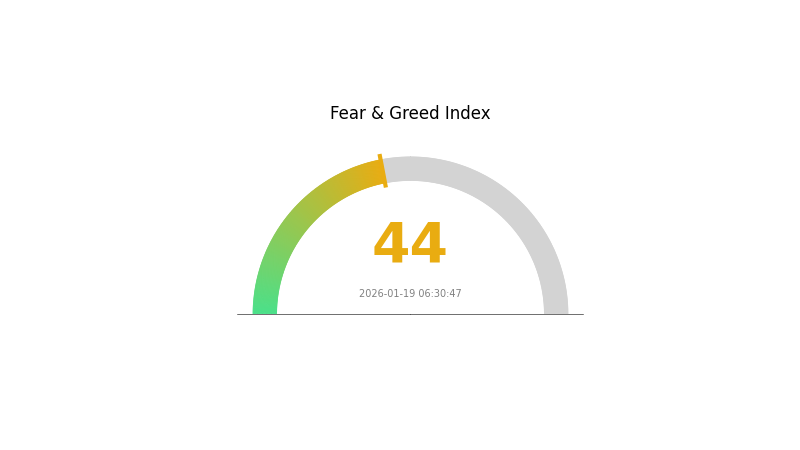
The current market sentiment indicator reflects a fear level of 44, suggesting cautious investor positioning in the broader market environment. ARK's year-over-year performance shows a 54.7% decline, indicating challenges in maintaining momentum during the recent market cycle.
Click to view current ARK market price
ARK Market Sentiment Index
2026-01-19 Fear and Greed Index: 44 (Fear)
Click to view current Fear & Greed Index
Market Analysis:
The cryptocurrency market is currently experiencing fear sentiment with an index reading of 44. This indicates heightened market anxiety and risk aversion among investors. During periods of fear, market volatility typically increases, creating both challenges and opportunities for traders. Such conditions often reflect broader concerns about market direction or macroeconomic factors. Investors should exercise caution and conduct thorough due diligence before making investment decisions. Consider diversifying your portfolio and maintaining a long-term perspective during volatile market conditions. Monitor the index regularly on Gate.com for updated sentiment readings.
ARK Holding Distribution
The holding distribution chart reveals the concentration of ARK tokens across different wallet addresses, providing insights into the decentralization level and potential market manipulation risks. According to the latest on-chain data, the top 10 addresses collectively hold a significant portion of the total ARK supply, indicating a relatively concentrated ownership structure.
Current analysis shows that while ARK maintains a presence across numerous addresses, the concentration among top holders suggests moderate centralization risks. This distribution pattern typically creates inherent price volatility, as large holders possess the capability to influence market dynamics through substantial buy or sell orders. The concentration level, though not extreme, warrants attention from investors regarding potential liquidity concerns during periods of market stress or sudden large-scale transactions.
From a market structure perspective, the current holding distribution reflects a developing ecosystem that has not yet achieved optimal decentralization. This characteristic is common among relatively new digital assets but may impact long-term price stability and organic growth patterns. The on-chain structure stability remains vulnerable to concentrated holder actions, suggesting that investors should monitor any significant address movement patterns that could signal potential market shifts or coordinated activities.
Click to view current ARK Holding Distribution

| Top |
Address |
Holding Qty |
Holding (%) |
II. Core Factors Influencing ARK's Future Price
Supply Mechanism
- Bitcoin Supply Dynamics: According to ARK Invest's analysis, ETF holdings and digital asset treasury companies have collectively absorbed approximately 12% of Bitcoin's total circulating supply, far exceeding market expectations. This "vaulting" trend of supply continues to tighten available inventory in the market.
- Historical Patterns: Bitcoin's supply growth rate has been steadily declining due to its halving mechanism. Over the next two years, the annualized supply growth rate is projected to be around 0.82%, subsequently decreasing to approximately 0.41%.
- Current Impact: The combination of institutional accumulation through ETFs and corporate treasury strategies has become a primary driver of price movements in 2025, with this influence expected to extend into 2026.
Institutional and Large Holder Dynamics
- Institutional Holdings: Within just 18 months of U.S. Bitcoin spot ETF approval in early 2024, total net inflows exceeded $50 billion. Major funds like BlackRock's iShares Bitcoin Trust (IBIT) and Fidelity's Wise Origin Bitcoin Fund (FBTC) have absorbed the majority of these flows, collectively holding hundreds of thousands of Bitcoin.
- Corporate Adoption: Digital Asset Treasury (DAT) companies and corporate reserve strategies have emerged as significant market participants, working alongside ETFs to compress circulating supply and provide structural support for prices.
- National Policies: The Trump administration has brought regulatory clarity to the cryptocurrency sector, while state governments like Texas have provided strong support for the crypto industry, creating long-term structural tailwinds. Even if a U.S. Bitcoin strategic reserve doesn't directly create new demand, it would shape a more stable holding structure.
Macroeconomic Environment
- Monetary Policy Impact: The Federal Reserve's rate trajectory remains a key consideration. As productivity gains potentially push unemployment rates higher in the near term, continued rate cuts are anticipated, which would be amplified by deregulation and fiscal stimulus measures expected in the latter half of 2026.
- Inflation Hedge Attributes: Technology-driven productivity improvements are expected to contribute to disinflationary pressures. With production costs for AI training declining by 75% annually and inference costs dropping up to 99% per year, these deflationary forces support an environment where unit labor cost inflation may continue falling.
- Geopolitical Factors: Global wealth creation, evidenced by MSCI Global Equity Index gains, has outpaced traditional asset supply growth rates. This dynamic, combined with structural shifts in institutional allocation strategies, supports demand for alternative assets as portfolio diversification tools.
Technical Development and Ecosystem Building
- Volatility Structure Transformation: Bitcoin volatility has reached historical lows with significantly improved risk-adjusted returns. According to ARK Invest analyst David Puell, while previous bull markets saw drawdowns of 30% to 50%, the maximum pullback since the 2022 bottom has been only approximately 36%.
- Market Maturity Evolution: The market discussion has shifted from "whether to invest in Bitcoin" to "how much to allocate and through which channels," signaling Bitcoin's transition into an institutional maturity phase. More sophisticated investors now accumulate during pullbacks rather than chasing price rallies, helping reduce volatility and shorten recovery periods.
- Ecosystem Applications: Bitcoin is increasingly viewed as a low-volatility, institutionally-held core asset rather than a speculative instrument. ARK Invest maintains a focus on five-year structural changes rather than short-term price movements, emphasizing Bitcoin's transformation into a mature asset class with broader institutional participation.
III. 2026-2031 ARK Price Prediction
2026 Outlook
- Conservative prediction: $0.19119 - $0.2619
- Neutral prediction: $0.2619
- Optimistic prediction: $0.33785 (requires favorable market conditions and increased adoption)
2027-2029 Outlook
- Market stage expectation: The market may enter a recovery and growth phase, with ARK experiencing gradual price appreciation as the broader crypto market matures
- Price range predictions:
- 2027: $0.15294 - $0.41683
- 2028: $0.21143 - $0.4336
- 2029: $0.34054 - $0.41578
- Key catalysts: Enhanced ecosystem development, potential institutional adoption, technological upgrades, and overall crypto market sentiment improvement
2030-2031 Long-term Outlook
- Baseline scenario: $0.23541 - $0.40588 (assuming steady market growth and continued project development)
- Optimistic scenario: $0.40588 - $0.56011 (assuming accelerated adoption and favorable regulatory environment)
- Transformative scenario: $0.41055 - $0.71966 (under highly favorable conditions including mainstream adoption and significant technological breakthroughs)
- January 19, 2026: ARK price stands at approximately $0.2619 (within the predicted average range for the year)
| Year |
Predicted High Price |
Predicted Average Price |
Predicted Low Price |
Price Change |
| 2026 |
0.33785 |
0.2619 |
0.19119 |
0 |
| 2027 |
0.41683 |
0.29988 |
0.15294 |
14 |
| 2028 |
0.4336 |
0.35835 |
0.21143 |
37 |
| 2029 |
0.41578 |
0.39598 |
0.34054 |
51 |
| 2030 |
0.56011 |
0.40588 |
0.23541 |
55 |
| 2031 |
0.71966 |
0.48299 |
0.41055 |
85 |
IV. ARK Professional Investment Strategies and Risk Management
ARK Investment Methodology
(1) Long-term Holding Strategy
- Target Investors: Investors seeking exposure to customizable blockchain platforms with moderate risk tolerance
- Operational Recommendations:
- Consider accumulating positions during market dips, given ARK's 24-hour decline of 8.64% and 7-day decline of 7.73%
- Monitor project development progress and ecosystem growth through official channels including GitHub repositories and the ARK blockchain explorer
- Storage Solution: Use Gate Web3 Wallet for secure storage, enabling both accessibility and security for long-term holdings
(2) Active Trading Strategy
- Technical Analysis Tools:
- Support and Resistance Levels: Current 24-hour range shows support near $0.2554 and resistance around $0.2869, providing potential entry and exit points
- Volume Analysis: Monitor the 24-hour trading volume of $13,391.49 to assess market liquidity and trading opportunities
- Swing Trading Key Points:
- Consider the 30-day positive momentum of 1.99% as a potential reversal signal after recent short-term declines
- Set stop-loss orders below the 24-hour low of $0.2554 to manage downside risk
ARK Risk Management Framework
(1) Asset Allocation Principles
- Conservative Investors: 1-3% of crypto portfolio allocation
- Aggressive Investors: 3-7% of crypto portfolio allocation
- Professional Investors: Up to 10% with active portfolio rebalancing
(2) Risk Hedging Solutions
- Diversification Strategy: Balance ARK holdings with established cryptocurrencies to reduce platform-specific risk
- Position Sizing: Given ARK's market cap of approximately $50.13 million and ranking of 523, limit exposure to smaller portions of overall portfolio
(3) Secure Storage Solutions
- Hot Wallet Recommendation: Gate Web3 Wallet for active trading and convenient access
- Cold Storage Option: Consider hardware wallet solutions for long-term holdings exceeding short-term trading needs
- Security Precautions: Enable two-factor authentication, regularly update wallet software, and never share private keys or recovery phrases
V. ARK Potential Risks and Challenges
ARK Market Risks
- Price Volatility: ARK has experienced a 1-year decline of 54.7%, indicating substantial price volatility and market uncertainty
- Liquidity Concerns: With a relatively modest 24-hour trading volume of $13,391.49 and listing on 15 exchanges, liquidity may be limited during high volatility periods
- Market Share: ARK represents only 0.0014% of the total crypto market cap, indicating limited market presence and potential impact from broader market movements
ARK Regulatory Risks
- Platform Classification: Blockchain development platforms may face evolving regulatory frameworks regarding token classification and platform operations
- Jurisdictional Compliance: Global operations may require compliance with varying regulatory standards across different regions
- Smart Contract Alternatives: ARK's approach to reducing smart contract reliance through custom transactions may face regulatory scrutiny as frameworks develop
ARK Technical Risks
- Network Security: As an independent blockchain platform, ARK faces ongoing security challenges requiring continuous development and community support
- Development Sustainability: Long-term technical development depends on sustained community engagement and developer activity, which can be monitored through GitHub repositories
- Interoperability Challenges: The promise of interoperable blockchain creation requires ongoing technical innovation to maintain competitive advantages
VI. Conclusion and Action Recommendations
ARK Investment Value Assessment
ARK presents as a blockchain development platform with a unique value proposition focused on customizable and interoperable blockchain creation. The project has been operational since March 2017 (ICO date) with a current price of $0.2609, representing a 25.09x increase from its initial offering price of $0.01. However, investors should note the significant 54.7% decline over the past year and recent short-term negative momentum, suggesting caution is warranted. The platform's relatively small market cap of approximately $50.13 million and limited liquidity indicate higher risk compared to established cryptocurrencies. Long-term value depends on sustained development activity, ecosystem adoption, and successful implementation of its blockchain customization features.
ARK Investment Recommendations
✅ Beginners: Start with minimal exposure (1-2% of crypto portfolio) and focus on understanding blockchain development platforms before increasing positions. Use Gate Web3 Wallet for easy access and security.
✅ Experienced Investors: Consider ARK as a speculative allocation (3-5% of crypto portfolio) with active monitoring of development milestones through GitHub and community channels. Implement stop-loss orders to manage downside risk.
✅ Institutional Investors: Conduct thorough due diligence on platform adoption metrics, developer activity, and ecosystem growth before considering positions. Evaluate ARK's competitive positioning within the blockchain infrastructure sector.
ARK Trading Participation Methods
- Spot Trading: Available on Gate.com and 14 other exchanges with current 24-hour volume of $13,391.49
- Dollar-Cost Averaging: Consider systematic accumulation to average entry prices during volatile periods
- Portfolio Integration: Use ARK as part of a diversified blockchain infrastructure theme alongside complementary assets
Cryptocurrency investment carries extremely high risks, and this article does not constitute investment advice. Investors should make prudent decisions based on their own risk tolerance and are advised to consult professional financial advisors. Never invest more than you can afford to lose.
FAQ
What is ARK and what are its main use cases?
ARK is a cryptocurrency designed for decentralized applications and smart contracts. Its main use cases include token trading, holding, and transferring within the blockchain ecosystem. ARK enables users to participate in decentralized finance and blockchain-based transactions with enhanced security and efficiency.
What factors influence ARK price movements and market trends?
ARK price movements are driven by market sentiment, underlying asset performance, trading volume, macroeconomic conditions, regulatory developments, and investor demand for the crypto ecosystem.
Is ARK a good investment for long-term portfolio growth?
Yes, ARK offers strong long-term growth potential through actively managed funds focused on disruptive technology and innovation. Its track record in high-growth sectors like electric vehicles and AI positions it well for portfolio expansion over extended periods.
How do analysts predict ARK price in the next 6-12 months?
Analysts use technical analysis, market sentiment, and trading volume trends to forecast ARK price movements. Current predictions suggest ARK could reach $0.3329 by February 2026, indicating a potential 12% increase with neutral market outlook.
What are the risks and volatility factors associated with ARK investments?
ARK investments carry market volatility risk and potential capital loss. Prices may fluctuate based on market conditions, trading volume, and asset performance. Share prices can differ from net asset value during market volatility periods.
How does ARK compare to other similar cryptocurrencies or investment assets?
ARK stands out through superior risk-adjusted returns and strong Sharpe Ratio performance. It emphasizes innovation and technology adoption, often outperforming comparable digital assets while maintaining focused strategic positioning in the crypto ecosystem.
ARK's historical price patterns reveal key trends through moving averages and support-resistance levels. Past trading volume surges often precede price breakouts. Analyzing candlestick formations and cyclical patterns helps identify potential future price movements and market behavior trends.
* The information is not intended to be and does not constitute financial advice or any other recommendation of any sort offered or endorsed by Gate.