The article offers an in-depth analysis of Permission Coin (ASK) price trends and market dynamics as of December 2025. It addresses the token's historical price evolution, current market status, and future price forecasts through 2030. The article is tailored for investors seeking insights into ASK's investment potential, influenced by macroeconomic factors and market sentiment. Key topics include market performance, blockchain integration, and investment strategies, supported by detailed metrics and analysis. Optimized for readability, it highlights ASK's unique position in transforming the entertainment economy by using blockchain technology.
Introduction: Market Position and Investment Value of ASK
Permission Coin (ASK) is a blockchain-based platform created by the Singapore Film and Television Entertainment Alliance Foundation to provide integrated services for the global entertainment industry. Since its inception, ASK has been dedicated to reshaping the entertainment economy by eliminating intermediaries and reducing friction between creators and audiences. As of December 2025, ASK maintains a market capitalization of approximately $2.61 million USD, with a circulating supply of approximately 21.96 billion tokens, trading at around $0.00011905 per token. This platform, which bridges decentralized content distribution with fan economy mechanisms, is increasingly playing a critical role in transforming how intellectual property rights are managed and monetized within the entertainment sector.
This article will provide a comprehensive analysis of ASK's price trends and market dynamics, combining historical price performance, market supply and demand dynamics, ecosystem development, and macroeconomic factors to deliver professional price forecasts and actionable investment strategies for the period ahead. By examining key technical indicators and market sentiment, we aim to equip investors with the insights needed to make informed decisions regarding their ASK holdings or potential positions.
Permission Coin (ASK) Market Analysis Report
I. ASK Price History Review and Market Current Status
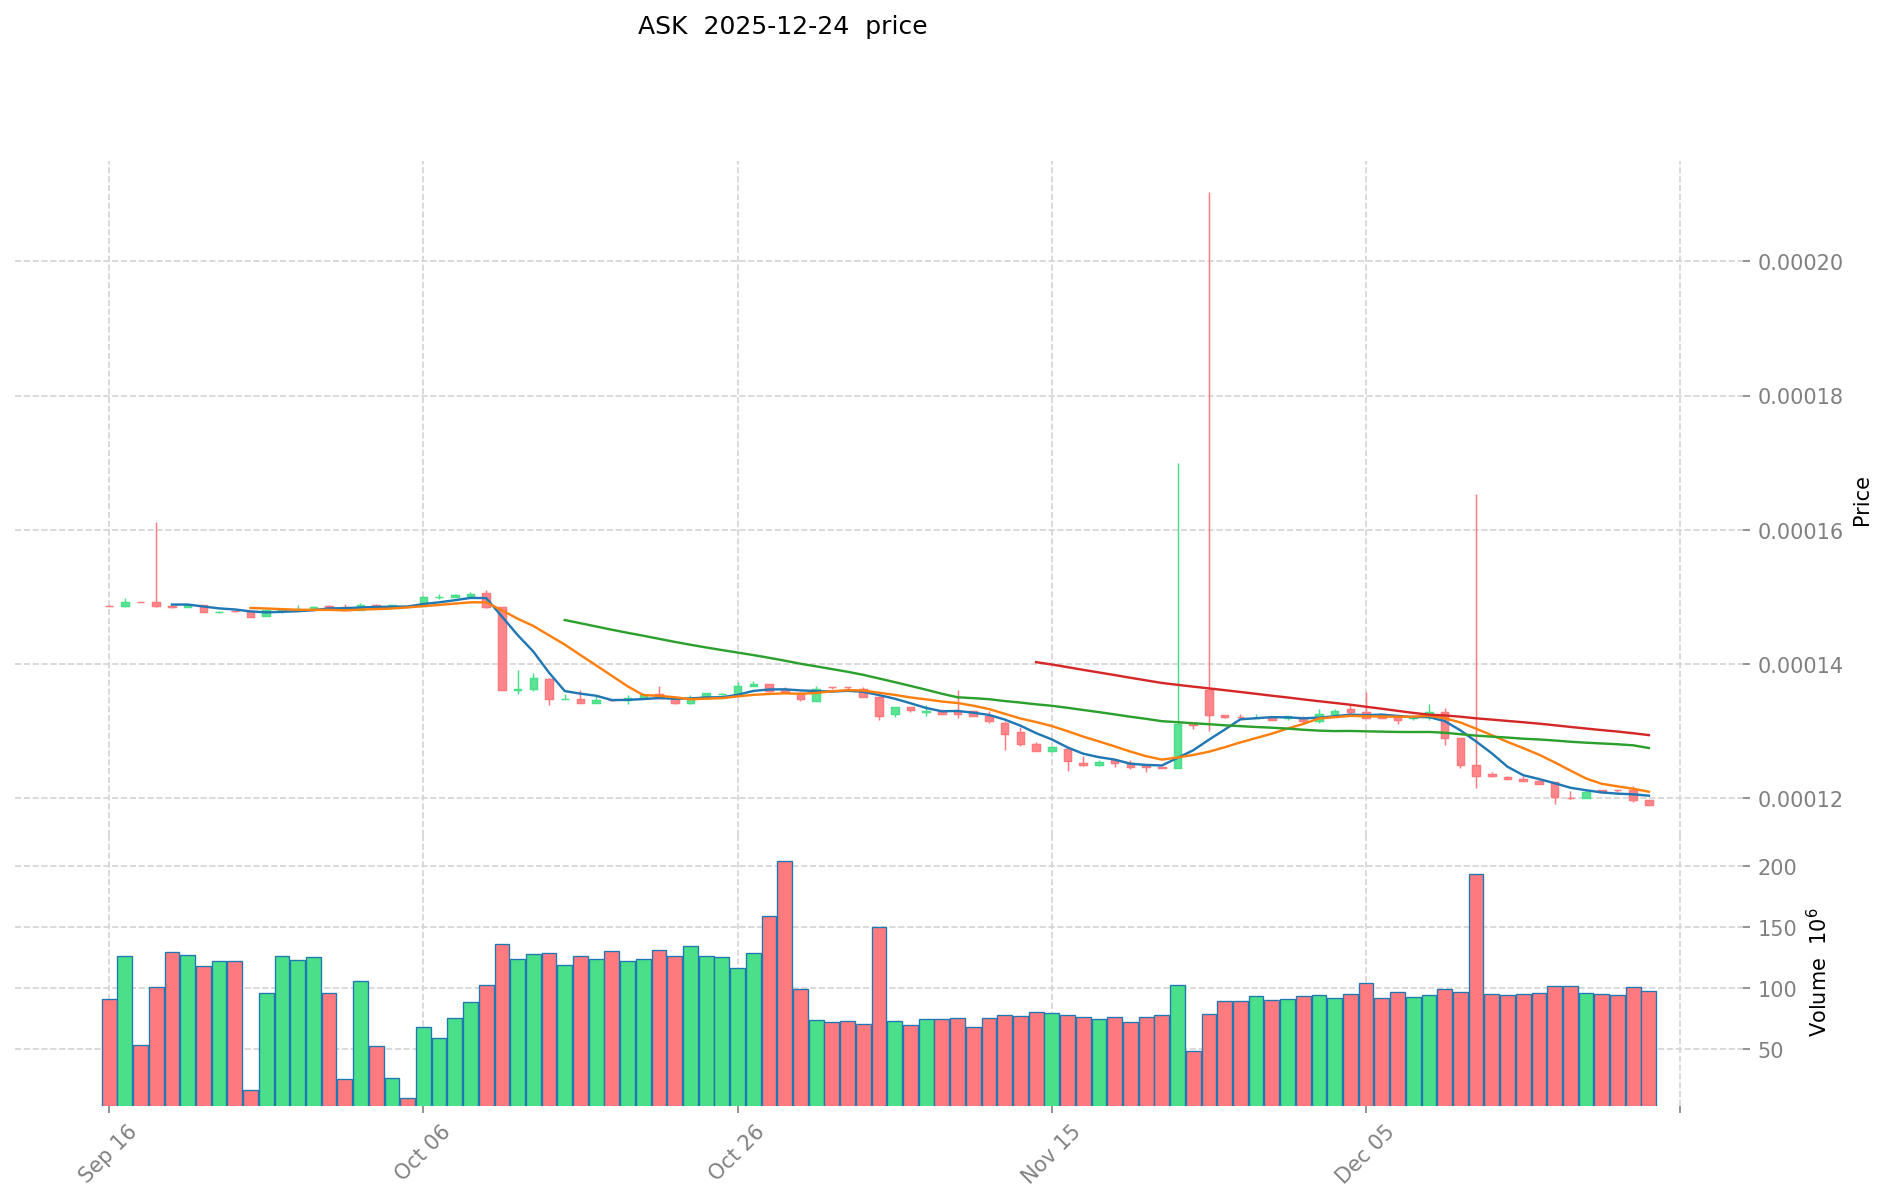
ASK Historical Price Evolution Trajectory
- 2021: ASK reached its all-time high of $0.00845153 on March 10, 2021, marking the peak of its early market cycle during the broader cryptocurrency bull run.
- 2024: ASK hit its all-time low of $0.00005915 on October 27, 2024, representing a significant decline from historical peaks.
- 2025: ASK has shown limited recovery, currently trading in the micro-cap range with minimal daily volatility.
ASK Current Market Status
As of December 25, 2025, ASK is trading at $0.00011905, with a 24-hour trading volume of $11,776.15. The token holds a market capitalization of approximately $2.61 million, ranking #1963 by market cap. With a fully diluted valuation of $11.91 million, ASK represents a micro-cap cryptocurrency project.
Price Performance Metrics:
- 1-hour change: +0.0026%
- 24-hour change: 0.00%
- 7-day change: -0.80%
- 30-day change: -9.01%
- 1-year change: -26.58%
The token has experienced sustained downward pressure over the medium to long-term, with a marked 26.58% decline over the past year. Current market conditions reflect extreme fear sentiment (VIX: 24), characteristic of broader market uncertainty.
Supply Metrics:
- Circulating supply: 21,957,027,514.51 ASK
- Maximum supply: 100,000,000,000 ASK
- Circulation ratio: 21.96%
- Token holders: 84,590
Click to view current ASK market price
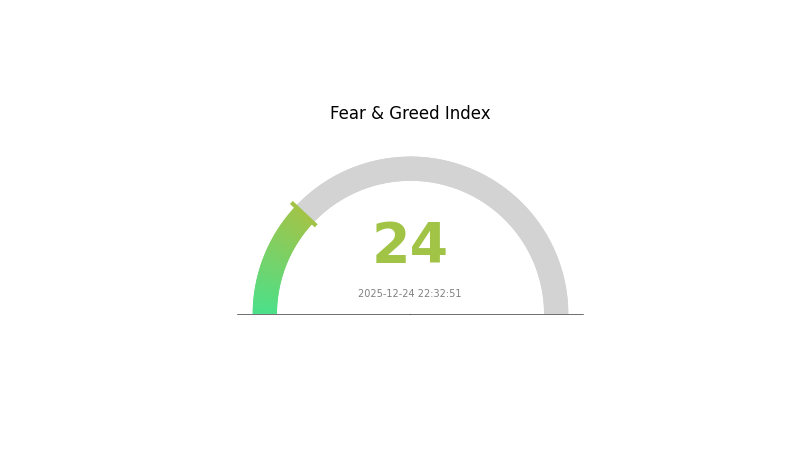
ASK Market Sentiment Indicator
2025-12-24 Fear and Greed Index: 24 (Extreme Fear)
Click to view current Fear & Greed Index
The cryptocurrency market is currently experiencing extreme fear, with the index dropping to 24. This indicates severe pessimism among investors, reflecting concerns about market volatility and potential downturns. During such periods, risk-averse traders typically reduce their positions, while contrarian investors may view this as a potential buying opportunity. Market participants should carefully assess their risk tolerance and investment strategies. Extreme fear conditions often precede market recovery, making this a critical time for portfolio review on Gate.com.
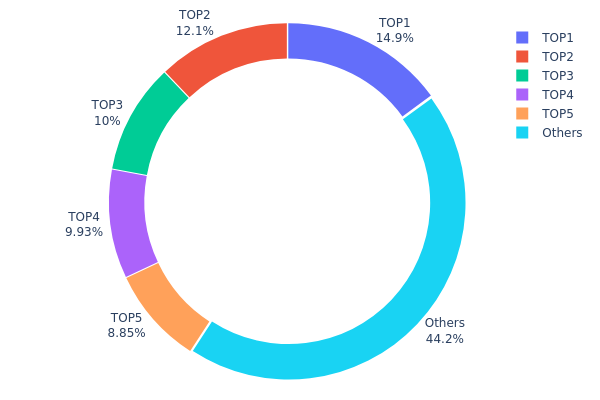
ASK Holdings Distribution
The address holdings distribution chart provides a comprehensive view of token concentration across the blockchain network by analyzing the allocation percentages held by the top addresses. This metric serves as a critical indicator of tokenomics health, market structure, and potential systemic risks within the ecosystem.
Current data reveals a moderately concentrated distribution pattern for ASK tokens. The top five addresses collectively control 55.78% of the total supply, with the largest holder commanding 14.94% and the second-largest holding 12.08%. While individual positions remain below the 15% threshold, this upper-tier concentration warrants attention. The remaining 44.22% distributed among other addresses indicates a substantial long-tail of smaller holders, suggesting that the token maintains reasonable decentralization characteristics. However, the presence of five major stakeholders controlling more than half the circulating supply indicates that significant price movements or coordinated actions by these key holders could meaningfully influence market dynamics.
The current distribution structure presents both opportunities and considerations for market participants. While the concentration is not extreme, it creates potential for price volatility if major holders execute large transactions. The substantial portion held by addresses two through five—ranging from 8.84% to 12.08%—establishes multiple centers of influence rather than a single dominant entity, which contributes to a more distributed governance model. This configuration suggests the token maintains moderate decentralization, though continued monitoring of holder behavior and potential consolidation remains prudent for assessing long-term market stability and on-chain ecosystem health.
Click to view current ASK Holdings Distribution
| Top |
Address |
Holding Qty |
Holding (%) |
| 1 |
0xf003...010c78 |
14950000.00K |
14.94% |
| 2 |
0x8994...445919 |
12083058.43K |
12.08% |
| 3 |
0x6ea9...0a2036 |
10000000.00K |
10.00% |
| 4 |
0x8d6c...0c0dbf |
9929933.54K |
9.92% |
| 5 |
0xd773...c09f21 |
8849039.54K |
8.84% |
| - |
Others |
44187968.48K |
44.22% |
II. Core Factors Affecting ASK's Future Price
Macroeconomic Environment
-
Market Demand and Supply Dynamics: Price fluctuations are significantly influenced by market demand, supply volume, and macroeconomic data. The interaction between these factors creates market volatility.
-
Policy and Economic Data Impact: Price movements are notably affected by policy changes and macroeconomic indicators. Economic data releases can trigger substantial price swings in the cryptocurrency market.
-
Market Sentiment: Technical analysis plays a crucial role in price prediction, with historical price trends providing important reference points for future movements. Market sentiment and trader positioning also drive significant price movements.
Note: The provided data sources do not contain specific information about ASK token's supply mechanisms, institutional holdings, enterprise adoption, government policies, technological developments, or ecosystem applications. To provide a comprehensive analysis of ASK's price drivers, detailed information specific to the ASK project would be required. For real-time market data and trading information, you can access Gate.com for current ASK trading pairs and market analysis tools.
III. 2025-2030 ASK Price Forecast
2025-2026 Outlook
- Conservative Prediction: $0.00009-$0.00012
- Neutral Prediction: $0.00012-$0.00014
- Optimistic Prediction: $0.00014-$0.00018 (requires sustained market recovery and increased adoption)
2027-2029 Mid-term Outlook
- Market Stage Expectation: Transition from consolidation to gradual growth phase with increasing institutional interest and ecosystem expansion
- Price Range Forecast:
- 2027: $0.0001-$0.00022
- 2028: $0.00012-$0.00023
- 2029: $0.00017-$0.00031
- Key Catalysts: Enhanced platform utility, strategic partnerships, improved liquidity on Gate.com and other major venues, positive regulatory developments, and growing community engagement
2030 Long-term Outlook
- Base Case: $0.00019-$0.00035 (assuming steady ecosystem development and moderate market expansion)
- Optimistic Case: $0.00035-$0.00045 (assuming mainstream adoption acceleration and significant protocol upgrades)
- Transformation Case: $0.00045+ (extreme favorable conditions including disruptive technological breakthroughs, massive user base expansion, and transformative market cycle dynamics)
- 2030-12-31: ASK targets $0.00035 (achieving 115% cumulative gains from 2025 baseline)
| 年份 |
预测最高价 |
预测平均价格 |
预测最低价 |
涨跌幅 |
| 2025 |
0.00014 |
0.00012 |
0.00009 |
0 |
| 2026 |
0.00018 |
0.00013 |
0.00008 |
8 |
| 2027 |
0.00022 |
0.00015 |
0.0001 |
29 |
| 2028 |
0.00023 |
0.00019 |
0.00012 |
56 |
| 2029 |
0.00031 |
0.00021 |
0.00017 |
73 |
| 2030 |
0.00035 |
0.00026 |
0.00019 |
115 |
Permission Coin (ASK) Professional Investment Report
I. Project Overview
Project Introduction
Permission Coin (ASK - Art Saintlya of King) is a blockchain-based platform developed by the Singapore Film and Television Entertainment Alliance Foundation. The project aims to provide integrated services for film and television entertainment globally.
Core Mission
ASK addresses critical inefficiencies in the entertainment industry, including:
- Lack of transparency in content distribution channels
- Excessive intermediaries reducing creator earnings
- Difficulty in IP content protection and rights management
- High transaction costs between creators and consumers
By leveraging blockchain technology, ASK aims to:
- Eliminate intermediaries through decentralized content distribution
- Reduce transaction costs between celebrities and fans
- Create a tokenized economic system connecting industry stakeholders
- Ensure traceability and quality assurance through on-chain data
Business Model
ASK operates as a fan economy and multicultural entertainment platform that:
- Integrates Internet and mobile Internet across multiple domains
- Uses IP as its core asset
- Enables cross-platform content derivation
- Implements token-based economic incentives
Current Market Metrics (As of December 25, 2025)
| Metric |
Value |
| Current Price |
$0.00011905 |
| 24H Volume |
$11,776.15 |
| Total Market Cap |
$11,905,000 |
| Circulating Market Cap |
$2,613,984.13 |
| Circulating Supply |
21,957,027,514.51 tokens |
| Total Supply |
100,000,000,000 tokens |
| Circulation Ratio |
21.96% |
| Token Holders |
84,590 |
| Market Ranking |
1,963 |
| Market Dominance |
0.00037% |
Price Performance History
| Timeframe |
Change |
Value |
| 1 Hour |
+0.0026% |
+$0.000000003 |
| 24 Hours |
0% |
No change |
| 7 Days |
-0.80% |
-$0.000000960 |
| 30 Days |
-9.01% |
-$0.000011789 |
| 1 Year |
-26.58% |
-$0.000043099 |
| All-Time High |
$0.00845153 |
March 10, 2021 |
| All-Time Low |
$0.00005915 |
October 27, 2024 |
Price Volatility Assessment
ASK demonstrates moderate price volatility with recent consolidation trends. The token is currently trading significantly below its all-time high, representing a 98.59% decrease from peak valuation. The 1-year decline of -26.58% indicates prolonged bearish pressure, though short-term metrics show stabilization.
III. Blockchain Integration & Technology
Network Infrastructure
- Blockchain Network: Polygon (MATIC)
- Contract Address: 0xaA3717090CDDc9B227e49d0D84A28aC0a996e6Ff
- Network Type: Layer 2 scaling solution
Technology Features
ASK leverages Polygon's infrastructure to:
- Reduce transaction costs
- Improve transaction speed
- Enable scalable entertainment transactions
- Support decentralized content distribution
IV. ASK Professional Investment Strategy and Risk Management
ASK Investment Methodology
(1) Long-Term Holding Strategy
Suitable for:
- Entertainment industry believers with long investment horizons (3-5+ years)
- Investors committed to blockchain-based content platforms
- Strategic stakeholders in decentralized entertainment ecosystems
Operational Recommendations:
- Dollar-cost averaging (DCA) approach to mitigate price volatility
- Regular position building during market downturns
- Participation in community governance opportunities
Storage Solutions:
- Use Gate.com Web3 Wallet for secure token storage with easy trading accessibility
- Maintain backup security keys in offline storage
- Enable multi-factor authentication on all associated accounts
(2) Active Trading Strategy
Price Action Monitoring:
- Track support levels around $0.00005915 (all-time low) for potential rebounds
- Monitor resistance at previous highs for profit-taking opportunities
- Observe trading volume patterns relative to the 24-hour average ($11,776)
Wave Trading Key Points:
- Capitalize on 7-day and 30-day downtrends for potential reversal positions
- Scale positions based on volatility compression patterns
- Set stop-losses at 15-20% below entry points to manage downside risk
ASK Risk Management Framework
(1) Asset Allocation Principles
- Conservative Investors: 0.5-1.5% of portfolio allocation (minimal exposure to high-volatility tokens)
- Active Investors: 1.5-3% of portfolio allocation (moderate speculative positions)
- Professional Investors: 3-5% of portfolio allocation (tactical allocation based on fundamental thesis)
(2) Risk Hedging Strategies
- Portfolio Diversification: Balance ASK holdings with established cryptocurrencies and stablecoins
- Position Sizing: Limit individual position size to manageable risk levels relative to total portfolio
(3) Secure Storage Solutions
- Web3 Wallet Recommendation: Gate.com Web3 Wallet provides integrated trading, storage, and security features
- Self-Custody Method: For larger holdings, implement hardware wallet backup protocols with secure key management
- Security Considerations: Never share private keys, enable all available security features, regularly audit wallet activity
V. ASK Potential Risks and Challenges
Market Risk
- Liquidity Risk: With 24-hour volume of only $11,776, the token faces significant liquidity constraints, potentially causing price slippage on larger trades
- Extreme Valuation Decline: The token has lost 98.59% from its all-time high, indicating severe market pessimism or project challenges
- Low Trading Activity: Minimal trading volume suggests weak investor confidence and difficulty exiting positions
Regulatory Risk
- Geographic Compliance: As an entertainment-focused platform, ASK faces potential regulatory scrutiny regarding content rights, creator compensation, and consumer protection
- Cryptocurrency Regulations: Evolving global regulations on digital assets and tokenomics may impact ASK's operational model
- IP and Licensing Concerns: Entertainment industry regulations regarding intellectual property protection vary significantly across jurisdictions
Technology Risk
- Platform Adoption: The project must overcome significant barriers to achieve meaningful penetration in the entertainment industry
- Smart Contract Vulnerabilities: Although deployed on established Polygon network, token contract updates or ecosystem changes could pose risks
- Competitive Pressures: Existing entertainment platforms have established network effects and user bases that may be difficult to disrupt
VI. Conclusion and Action Recommendations
ASK Investment Value Assessment
Permission Coin represents a highly speculative opportunity in the blockchain-based entertainment sector. While the project addresses legitimate inefficiencies in entertainment distribution, the token's 98.59% decline from all-time highs, minimal trading volume ($11,776 daily), and low market capitalization indicate significant headwinds. The project is at an early commercialization stage with unproven adoption metrics. Investors must recognize that this represents an extremely high-risk investment appropriate only for those with substantial risk tolerance and resources.
ASK Investment Recommendations
✅ Beginners: Avoid direct investment or allocate only negligible amounts (0.1-0.5% of portfolio) as educational exposure only. Focus on understanding the underlying entertainment platform thesis before committing capital.
✅ Experienced Investors: Consider maximum 1-2% tactical allocation if fundamental thesis on decentralized entertainment resonates with your long-term portfolio strategy. Implement strict stop-losses and diversification protocols.
✅ Institutional Investors: Conduct deep-dive analysis of project fundamentals, development progress, and adoption metrics before consideration. This token's market profile and liquidity characteristics may not meet institutional investment thresholds.
ASK Trading Participation Methods
- Gate.com Spot Trading: Direct purchase and sale of ASK tokens with real-time pricing and secure order execution
- Dollar-Cost Averaging: Regular small purchases over extended periods to reduce timing risk and average entry price
- Liquidity Monitoring: Track volume patterns and market depth before executing larger transactions to minimize slippage
CRITICAL DISCLAIMER: Cryptocurrency investments carry extreme risk of total capital loss. This report is educational analysis only and does NOT constitute investment advice. Investors must conduct independent research, understand token economics, assess regulatory environments, and consult qualified financial advisors before making any investment decisions. Never invest more than you can afford to lose completely. Past price performance does not guarantee future results. The extreme volatility and early-stage nature of this project warrant extreme caution.
FAQ
Is ask price buy or sell?
The ask price is the price at which you can sell an asset. To buy, you use the bid price instead.
How much is ask worth?
ASK (Permission Coin) is currently valued at approximately $0.0001190 USD. The token's price fluctuates based on market demand and trading activity. For real-time pricing and the latest market data, check major cryptocurrency tracking platforms.
What factors influence ask price movements and how can they be predicted?
Ask price movements are driven by supply and demand dynamics, market sentiment, and trading volume. Predict them by analyzing order book depth, historical price trends, and market indicators like volatility and liquidity patterns.
What is the difference between ask price and bid price in trading?
The bid price is the highest price a buyer is willing to pay for an asset. The ask price is the lowest price a seller is willing to accept. The difference between them is called the spread, which represents the transaction cost in trading.
How do traders use ask price data to make price predictions?
Traders analyze ask price data to identify bid-ask imbalances and market sentiment shifts. Significant ask price movements reveal supply pressure, helping predict potential price direction and volatility changes in the market.
* The information is not intended to be and does not constitute financial advice or any other recommendation of any sort offered or endorsed by Gate.