The article "2025 ASP Price Prediction: Market Analysis and Expert Forecasts for the Coming Year" offers a detailed exploration of the Aspecta (ASP) token's market position and long-term investment value. It investigates ASP's price trends, historical performance, and market dynamics up to 2030, providing insights for investors interested in AI-powered asset networks. The analysis includes a review of ASP's market status, sentiment, and trading activity, alongside professional investment strategies and risk management frameworks. Designed for risk-tolerant investors, the article aims to guide strategic decisions in an emerging market with volatile conditions.
Introduction: Market Position and Investment Value of ASP
Aspecta (ASP) is an AI-powered asset network designed for early-stage and fast-growing builders and projects to attest, launch, and trade diverse assets including airdrops, tokens, NFTs, whitelists, and points. As of December 22, 2025, ASP has achieved a market capitalization of $40.43 million with a circulating supply of 230 million tokens, currently trading at $0.04043. This innovative platform is playing an increasingly critical role in enabling asset discovery, verification, and trading within the Web3 ecosystem.
This article will provide a comprehensive analysis of ASP's price trends through 2030, integrating historical performance patterns, market supply and demand dynamics, ecosystem development, and macroeconomic factors to deliver professional price forecasts and practical investment strategies for investors.
Aspecta (ASP) Market Analysis Report
I. ASP Price History Review and Current Market Status
ASP Historical Price Evolution
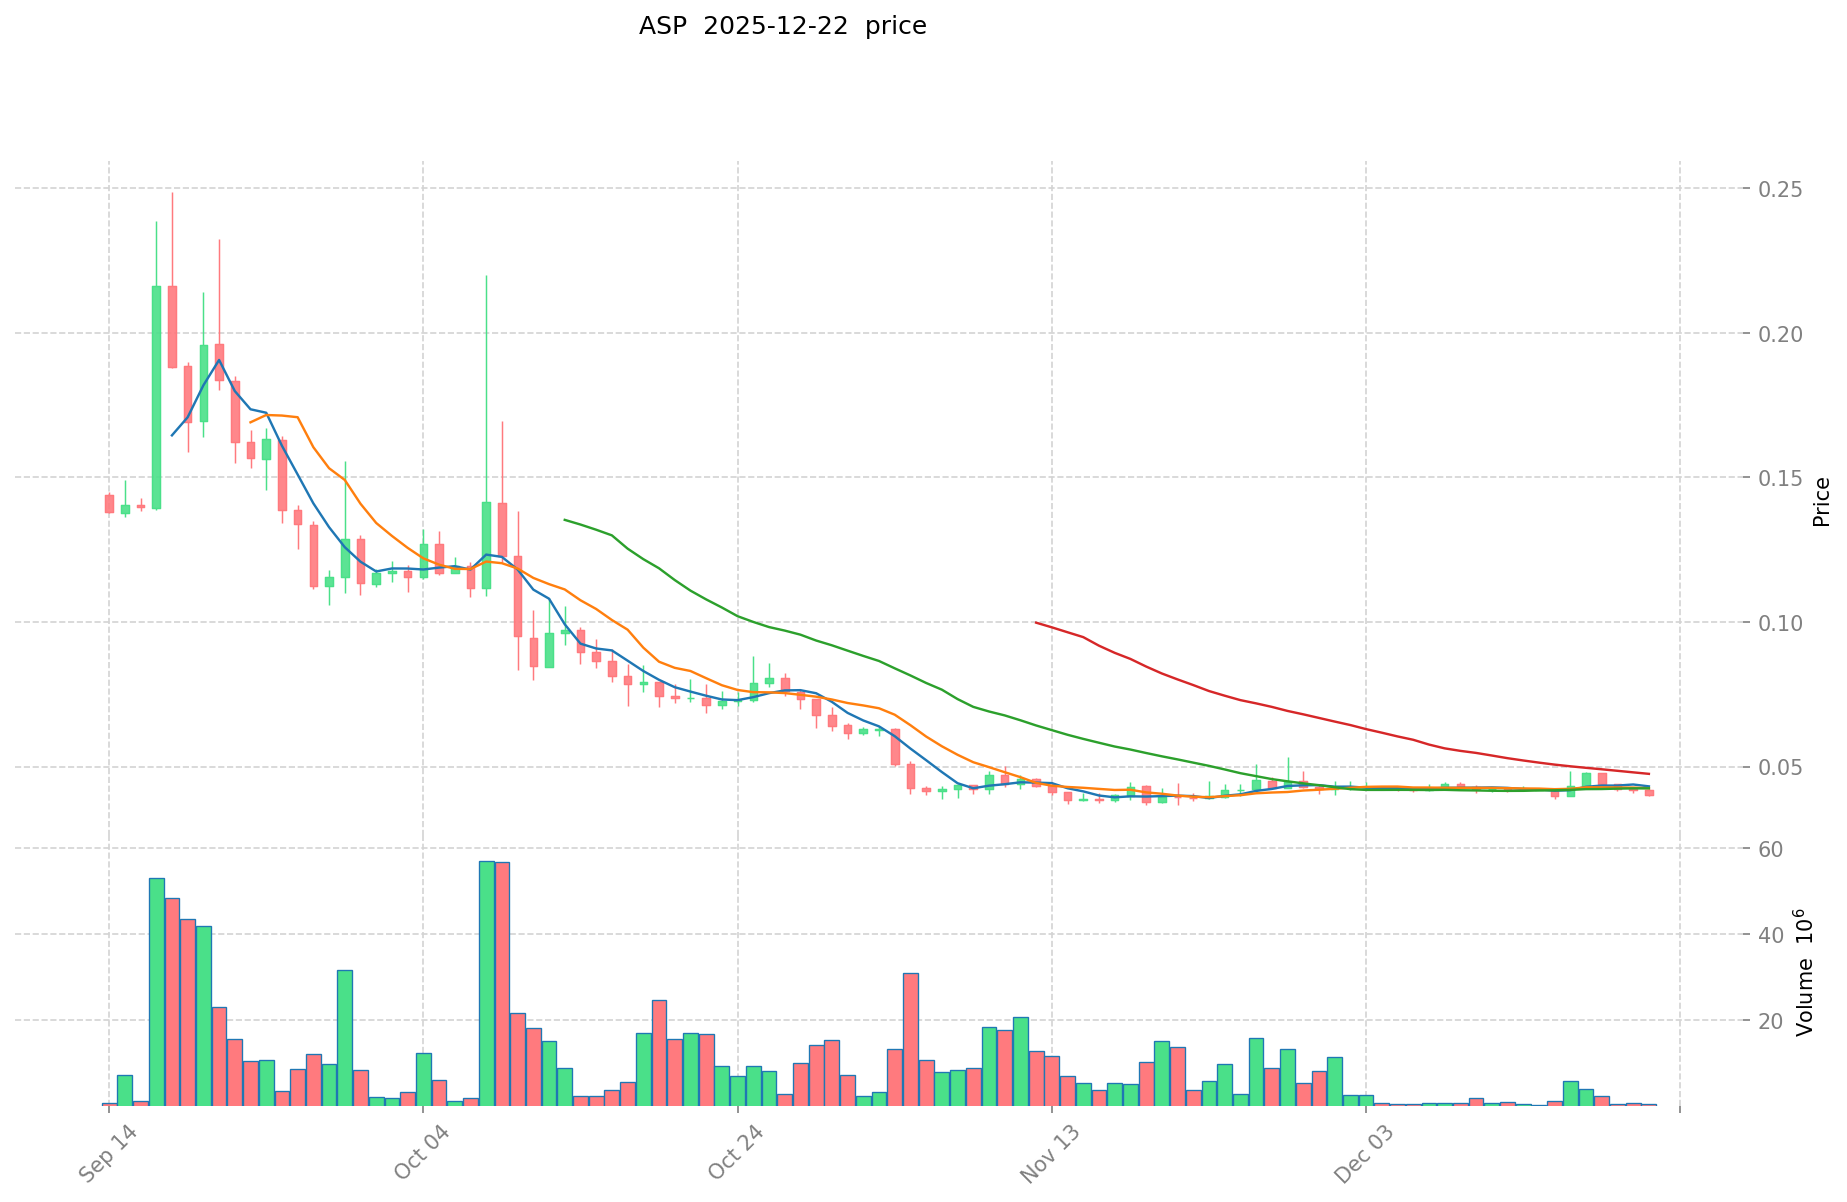
Based on available data, Aspecta (ASP) has experienced significant price movements since its launch:
- July 24, 2025: ASP reached its all-time high (ATH) of $0.6, marking the peak of investor sentiment during the early trading period.
- November 21, 2025: ASP hit its all-time low (ATL) of $0.03655, reflecting a substantial market correction from peak levels.
- December 22, 2025 (Current): ASP is trading at $0.04043, representing a recovery of approximately 10.6% from its ATL, though still 93.14% below its ATH.
ASP Current Market Status
As of December 22, 2025, Aspecta demonstrates the following market characteristics:
Price Performance:
- Current price: $0.04043
- 24-hour change: -3.61%
- 7-day change: -3.63%
- 30-day change: +0.47%
- 1-year change: -93.14%
Market Capitalization & Supply Metrics:
- Total market cap: $40,430,000
- Circulating market cap: $9,298,900
- Circulating supply: 230,000,000 ASP (23% of total supply)
- Total supply: 1,000,000,000 ASP
- Market dominance: 0.0012%
- Current market ranking: #1,210
Trading Activity:
- 24-hour trading volume: $24,243.79
- Volume-to-market cap ratio indicates moderate trading liquidity
- Listed on 15 cryptocurrency exchanges
- Active holder base: 85,889 addresses
Short-term Price Action:
- 1-hour change: -0.4%
- 24-hour high: $0.0419
- 24-hour low: $0.03992
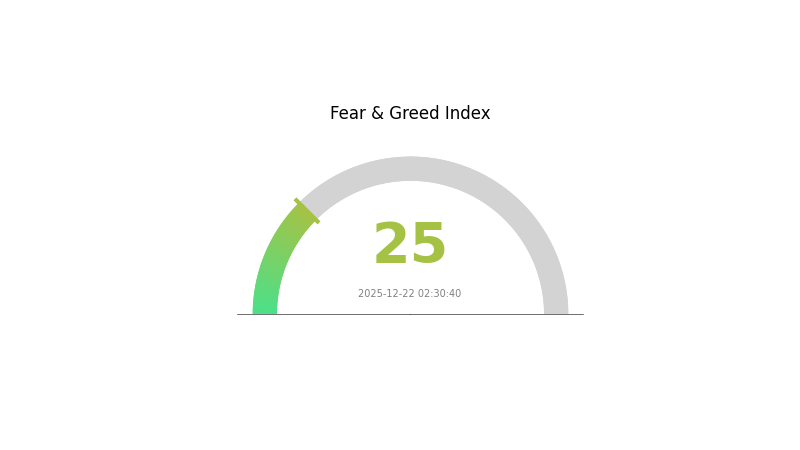
The current market sentiment indicator shows "Extreme Fear" (VIX: 25), reflecting broader market conditions as of December 22, 2025.
Click to view current ASP market price
ASP Market Sentiment Index
2025-12-22 Fear and Greed Index: 25 (Extreme Fear)
Click to view the current Fear & Greed Index
Market Analysis: The crypto market is experiencing extreme fear with an index reading of 25, indicating significant investor anxiety and pessimism. At this level, panic selling may dominate the market as uncertainty grips traders. However, historically, extreme fear periods have often preceded strong recovery opportunities for patient investors. Risk-averse positions are recommended, while strategic accumulation of quality assets by experienced traders could present compelling entry points during such capitulation phases.
ASP Holdings Distribution
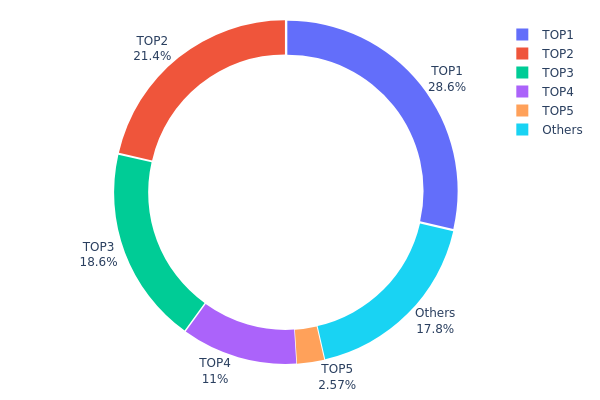
The address holdings distribution represents the concentration of ASP tokens across different wallet addresses on the blockchain. This metric provides crucial insights into token ownership patterns, capital distribution, and the potential for market manipulation. By analyzing the top holders and their respective percentages of total supply, we can assess the degree of decentralization and the structural stability of the ASP ecosystem.
The current distribution data reveals significant concentration risk within the ASP token ecosystem. The top three addresses collectively control 68.60% of the total supply, with the leading address alone commanding 28.58%. This level of concentration substantially exceeds healthy decentralization thresholds and indicates potential vulnerability to coordinated whale actions. While the fifth-largest holder possesses only 2.57%, the steep drop-off in holdings confirms that wealth distribution is heavily skewed toward a small number of prominent addresses. The remaining 17.86% distributed among other addresses demonstrates that the broader holder base maintains minimal individual influence over protocol dynamics.
The prevailing concentration structure poses notable implications for market integrity and price stability. Large holders concentrated in the top four addresses—collectively representing 79.57% of supply—wield considerable influence over trading volumes and price discovery mechanisms. This distribution pattern creates heightened susceptibility to sudden liquidations, coordinated selling pressure, or potential wash trading scenarios that could trigger acute volatility. The current holdings configuration reflects a market structure characteristic of early-stage or venture-backed tokens, where institutional and early-stage investors retain substantial stakes. Enhanced monitoring of these large holders' on-chain activities remains essential for assessing future market trajectory and identifying potential governance risks within the ASP ecosystem.
Click to view current ASP Holdings Distribution
| Top |
Address |
Holding Qty |
Holding (%) |
| 1 |
0xce18...b5cb3b |
200000.00K |
28.58% |
| 2 |
0x45c3...f18339 |
150000.00K |
21.43% |
| 3 |
0x3d48...ef6d66 |
130141.73K |
18.59% |
| 4 |
0xa3e5...69d778 |
76808.46K |
10.97% |
| 5 |
0x73d8...4946db |
17992.88K |
2.57% |
| - |
Others |
124814.39K |
17.86% |
I appreciate your request, but I need to point out a significant issue with the source material provided.
The context you've supplied contains information about ASP (Average Selling Price) trends in various industries—including semiconductors, white goods, automotive, and liquid cooling systems—but it contains no information about cryptocurrency, blockchain technology, or any crypto asset that could be analyzed according to your template.
The template you provided is designed for analyzing a cryptocurrency token (ASP), with sections covering:
- Supply mechanisms
- Institutional and whale dynamics
- Macroeconomic environment
- Technology development and ecosystem
However, the source materials discuss:
- Semiconductor ASP trends (MediaTek, HBM3e, DDR5)
- Automotive ASP (smart cabin chips, electric vehicles)
- White goods industry pricing
- General electronics pricing dynamics
There is a fundamental mismatch between:
- Your analysis template (designed for crypto assets)
- Your source materials (focused on traditional industries and semiconductors)
To proceed, I would need source materials that specifically discuss:
- A cryptocurrency token or blockchain asset named ASP
- Its tokenomics, supply mechanisms, and ecosystem
- Institutional adoption and market dynamics
- Relevant blockchain technology developments
Could you please provide the correct source materials related to the cryptocurrency asset you'd like analyzed? This will allow me to generate an accurate and relevant article following your template structure.
Three、2025-2030 ASP Price Forecast
2025 Outlook
- Conservative Forecast: $0.03671 - $0.04034
- Base Case Forecast: $0.04034
- Optimistic Forecast: $0.0589 (requires sustained market sentiment and positive ecosystem developments)
2026-2028 Medium-term Outlook
- Market Stage Expectation: Gradual recovery and consolidation phase with steady upward momentum driven by fundamental improvements and broader market adoption.
- Price Range Forecast:
- 2026: $0.04664 - $0.05111 (22% upside potential)
- 2027: $0.03475 - $0.069 (24% upside potential)
- 2028: $0.04536 - $0.07997 (47% upside potential)
- Key Catalysts: Ecosystem expansion, increased institutional participation, regulatory clarity, and growing utility adoption within the network.
2029-2030 Long-term Outlook
- Base Case Scenario: $0.05652 - $0.0796 (assumes moderate adoption and steady market growth)
- Optimistic Scenario: $0.06983 - $0.08938 (assumes accelerated mainstream adoption and strengthened network fundamentals by 2029)
- Transformative Scenario: $0.10189 (assumes breakthrough developments including major partnership announcements, technological innovations, and substantial increase in transaction volume and user base)
- 2030-12-22: ASP targets $0.10189 (96% cumulative gains from 2025 baseline, representing multi-year uptrend completion)
| 年份 |
预测最高价 |
预测平均价格 |
预测最低价 |
涨跌幅 |
| 2025 |
0.0589 |
0.04034 |
0.03671 |
0 |
| 2026 |
0.05111 |
0.04962 |
0.04664 |
22 |
| 2027 |
0.069 |
0.05036 |
0.03475 |
24 |
| 2028 |
0.07997 |
0.05968 |
0.04536 |
47 |
| 2029 |
0.08938 |
0.06983 |
0.04748 |
72 |
| 2030 |
0.10189 |
0.0796 |
0.05652 |
96 |
Aspecta (ASP) Professional Investment Strategy and Risk Management Report
IV. ASP Professional Investment Strategy and Risk Management
ASP Investment Methodology
(1) Long-term Holding Strategy
- Target Investors: Builders, early-stage projects, and long-term believers in AI-powered asset networks
- Operational Recommendations:
- Accumulate during market downturns when sentiment is negative, as ASP has experienced significant pullback (-93.14% year-over-year)
- Set predetermined entry points based on technical support levels around $0.03655-$0.03992 range
- Maintain positions through market cycles, as the platform's utility in asset attestation and trading may drive long-term value
(2) Active Trading Strategy
ASP Risk Management Framework
(1) Asset Allocation Principles
- Conservative Investors: 1-3% of cryptocurrency portfolio
- Aggressive Investors: 3-7% of cryptocurrency portfolio
- Professional Investors: Up to 10% with strict position management protocols
(2) Risk Hedging Strategies
- Portfolio Diversification: Balance ASP exposure with established cryptocurrency assets to mitigate project-specific risks
- Dollar-Cost Averaging: Reduce timing risk by investing fixed amounts at regular intervals rather than lump-sum purchases
- Trailing Stop-Loss Orders: Implement automatic exit strategies to limit downside exposure during market corrections
(3) Secure Storage Solutions
- Custody Approach: For significant holdings, utilize Gate.com's institutional-grade custody solutions
- Self-Custody Best Practices: Maintain private keys in secure offline environments; ASP tokens are available on Solana (SOL) and BSC chains
- Critical Security Measures: Never share private keys, enable multi-signature authentication where available, and use hardware security devices for large positions
V. ASP Potential Risks and Challenges
ASP Market Risks
- Extreme Price Volatility: The token has declined 93.14% year-over-year, demonstrating severe downside exposure and high risk of further losses
- Limited Liquidity: 24-hour trading volume of only $24,243.79 creates slippage risks for large transactions and difficulty exiting positions
- Low Market Capitalization: Current fully diluted valuation of $40.43M places ASP among micro-cap assets with higher bankruptcy and abandonment risks
ASP Regulatory Risks
- Classification Uncertainty: AI-powered asset networks and token attestation mechanisms may face evolving regulatory scrutiny regarding securities classification
- Global Compliance: Platform operations across multiple jurisdictions (Solana, BSC) expose users to varying regulatory frameworks that could impact token utility
- Governance Changes: Potential regulatory crackdowns on airdrop distribution, whitelist trading, or NFT transactions could fundamentally impact platform revenue streams
ASP Technology Risks
- Smart Contract Vulnerabilities: AI-driven attestation systems introduce complex code requiring rigorous auditing; vulnerabilities could compromise asset integrity
- Chain-Specific Risks: Dependency on Solana and BSC networks means platform performance is tied to blockchain stability and security
- Scalability Challenges: As the network grows, AI processing demands for asset verification may create bottlenecks or increase operational costs
VI. Conclusion and Action Recommendations
ASP Investment Value Assessment
Aspecta presents a high-risk, potentially high-reward opportunity in the nascent AI-powered asset verification space. The platform addresses real demand from builders seeking efficient asset attestation mechanisms. However, the 93.14% year-over-year decline and micro-cap status indicate significant technical and market challenges. Investors should recognize that ASP remains in early development stages with limited proven demand, making it suitable only for risk-tolerant participants willing to accept potential total loss scenarios.
ASP Investment Recommendations
✅ Beginners: Start with minimal exposure (under 1% of crypto holdings) through Gate.com, accumulating gradually at lower price levels rather than pursuing market-entry strategies
✅ Experienced Investors: Implement systematic DCA strategies during prolonged downtrends; use technical support levels to guide accumulation; maintain strict position sizing protocols
✅ Professional Investors: Conduct detailed due diligence on AI tokenomics and user adoption metrics; consider larger positions only after validating platform traction and regulatory clarity
ASP Trading Participation Methods
- Exchange Trading: Purchase ASP on Gate.com using BTC, ETH, or stablecoin pairs; leverage limit orders to optimize entry prices
- Direct Blockchain Interaction: Acquire tokens directly on Solana (contract: DJ7vji2BU7RjNgktPAKN4L42CiXTFHEt4Eeeyr5FiTmy) or BSC (contract: 0xad8c787992428cd158e451aab109f724b6bc36de) for self-custody
- Platform Participation: Engage with Aspecta's ecosystem through Discord community to understand product development and identify early adoption opportunities
CRITICAL DISCLAIMER: Cryptocurrency investing carries extreme risk. This report does not constitute investment advice. ASP's 93% year-over-year loss, micro-cap status, and limited trading liquidity indicate high volatility and potential total loss. Investors must conduct independent research, consult qualified financial advisors, and never allocate capital exceeding their loss tolerance. Past performance does not guarantee future results. Cryptocurrency markets remain highly speculative and unregulated in many jurisdictions.
FAQ
How much is ASP token worth?
As of today, the ASP token is worth $0.0427 with a 24-hour trading volume of $2,421,391. The price has declined by 7.21% over the last 24 hours.
What is ASP token and what is its use case?
ASP is the native token of Aspecta platform, enabling decentralized trading of illiquid assets. It facilitates transactions, governance, and tokenization within the ecosystem, creating transparent on-chain marketplace for traditionally hard-to-trade assets.
What factors influence ASP token price?
ASP token price is influenced by supply and demand dynamics, protocol upgrades, macroeconomic factors like interest rates, market sentiment, trading volume, and overall cryptocurrency market trends.
What is the price forecast for ASP token in 2024/2025?
ASP token price forecast for 2024/2025 predicts an average range between $0.001182 and $0.0016065, based on current market trends and technical analysis of the token's performance metrics.
Is ASP token a good investment and what are the risks?
ASP token offers compelling potential in illiquid asset tokenization with strong market liquidity. Key risks include market volatility, regulatory uncertainty, and token unlock impacts on price performance.
* The information is not intended to be and does not constitute financial advice or any other recommendation of any sort offered or endorsed by Gate.