This comprehensive analysis examines Aethir (ATH) price dynamics from 2026 to 2031, combining historical patterns and market fundamentals to deliver professional forecasts. Currently trading at $0.01013 with $168 million market cap, ATH serves as a decentralized GPU infrastructure platform for AI and cloud computing, capitalizing on 67% annual growth in AI computing demand. The article presents three-tier predictions: conservative ($0.00597-$0.01012), neutral ($0.01012), and optimistic ($0.01286) for 2026, with potential 52% growth by 2031 under favorable conditions. Strategic recommendations address diverse investor profiles through dollar-cost averaging, technical analysis tools, and risk management frameworks, while emphasizing security storage via Gate Web3 Wallet. Essential considerations include tokenomics concentration, regulatory uncertainties, and competition risks requiring careful due diligence before investment.
Introduction: ATH's Market Position and Investment Value
Aethir (ATH), as a decentralized cloud computing infrastructure platform revolutionizing enterprise-grade GPU resource distribution, has been actively developing its ecosystem since its launch. As of 2026, Aethir maintains a market capitalization of approximately $168 million, with a circulating supply of around 16.6 billion tokens and a price hovering near $0.0101. This asset, positioned as a "distributed computing resource provider," is playing an increasingly vital role in compute-intensive domains including artificial intelligence, machine learning, and cloud gaming.
This article will comprehensively analyze ATH's price trajectory from 2026 to 2031, combining historical patterns, market supply-demand dynamics, ecosystem development, and macroeconomic conditions to provide investors with professional price forecasts and practical investment strategies.
I. ATH Price History Review and Market Status
ATH Historical Price Evolution Trajectory
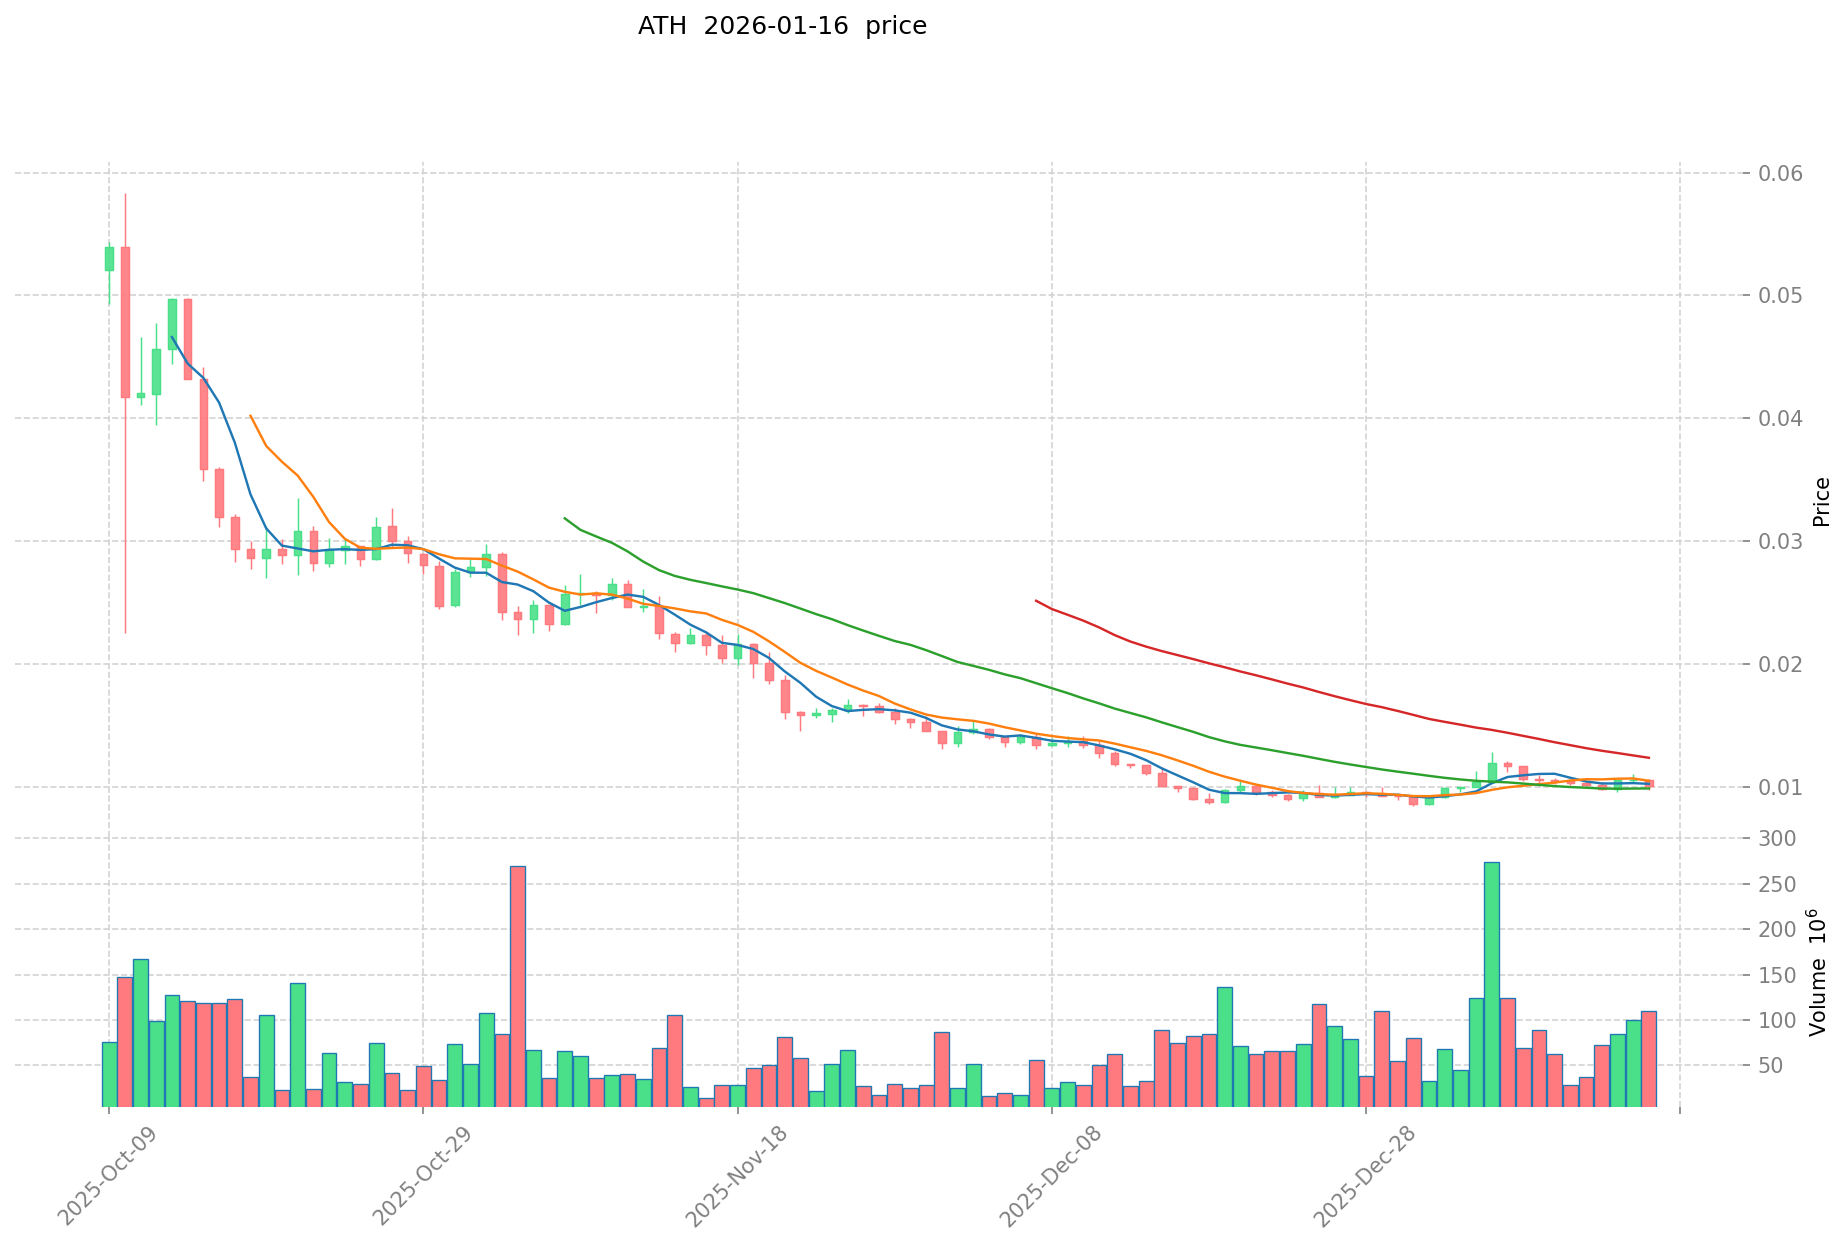
- 2024: Aethir (ATH) reached a notable price level of $0.14724 on June 12, marking a significant milestone in its early trading history. The token was initially launched at $0.118, showing positive momentum in its initial market phase.
- 2025: The token experienced substantial market correction throughout the year, with price declining significantly from previous levels. By the end of December 31, ATH recorded its lowest price point at $0.00843, representing a considerable downward movement from its peak.
- 2026 (Early January): As of January 16, ATH is trading at $0.01013, showing signs of recovery from its previous low point. The token has demonstrated a 30-day performance increase of 4.75%, though it remains considerably below its historical peak levels.
ATH Current Market Status
As of January 16, 2026, Aethir (ATH) is currently priced at $0.01013, with a 24-hour trading volume of approximately $1.26 million. The token has experienced a modest 1-hour price decrease of 0.16% and a 24-hour decline of 1%. Over the past week, ATH has decreased by 4.49%.
The circulating supply stands at 16.61 billion ATH tokens, representing approximately 39.54% of the total supply of 42 billion tokens. The current market capitalization is approximately $168.22 million, ranking the project at position 269 in the overall cryptocurrency market. The fully diluted market capitalization reaches $425.46 million.
ATH's 24-hour price range has fluctuated between $0.009783 and $0.010488. The token is held by approximately 52,653 holders and is deployed on the Ethereum blockchain as an ERC-20 token, with its contract address at 0xbe0Ed4138121EcFC5c0E56B40517da27E6c5226B. The current market sentiment indicator shows a neutral reading of 49 on the volatility index.
Click to view current ATH market price
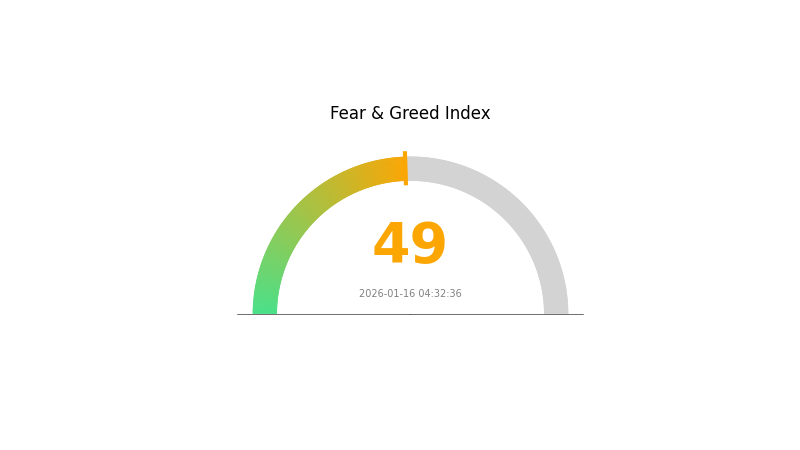
ATH Market Sentiment Index
2026-01-16 Fear & Greed Index: 49 (Neutral)
Click to view current Fear & Greed Index
The cryptocurrency market is currently displaying a neutral sentiment with the Fear & Greed Index standing at 49. This balanced reading suggests that market participants are neither excessively fearful nor overly greedy at present. Investors should maintain a measured approach, as neutral conditions often precede significant market movements. This is an opportune time for careful position management and strategic planning. Monitor the index closely for shifts that may indicate emerging market trends.
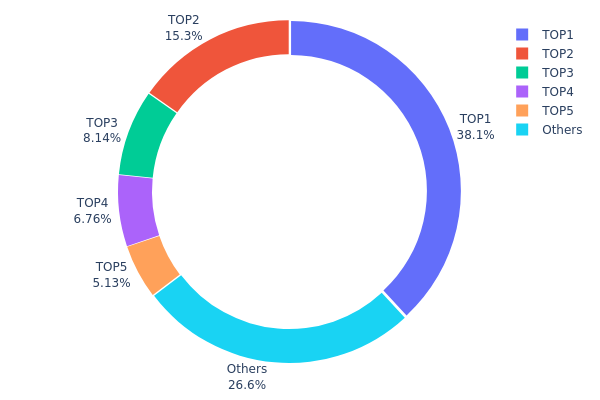
ATH Holding Distribution
The holding distribution chart illustrates the allocation of ATH tokens across different wallet addresses, revealing the degree of centralization within the token's ownership structure. This metric serves as a critical indicator of decentralization and potential market manipulation risks, as highly concentrated holdings can significantly impact price stability and overall market health.
Based on the current data, ATH exhibits a notably concentrated holding pattern. The top holder controls approximately 38.09% of the total supply with 16.00 million tokens, while the second-largest address holds 15.30%. Collectively, the top five addresses account for 73.40% of the circulating supply, leaving only 26.60% distributed among other participants. This concentration level suggests a relatively centralized token structure, where a small number of entities possess substantial control over the asset's market dynamics.
Such a concentrated distribution presents both risks and implications for market participants. The dominance of major holders creates potential vulnerabilities to price manipulation, as large-scale transfers or sell-offs from these addresses could trigger significant volatility. Additionally, this concentration may limit liquidity depth and increase susceptibility to coordinated market movements. However, it's worth noting that some concentrated holdings may represent project treasury reserves, ecosystem development funds, or locked liquidity pools rather than individual speculative positions. The current structure indicates that ATH's on-chain architecture remains in a relatively early stage of decentralization, with market stability heavily dependent on the behavior patterns of these major stakeholders.
Click to view current ATH Holding Distribution
| Top |
Address |
Holding Qty |
Holding (%) |
| 1 |
0xf9d9...6336b6 |
16001706.85K |
38.09% |
| 2 |
0xa02b...8d8bbe |
6429329.09K |
15.30% |
| 3 |
0x3e7e...a8c2f4 |
3417074.69K |
8.13% |
| 4 |
0xd5c3...db9c5d |
2837163.88K |
6.75% |
| 5 |
0x148f...771948 |
2155586.43K |
5.13% |
| - |
Others |
11159139.07K |
26.6% |
II. Core Factors Influencing ATH's Future Price
Supply Mechanism
- AI Computing Power Demand: According to the "2025 Global AI Computing Power White Paper", global AI computing power demand is growing at an annual rate of 67%. Traditional cloud service providers (such as AWS and Azure) face high prices and tight resources. Aethir's decentralized computing power network addresses this supply-demand gap by providing more cost-effective AI computing resources.
- Historical Pattern: The explosive growth in AI computing demand has driven increased adoption of decentralized infrastructure solutions, historically correlating with price appreciation for platforms offering scalable computing resources.
- Current Impact: The sustained high growth rate in AI computing demand is expected to continue driving demand for Aethir's services, potentially supporting price momentum as the network captures market share from traditional providers.
Institutional and Whale Dynamics
- Institutional Holdings: Data regarding specific institutional holdings of ATH is not available in the provided materials.
- Enterprise Adoption: Information about major enterprises adopting ATH is not available in the provided materials.
- National Policies: Global economic conditions and macroeconomic factors play a crucial role in influencing investor perceptions and price movements for digital assets including ATH.
Macroeconomic Environment
- Monetary Policy Impact: The passage of the "Digital Asset Market Clarity Act" in the United States is viewed as a critical turning point, expected to reduce policy uncertainty and promote deeper participation from banks and asset management institutions in the crypto market. This regulatory clarity may create a more favorable environment for digital assets including ATH.
- Inflation Hedge Attributes: With increased interest in tokenized assets and real-world asset (RWA) integration, digital assets are increasingly being considered as alternative store-of-value options amid concerns about fiat currency stability.
- Geopolitical Factors: Global economic conditions, including potential monetary policy shifts and macroeconomic uncertainty, continue to influence investor sentiment toward digital assets. The crypto market's increasing institutionalization may help stabilize price movements during periods of geopolitical tension.
Technological Development and Ecosystem Building
- Technology Upgrades: Major upgrades, improvements in scalability or security, and the launch of new features can significantly impact investor perceptions and influence price movements for ATH.
- Scalability Enhancements: Technological developments that improve network performance and transaction processing capabilities are key factors that may drive increased adoption and usage of the Aethir platform.
- Ecosystem Applications: The growth of decentralized applications (DApps) and projects within the AI computing ecosystem that leverage Aethir's infrastructure could expand the network's utility and value proposition, potentially supporting long-term price appreciation.
III. 2026-2031 ATH Price Prediction
2026 Outlook
- Conservative prediction: $0.00597 - $0.01012
- Neutral prediction: $0.01012
- Optimistic prediction: $0.01286 (requires favorable market conditions)
2027-2029 Outlook
- Market stage expectation: The token may enter a gradual consolidation and growth phase, with price volatility potentially narrowing as market participants adjust their positions and adoption evolves.
- Price range prediction:
- 2027: $0.00885 - $0.01333 (approximately 13% increase from 2026 baseline)
- 2028: $0.01067 - $0.01278 (approximately 22% increase from 2026 baseline)
- 2029: $0.01197 - $0.01297 (approximately 24% increase from 2026 baseline)
- Key catalysts: Market maturation, potential ecosystem developments, and broader cryptocurrency market trends could serve as primary drivers for price movements during this period.
2030-2031 Long-term Outlook
- Baseline scenario: $0.01278 (assuming steady market conditions and continued project development)
- Optimistic scenario: $0.01815 in 2030 (contingent upon favorable market sentiment and potential breakthrough developments)
- Growth scenario: $0.01825 in 2031 with average price reaching $0.01547 (representing approximately 52% increase from 2026 baseline, dependent upon significant ecosystem expansion and sustained adoption)
- January 16, 2026: Current market positioning suggests the token is in early stages of its projected growth trajectory.
| Year |
Predicted High Price |
Predicted Average Price |
Predicted Low Price |
Price Change |
| 2026 |
0.01286 |
0.01012 |
0.00597 |
0 |
| 2027 |
0.01333 |
0.01149 |
0.00885 |
13 |
| 2028 |
0.01278 |
0.01241 |
0.01067 |
22 |
| 2029 |
0.01297 |
0.01259 |
0.01197 |
24 |
| 2030 |
0.01815 |
0.01278 |
0.00767 |
26 |
| 2031 |
0.01825 |
0.01547 |
0.01067 |
52 |
IV. ATH Professional Investment Strategy and Risk Management
ATH Investment Methodology
(1) Long-term Holding Strategy
- Target Audience: Investors focusing on cloud computing and GPU infrastructure growth, with moderate to high risk tolerance
- Operational Recommendations:
- Consider dollar-cost averaging (DCA) approach to build positions gradually, mitigating short-term price volatility
- Monitor Aethir's ecosystem development, including partnerships in AI, ML, and cloud gaming sectors
- Storage Solution: Utilize Gate Web3 Wallet for secure self-custody with multi-signature options for larger holdings
(2) Active Trading Strategy
- Technical Analysis Tools:
- Moving Averages: Use 50-day and 200-day moving averages to identify trend directions and potential entry/exit points
- Relative Strength Index (RSI): Monitor overbought (above 70) and oversold (below 30) conditions for timing trades
- Swing Trading Key Points:
- Track 24-hour trading volume fluctuations as liquidity indicator for entry timing
- Set stop-loss orders at 5-8% below entry price to manage downside risk
ATH Risk Management Framework
(1) Asset Allocation Principles
- Conservative Investors: 1-3% of crypto portfolio
- Aggressive Investors: 5-10% of crypto portfolio
- Professional Investors: Up to 15% with active hedging strategies
(2) Risk Hedging Solutions
- Portfolio Diversification: Combine ATH with established cryptocurrencies and stablecoins to reduce concentration risk
- Position Sizing: Adjust exposure based on market volatility, reducing holdings during high-volatility periods
(3) Secure Storage Solutions
- Hot Wallet Recommendation: Gate Web3 Wallet for active trading and convenient access
- Cold Storage Solution: Hardware wallet storage for long-term holdings exceeding $10,000 equivalent
- Security Precautions: Enable two-factor authentication (2FA), never share private keys, verify contract addresses before transactions (0xbe0Ed4138121EcFC5c0E56B40517da27E6c5226B on Ethereum)
V. ATH Potential Risks and Challenges
ATH Market Risks
- Price Volatility: ATH experienced significant drawdown from its high of $0.14724 in June 2024, reflecting high market volatility characteristic of emerging infrastructure tokens
- Liquidity Concerns: With 24-hour trading volume of approximately $1.26 million, liquidity may be limited during market stress periods
- Competition Risk: Cloud computing and GPU infrastructure sector faces competition from established centralized providers and emerging decentralized alternatives
ATH Regulatory Risks
- Jurisdictional Uncertainty: Cloud computing infrastructure tokens may face evolving regulatory frameworks across different jurisdictions
- Compliance Requirements: Potential future requirements for GPU resource providers could impact network operations
- Token Classification: Regulatory clarity regarding ATH's classification as utility versus security token remains developing
ATH Technical Risks
- Smart Contract Vulnerabilities: ERC-20 token standard implementation requires ongoing security audits to prevent exploits
- Network Dependency: Reliance on Ethereum network for token operations subjects ATH to Ethereum's network congestion and gas fee fluctuations
- Adoption Challenges: Success depends on widespread adoption by enterprises requiring GPU resources for AI, ML, and gaming applications
VI. Conclusion and Action Recommendations
ATH Investment Value Assessment
Aethir presents a compelling value proposition in the decentralized cloud computing infrastructure space, addressing growing demand for GPU resources in AI, ML, and cloud gaming sectors. The project's focus on enterprise-grade GPU optimization differentiates it from consumer-focused alternatives. However, investors should consider the significant price decline of approximately 84.91% from its peak, indicating substantial short-term volatility. The circulating supply of 16.6 billion tokens (39.54% of maximum supply) suggests potential future supply expansion that may impact price dynamics. Long-term value depends on successful enterprise adoption and ecosystem development.
ATH Investment Recommendations
✅ Beginners: Start with small allocations (1-2% of crypto portfolio), utilize dollar-cost averaging strategy, and prioritize learning about cloud computing infrastructure fundamentals before increasing exposure
✅ Experienced Investors: Consider moderate positions (3-7% of crypto portfolio) with active monitoring of ecosystem developments, technical indicators, and market sentiment shifts
✅ Institutional Investors: Conduct thorough due diligence on Aethir's technology stack and partnership networks, implement hedging strategies, and consider phased entry approach aligned with enterprise adoption milestones
ATH Trading Participation Methods
- Spot Trading: Purchase ATH directly on Gate.com with competitive fees and deep liquidity
- Gradual Accumulation: Implement systematic purchase plans to average entry costs over time
- Portfolio Integration: Combine ATH with diversified crypto holdings including stablecoins for balanced risk exposure
Cryptocurrency investment carries extremely high risks. This article does not constitute investment advice. Investors should make prudent decisions based on their own risk tolerance and are advised to consult professional financial advisors. Never invest more than you can afford to lose.
FAQ
What is ATH price and how does it differ from current price?
ATH(All-Time High)is the highest price a cryptocurrency has ever reached in its trading history. Current price is the real-time market value today. ATH represents historical peak data, while current price reflects present market conditions and trading volume.
How to view the historical ATH price of a cryptocurrency or asset?
You can check historical ATH prices using CoinGecko or CoinMarketCap. These platforms provide comprehensive historical price data, including all-time high records for any cryptocurrency or asset you're interested in tracking.
What analytical methods are commonly used for ATH price prediction?
ATH price predictions typically employ technical analysis and fundamental analysis. Technical analysis examines charts and trading volume data to identify trends, while fundamental analysis evaluates market conditions and project developments. Both methods are widely used in cryptocurrency market forecasting.
Is it worth investing in an asset that is still far from its ATH price?
Yes, assets far from ATH often have significant upside potential. Lower prices provide better entry points before potential breakouts. Strong market momentum can drive prices beyond previous highs, offering attractive returns for early investors.
How to develop investment strategies and risk management based on ATH price?
Analyze historical ATH patterns and market cycles to identify entry points. Set clear stop-loss levels below support zones. Allocate position sizes based on your risk tolerance. Use ATH as a resistance benchmark, not a guarantee. Dollar-cost averaging reduces timing risk effectively.
What typically happens after an asset breaks through ATH based on historical data?
After breaking ATH, assets typically enter a consolidation phase with increased trading volume. Historical data shows this consolidation period is usually short-lived, followed by either continued upward momentum or price correction. Market sentiment and new catalysts significantly influence subsequent price movement.
* The information is not intended to be and does not constitute financial advice or any other recommendation of any sort offered or endorsed by Gate.