This comprehensive analysis examines Band Protocol's (BAND) price trajectory from 2026 through 2031, providing investors with expert forecasts and actionable strategies. Currently trading at $0.3118 with a $53.09 million market cap, BAND serves as critical data infrastructure for DeFi, GameFi, and AI agents. The article reviews historical price evolution from 2019's $0.473 launch through 2021's peak of $22.83, analyzing market sentiment and holdings distribution. Expert predictions span conservative ($0.27-$0.31 in 2026) to optimistic scenarios ($0.49-$0.55 by 2031). Key sections cover macroeconomic factors, technical analysis frameworks, and risk management methodologies for different investor profiles. Strategic recommendations include long-term holding approaches, active trading techniques, and secure storage solutions via Gate. Essential risk factors address price volatility, liquidity constraints, regulatory uncertainty, and competitive pressures within oracle infrastructure sectors. Ideal for institutio
Introduction: BAND's Market Position and Investment Value
Band Protocol (BAND), as a data layer infrastructure serving AI engines and blockchain applications, has established itself as a crucial component in the decentralized data ecosystem since its launch in 2019. By empowering DeFi, GameFi, and AI agents with real-time data access featuring zero counterparty risk, Band has positioned itself at the intersection of blockchain technology and artificial intelligence. As of January 2026, BAND maintains a market capitalization of approximately $53.09 million, with a circulating supply of around 170.26 million tokens, and a current price hovering near $0.3118. This asset, recognized as a bridge between traditional data sources and decentralized applications, is playing an increasingly vital role in powering financial protocols and autonomous AI systems.
This article will comprehensively analyze BAND's price trajectory from 2026 through 2031, combining historical patterns, market supply-demand dynamics, ecosystem development, and macroeconomic conditions to provide investors with professional price forecasts and practical investment strategies. With Band Protocol's infrastructure supporting over 34,450 holders and maintaining presence across 32 exchanges, understanding its potential valuation path becomes essential for both institutional and retail participants in the crypto asset space.
I. BAND Price History Review and Market Status
BAND Historical Price Evolution Trajectory
- 2019: Band Protocol launched in September with an initial offering price of $0.473, establishing its foundation in the blockchain data oracle space
- 2021: During the broader cryptocurrency market expansion, BAND reached its peak value of $22.83 on April 15, marking a period of heightened investor interest in oracle solutions
- 2019-2026: The token experienced volatility across market cycles, with its lowest recorded price of $0.203625 on November 25, 2019, reflecting early-stage market discovery
BAND Current Market Status
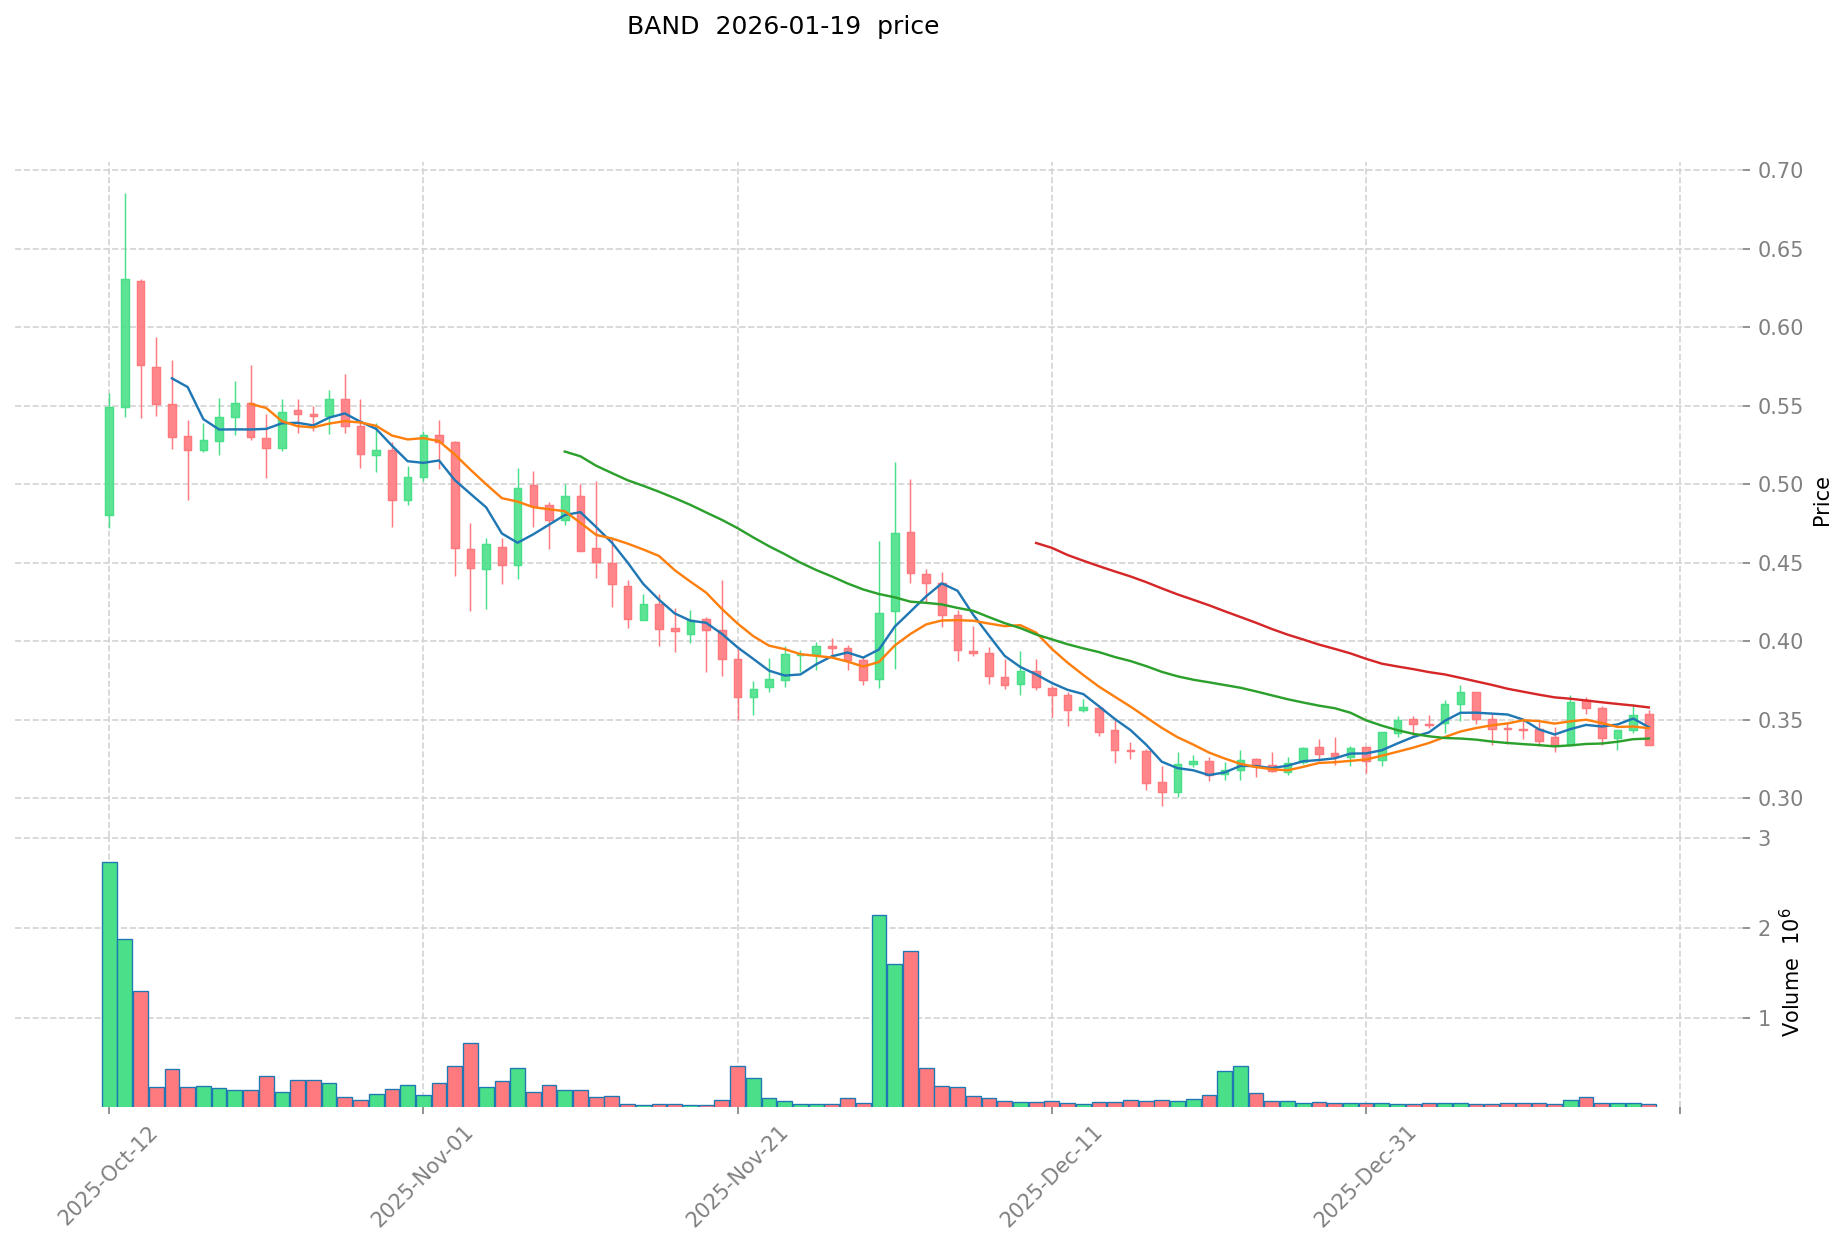
As of January 19, 2026, BAND is trading at $0.3118, showing recent downward pressure with an 11.8% decline over the past 24 hours and a 10.18% decrease in the last hour. The 24-hour trading range spans from $0.2996 to $0.3565, with total trading volume reaching $36,407.55.
The token maintains a market capitalization of approximately $53.09 million, ranking 505th among cryptocurrencies with a market dominance of 0.0016%. The circulating supply stands at 170.26 million BAND tokens, representing 99.67% of the total supply of 170.83 million tokens. The fully diluted market cap is $53.27 million, nearly equivalent to the current market capitalization.
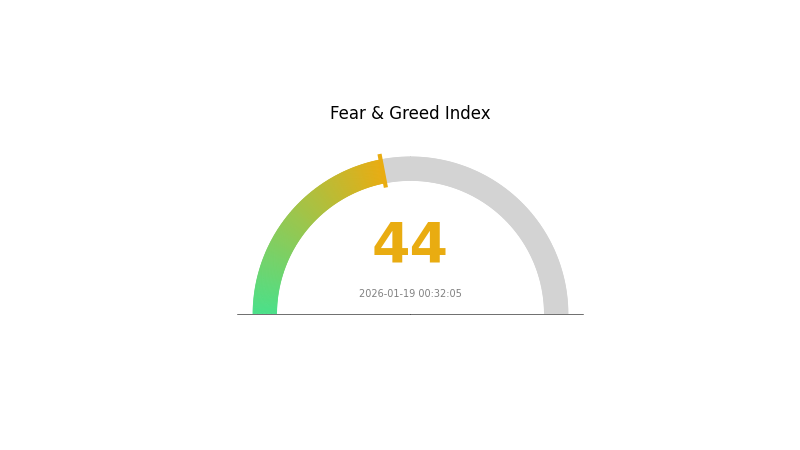
Band Protocol currently has a holder base of 34,450 addresses and is listed on 32 exchanges. The project's primary smart contract operates on the Ethereum network at address 0xBA11D00c5f74255f56a5E366F4F77f5A186d7f55. Recent market sentiment data indicates a Fear index reading of 44, suggesting cautious positioning among market participants.
Over extended timeframes, BAND has shown a 3.47% decline across 30 days, an 8.32% decrease over 7 days, and a 77.75% reduction across the past year, reflecting broader market adjustments and evolving competitive dynamics in the oracle infrastructure sector.
Click to view current BAND market price
BAND Market Sentiment Indicator
2026-01-19 Fear and Greed Index: 44 (Fear)
Click to view the current Fear & Greed Index
The cryptocurrency market is currently experiencing a fear sentiment with an index reading of 44. This indicates heightened market anxiety and cautious investor behavior. When the Fear and Greed Index falls in the fear zone, it often reflects concerns about market volatility, macroeconomic factors, or recent price corrections. Such conditions may present opportunities for contrarian investors, while others may prefer to adopt a defensive trading strategy. Monitoring sentiment indicators alongside fundamental analysis helps traders make more informed decisions during periods of market uncertainty.
BAND Holdings Distribution
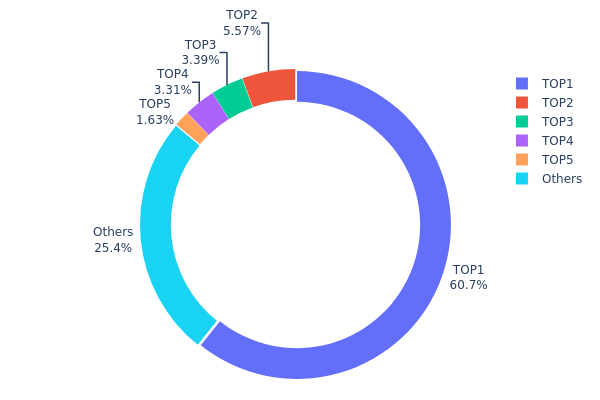
The holdings distribution chart reflects the allocation of BAND tokens across different wallet addresses on the blockchain, providing insights into the degree of token concentration and the decentralization level of the network. By analyzing the top holders and their respective holdings, we can assess potential risks related to market manipulation, selling pressure, and overall network health.
Based on the current data, BAND exhibits a highly concentrated holdings structure. The top address holds approximately 60.74 million tokens, accounting for 60.74% of the total supply, indicating significant centralization. The second through fifth largest addresses hold 5.57 million, 3.39 million, 3.31 million, and 1.63 million tokens respectively, representing 5.56%, 3.38%, 3.31%, and 1.63% of the total supply. Collectively, the top five addresses control approximately 74.62% of the circulating supply, while all remaining addresses combined hold only 25.38%.
This extreme concentration poses substantial risks to market stability and price dynamics. The dominant position of the largest holder creates a single point of failure, where any significant token movement could trigger dramatic price volatility. Such centralization also raises concerns about potential market manipulation, as these major holders possess sufficient market power to influence price discovery mechanisms. Furthermore, the limited distribution among smaller holders suggests weak retail participation and potentially fragile liquidity conditions. From a network governance perspective, this concentration may compromise the decentralized nature of the protocol, as decision-making power could be disproportionately controlled by a small group of entities.
Click to view current BAND Holdings Distribution
| Top |
Address |
Holding Qty |
Holding (%) |
| 1 |
0x7a62...595062 |
60747.28K |
60.74% |
| 2 |
0x4e91...7bae0e |
5568.37K |
5.56% |
| 3 |
0x7a59...c78e65 |
3389.09K |
3.38% |
| 4 |
0xf977...41acec |
3311.78K |
3.31% |
| 5 |
0x8cd2...d135b8 |
1631.84K |
1.63% |
| - |
Others |
25351.64K |
25.38% |
II. Core Factors Influencing BAND's Future Price
Macroeconomic Environment
-
Monetary Policy Impact: Tariff policies and government regulations significantly affect cryptocurrency markets. As crypto assets are considered relatively high-risk investments, changes in monetary policy and tariff implementations can create cost pressures that transmit through the market. Recent data shows that tariff policies have already added pressure to cost structures in recent months, which may influence digital asset valuations.
-
Inflation Hedge Attributes: Multiple factors are contributing to potential inflation pressures, including rising commodity prices and energy cost fluctuations. The LMEX industrial metals index has shown substantial gains, rising nearly 20% since December and accumulating 30% growth since September. This inflationary environment may affect risk asset performance, including cryptocurrencies, as investors seek alternative stores of value.
-
Geopolitical Factors: Global economic growth resilience and policy uncertainty continue to shape investment landscapes. Regulatory changes and government policy decisions regarding digital assets remain key variables. International market dynamics and strategic economic policies are creating an environment where cryptocurrency markets must navigate multiple external pressures and opportunities.
III. 2026-2031 BAND Price Prediction
2026 Outlook
- Conservative prediction: $0.27-$0.31
- Neutral prediction: $0.31-$0.34
- Optimistic prediction: $0.34-$0.37 (requiring sustained market momentum and broader adoption)
2027-2029 Outlook
- Market stage expectation: BAND is anticipated to enter a moderate growth phase, with potential volatility as the ecosystem develops and partnerships expand
- Price range predictions:
- 2027: $0.19-$0.41
- 2028: $0.28-$0.43
- 2029: $0.36-$0.47
- Key catalysts: Network upgrades, increased oracle data demand, integration with emerging blockchain protocols, and overall cryptocurrency market conditions
2030-2031 Long-term Outlook
- Baseline scenario: $0.34-$0.44 (assuming steady adoption and stable market conditions)
- Optimistic scenario: $0.44-$0.49 (with accelerated DeFi growth and expanded oracle utility)
- Transformative scenario: $0.49-$0.55 (under conditions of widespread oracle infrastructure adoption and significant technological breakthroughs)
- 2026-01-19: BAND trading within expected range as market establishes near-term support levels
| Year |
Predicted High Price |
Predicted Average Price |
Predicted Low Price |
Price Change |
| 2026 |
0.37224 |
0.3102 |
0.26677 |
0 |
| 2027 |
0.40605 |
0.34122 |
0.18767 |
9 |
| 2028 |
0.42968 |
0.37364 |
0.28396 |
19 |
| 2029 |
0.47396 |
0.40166 |
0.35748 |
28 |
| 2030 |
0.49472 |
0.43781 |
0.34149 |
40 |
| 2031 |
0.55019 |
0.46627 |
0.4243 |
49 |
IV. BAND Professional Investment Strategies and Risk Management
BAND Investment Methodology
(I) Long-term Holding Strategy
- Suitable for: Investors who believe in the long-term potential of decentralized data infrastructure and blockchain oracle solutions
- Operational Recommendations:
- Consider accumulating positions during market downturns, particularly when BAND trades near significant support levels
- Monitor developments in DeFi, GameFi, and AI agent ecosystems that rely on real-time data feeds
- Implement a cost-averaging approach to mitigate short-term price volatility
- Storage Solution: Utilize Gate Web3 Wallet for secure asset management with multi-layer security features
(II) Active Trading Strategy
- Technical Analysis Tools:
- Moving Averages: Monitor 50-day and 200-day moving averages to identify trend direction and potential reversal points
- RSI (Relative Strength Index): Track overbought (above 70) and oversold (below 30) conditions to time entries and exits
- Swing Trading Considerations:
- Set stop-loss orders 8-12% below entry points to limit downside exposure
- Take profits at predetermined resistance levels or when technical indicators signal trend exhaustion
BAND Risk Management Framework
(I) Asset Allocation Principles
- Conservative Investors: 1-3% of crypto portfolio
- Aggressive Investors: 5-8% of crypto portfolio
- Professional Investors: Up to 10-15% of crypto portfolio with active hedging strategies
(II) Risk Hedging Solutions
- Diversification Approach: Balance BAND holdings with exposure to other oracle solutions and DeFi infrastructure tokens
- Position Sizing: Limit individual trade sizes to 2-5% of total capital to prevent significant losses from single positions
(III) Secure Storage Solutions
- Hot Wallet Recommendation: Gate Web3 Wallet for convenient trading and staking access with enhanced security protocols
- Cold Storage Solution: For long-term holdings exceeding $10,000, consider hardware wallet solutions with offline private key storage
- Security Precautions: Enable two-factor authentication, regularly update security settings, never share private keys or seed phrases, and verify all transaction details before confirming
V. BAND Potential Risks and Challenges
BAND Market Risks
- Price Volatility: BAND has experienced significant price fluctuations, with a 77.75% decline over the past year, indicating high volatility and market sensitivity
- Liquidity Concerns: With a 24-hour trading volume of approximately $36,407, lower liquidity levels may result in wider bid-ask spreads and slippage during large transactions
- Competition Intensity: The oracle and blockchain data infrastructure sector faces increasing competition from established and emerging projects, potentially impacting BAND's market share
BAND Regulatory Risks
- Data Oracle Regulation: Evolving regulatory frameworks for blockchain oracles and data providers may introduce compliance requirements that affect operational costs
- Cross-border Data Flow: Regulatory restrictions on cross-border data transmission could impact BAND's global data infrastructure capabilities
- Token Classification: Uncertainty regarding regulatory classification of utility tokens in various jurisdictions may affect trading availability and investor access
BAND Technical Risks
- Smart Contract Vulnerabilities: Despite being battle-tested, smart contract exploits remain a persistent risk in the DeFi ecosystem, potentially affecting protocols relying on BAND's data feeds
- Oracle Attack Vectors: Data manipulation attempts, though mitigated by decentralized validation, pose ongoing security challenges that require continuous monitoring
- Scalability Constraints: As demand for real-time data increases across DeFi, GameFi, and AI applications, maintaining performance and reliability at scale presents technical challenges
VI. Conclusion and Action Recommendations
BAND Investment Value Assessment
BAND operates in the critical blockchain infrastructure sector, providing data layer services for DeFi, GameFi, and AI agents. While the project offers battle-tested infrastructure for real-time data access with zero counterparty risk, the token has faced significant price pressure with a 77.75% decline over the past year. The project's circulating supply represents 99.67% of maximum supply, indicating minimal future dilution concerns. However, investors should carefully weigh the long-term potential of oracle and AI data infrastructure against current market challenges and competitive pressures.
BAND Investment Recommendations
✅ Beginners: Start with small position sizes (1-2% of portfolio) to gain exposure while learning about oracle technology and blockchain data infrastructure. Focus on education before increasing allocation.
✅ Experienced Investors: Consider strategic accumulation during market weakness, particularly if fundamental developments in DeFi and AI agent ecosystems support increased data oracle demand. Maintain disciplined risk management.
✅ Institutional Investors: Evaluate BAND as part of a diversified blockchain infrastructure portfolio, conducting thorough due diligence on technical architecture, competitive positioning, and partnership ecosystem.
BAND Trading Participation Methods
- Spot Trading: Direct purchase and holding of BAND tokens through Gate.com with access to multiple trading pairs
- Strategic Accumulation: Implement dollar-cost averaging strategies to build positions gradually while managing volatility exposure
- Portfolio Integration: Incorporate BAND as part of a broader blockchain infrastructure allocation alongside complementary DeFi and oracle projects
Cryptocurrency investment carries extremely high risks, and this article does not constitute investment advice. Investors should make prudent decisions based on their own risk tolerance and are advised to consult professional financial advisors. Never invest more than you can afford to lose.
FAQ
What is BAND token and what is its purpose?
BAND is the native utility token of Band Protocol ecosystem. It's used for paying transaction fees, validator rewards, and enables token holders to participate in decentralized governance of the protocol.
What is BAND's historical price trend? What are the main factors affecting its price?
BAND has experienced significant volatility since launch, influenced by market demand, oracle utility adoption, data consumption trends, user engagement, and overall crypto market sentiment. Price movements correlate strongly with ecosystem development and institutional interest in decentralized oracle infrastructure.
What is the BAND token price prediction for 2024?
Based on historical data, BAND traded between $1.45 and $2.11 in 2024. Future price movements depend on protocol adoption, ecosystem development, and market conditions. Analysts suggest BAND could potentially reach $3-5 range in coming years with increased oracle demand and partnerships.
What are the risks of investing in BAND tokens?
BAND token investments carry high volatility risk with potential for significant price fluctuations and total loss of capital. Market uncertainty, liquidity constraints, and regulatory changes may impact value. Conduct thorough research before investing.
What are the advantages of BAND compared to other oracle projects like Chainlink?
Band Protocol offers faster transaction confirmations with 3-second block times and enables cross-chain data querying. Its DPoS mechanism ensures data accuracy through economic incentives, while maintaining strong institutional backing and partnerships across major blockchain projects.
What is the circulating supply and total supply of BAND tokens?
BAND has a total supply cap of 100 million tokens. As of recent data, the circulating supply is approximately 20-25 million tokens, with a structured release schedule designed to circulate the entire supply by 2025.
How to safely purchase and store BAND tokens?
Purchase BAND through reputable platforms using secure payment methods. Store tokens in trusted wallets like NOW Wallet or hardware wallets for enhanced security. Keep your private keys confidential and enable two-factor authentication for account protection.
* The information is not intended to be and does not constitute financial advice or any other recommendation of any sort offered or endorsed by Gate.


