This comprehensive guide provides expert analysis and price forecasts for Bitcoin Cash (BCH) from 2026 through 2031, positioning it as an essential resource for cryptocurrency investors. The article evaluates BCH's market fundamentals, including its $12.2 billion market cap and 95.14% circulating supply status, while analyzing key price drivers such as network upgrades, halving mechanisms, and institutional adoption. Featuring detailed price predictions ranging from $408.57 (conservative 2026) to $1,272.35 (optimistic 2031), the article delivers actionable investment strategies tailored for beginners, experienced traders, and institutional participants. Professional risk management frameworks, secure storage solutions on Gate, and detailed technical analysis tools enable informed decision-making. The guide addresses regulatory uncertainties, technical challenges, and market volatility while offering practical trading methodologies including spot trading, dollar-cost averaging, and portfolio rebalancing strate
Introduction: BCH's Market Position and Investment Value
Bitcoin Cash (BCH), as a prominent on-chain scaling solution in the cryptocurrency ecosystem, has evolved significantly since its inception in 2017 through a hard fork from Bitcoin. As of 2026, BCH has achieved a market capitalization of approximately $12.2 billion, with a circulating supply of around 19.98 million tokens, and the price maintaining around $610. This asset, recognized as a "peer-to-peer electronic cash system," is playing an increasingly important role in facilitating global digital payments and transactions.
This article will comprehensively analyze BCH's price trajectory from 2026 to 2031, combining historical patterns, market supply-demand dynamics, ecosystem developments, and macroeconomic conditions to provide investors with professional price forecasts and practical investment strategies.
I. BCH Price History Review and Market Status
BCH Historical Price Evolution Trajectory
- 2017: Bitcoin Cash emerged from a hard fork of Bitcoin's original chain in August, launched by ViaBTC based on the Bitcoin ABC solution. The asset was initially priced at $555.89 and experienced significant momentum during the cryptocurrency bull market, reaching $3,785.82 in December.
- 2018: Following the broader cryptocurrency market correction, BCH experienced substantial downward pressure, declining to $76.93 in December, representing a significant retracement from its peak.
- 2025-2026: BCH demonstrated recovery momentum, with the price climbing from $448.69 (one year prior) to the current level of $610.48, reflecting a year-over-year increase of 36.059%.
BCH Current Market Situation
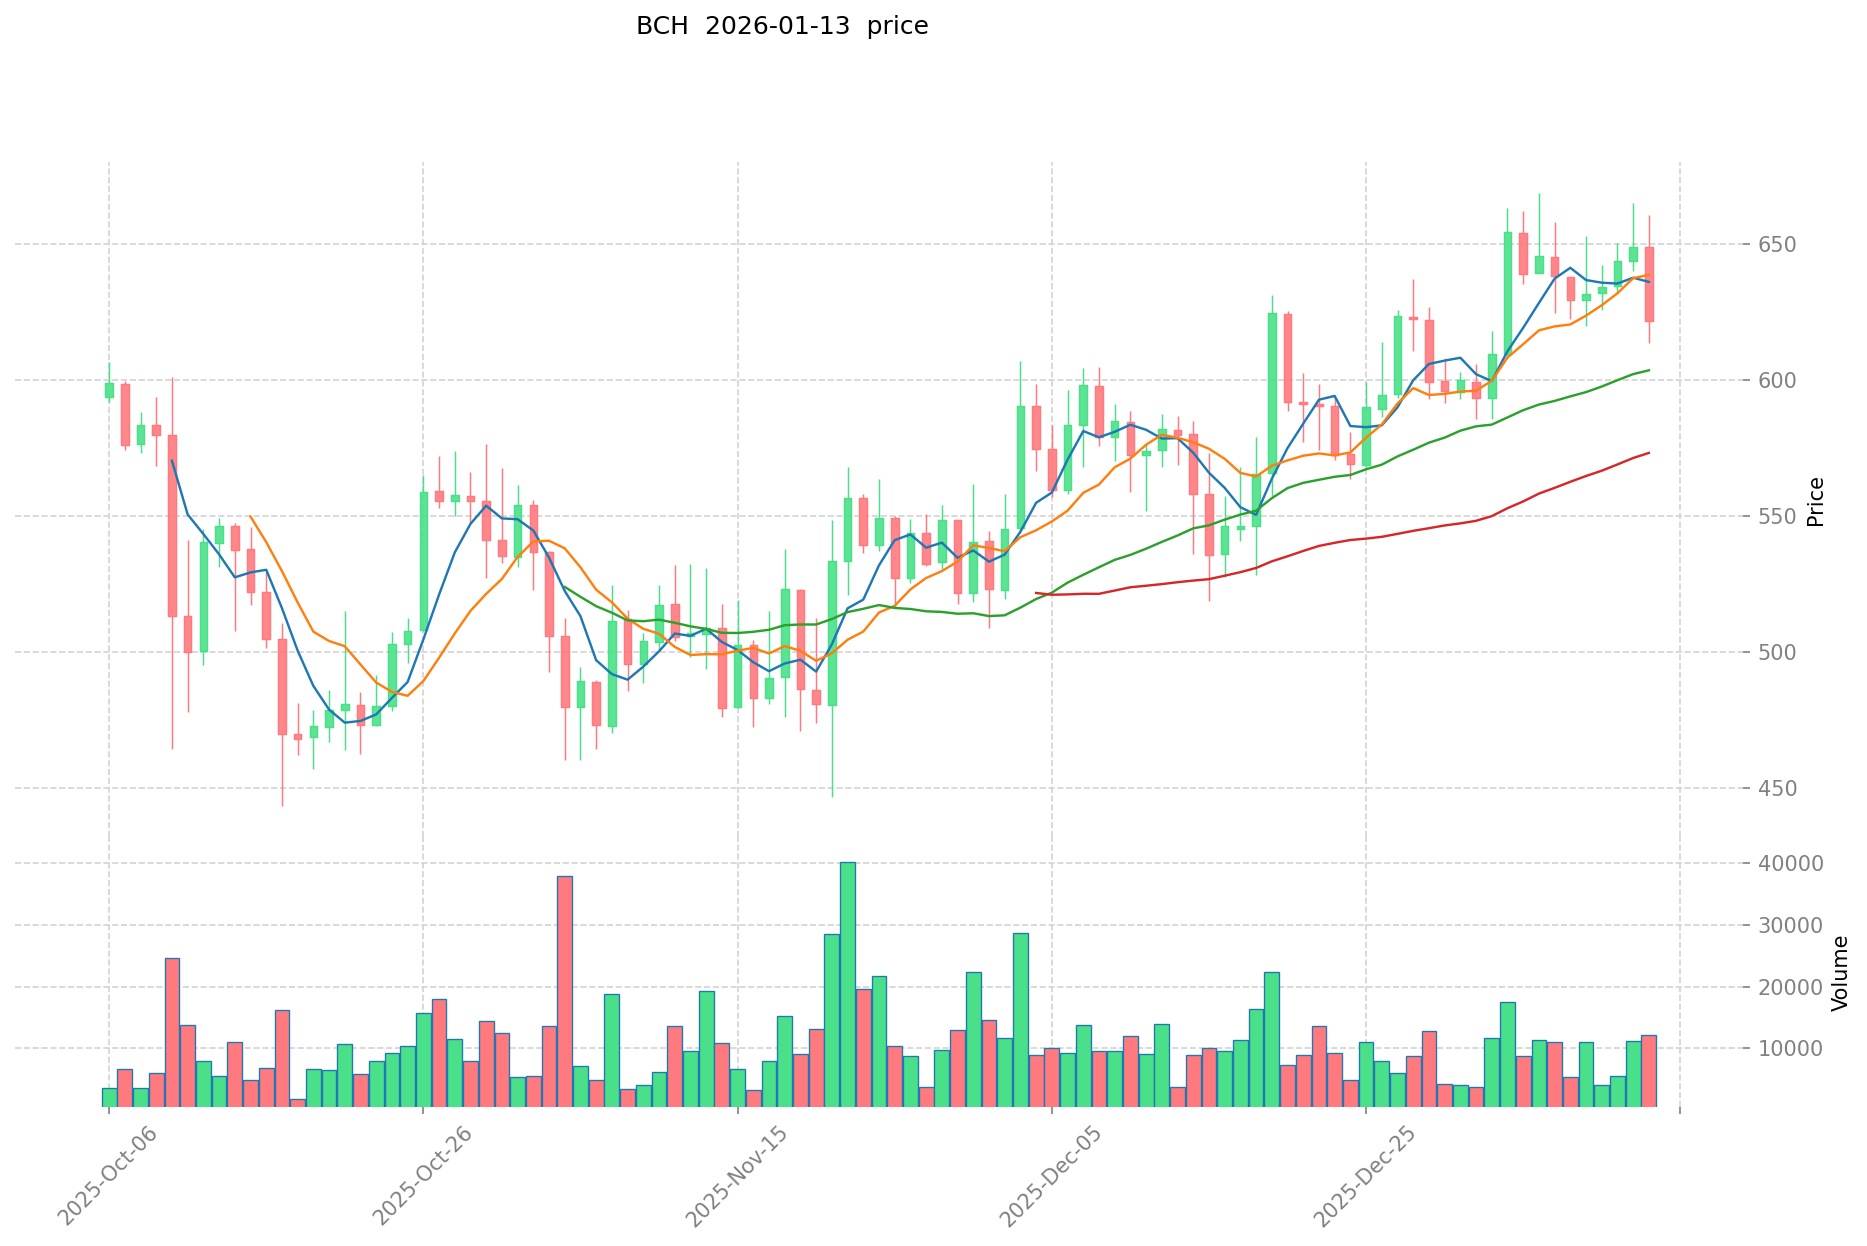
As of January 13, 2026, Bitcoin Cash is trading at $610.48, positioning it as the 12th largest cryptocurrency by market capitalization with a total market cap of approximately $12.20 billion. The asset maintains a market dominance of 0.37% within the broader cryptocurrency ecosystem.
Recent price action shows mixed short-term performance: BCH declined 1.13% over the past hour and 4.32% over the past 24 hours, with the daily trading range spanning from $607.00 to $638.75. The 7-day performance indicates a 5.85% decrease. However, the 30-day trajectory remains positive with a 5.53% gain, while the annual performance demonstrates substantial strength with a 36.059% increase.
The circulating supply stands at 19,980,040.52 BCH, representing 95.14% of the maximum supply of 21 million tokens. Daily trading volume reached $5.91 million, with the asset listed on 71 exchanges and reportedly held by approximately 22.51 million addresses. The market cap to fully diluted valuation ratio stands at 95.14%, indicating limited additional supply pressure.
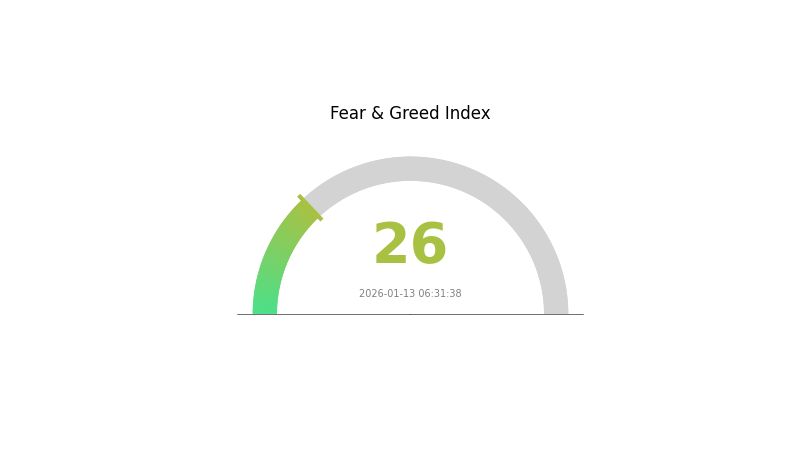
Current market sentiment, as measured by the Fear & Greed Index, registers at 26, indicating a "Fear" state in the broader cryptocurrency market, which may be influencing short-term price movements across digital assets including BCH.
Click to view current BCH market price
BCH Market Sentiment Indicator
2026-01-13 Fear and Greed Index: 26 (Fear)
Click to view current Fear & Greed Index
The Fear and Greed Index stands at 26, indicating a Fear market sentiment. This reading suggests increased caution among investors, with market participants becoming more risk-averse. Lower index levels typically reflect pessimism and defensive positioning in the crypto market. Traders should monitor this sentiment carefully, as fear-driven markets often create both challenges and potential opportunities for strategic investors. Consider your risk tolerance and investment strategy accordingly during this period of elevated market anxiety.
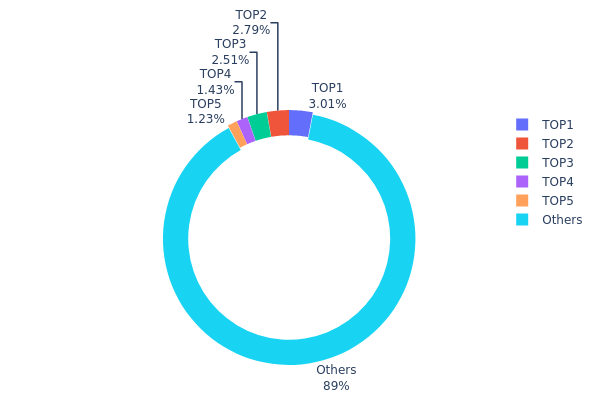
BCH Holding Distribution
The holding distribution chart reflects the allocation pattern of BCH tokens across different addresses on the blockchain, serving as a critical indicator for assessing market concentration and decentralization levels. By analyzing the proportion held by top addresses versus the broader holder base, this metric provides insights into potential market manipulation risks, liquidity dynamics, and the overall health of the network's participant structure.
According to the current data, the top five addresses collectively hold approximately 2.19 million BCH, representing 10.94% of the total supply, while the remaining 89.06% is distributed among other addresses. The largest address holds 600.87K BCH (3.00%), followed by addresses controlling 2.79%, 2.50%, 1.43%, and 1.22% respectively. This distribution pattern indicates a relatively moderate concentration level compared to many other cryptocurrencies, where top addresses often control significantly larger portions of the total supply. The fact that no single address holds more than 3% of the total supply suggests a reasonably balanced power structure within the BCH ecosystem.
From a market structure perspective, this holding distribution reflects positive characteristics for BCH's decentralization and on-chain stability. The relatively dispersed nature of holdings reduces the risk of coordinated sell-offs by whale addresses, which could otherwise trigger significant price volatility. Moreover, the substantial 89.06% held by addresses outside the top five demonstrates broad participation across the network, indicating healthy adoption and genuine user engagement rather than concentrated accumulation by a limited number of entities. This balanced distribution pattern typically contributes to more stable price discovery mechanisms and reduced susceptibility to market manipulation, fostering a more resilient trading environment for both retail and institutional participants.
Click to view current BCH Holding Distribution
| Top |
Address |
Holding Qty |
Holding (%) |
| 1 |
qrmfke...wse7ve |
600.87K |
3.00% |
| 2 |
qre24q...28z85p |
558.21K |
2.79% |
| 3 |
qrwcmu...e0z839 |
500.55K |
2.50% |
| 4 |
qqwj7g...yyk82r |
285.99K |
1.43% |
| 5 |
qr3u8s...fjmp7k |
245.39K |
1.22% |
| - |
Others |
17788.59K |
89.06% |
II. Core Factors Influencing BCH's Future Price
Supply Mechanism
- Bitcoin Cash Halving: BCH follows a similar halving schedule to Bitcoin, reducing block rewards periodically to control supply inflation. This deflationary mechanism historically creates scarcity pressure on the asset.
- Historical Pattern: Previous supply adjustments in the broader cryptocurrency market have contributed to price volatility, with BCH experiencing notable fluctuations during periods of market-wide supply changes.
- Current Impact: The supply dynamics continue to play a role in BCH's price discovery, though the magnitude of impact varies based on overall market conditions and adoption levels.
Institutional and Major Holder Dynamics
- Regulatory Policy Changes: Regulatory developments across different jurisdictions directly influence BCH price movements. Historical data shows that legislative actions in certain countries have triggered daily price fluctuations exceeding 15%, demonstrating the sensitivity of BCH to policy announcements.
- Market Adoption: The actual usage of BCH for real-world payments remains a critical factor in determining its long-term value proposition and price stability.
Macroeconomic Environment
- Market Uncertainty: The broader cryptocurrency market trends significantly impact BCH pricing. Uncertainty in financial markets, coupled with evolving macroeconomic factors, creates both risks and opportunities for BCH investors.
- Correlation with Bitcoin: BCH exhibits a high correlation with Bitcoin's price movements. Market-wide corrections in Bitcoin often translate to substantial pressure on BCH, making the overall crypto market sentiment a crucial consideration.
Technical Development and Ecosystem Building
- Network Upgrades: The progression of network upgrades represents a key factor in BCH's price trajectory. Technical improvements and protocol enhancements can influence investor confidence and market perception.
- Technology Innovation: Ongoing technological innovation continues to shape BCH's competitive position. As the blockchain space evolves, BCH's ability to adapt and implement technical improvements affects its long-term viability.
- Competitive Landscape: Competition from other payment-focused cryptocurrencies and Layer 2 solutions poses challenges to BCH's market position. The ecosystem must continuously demonstrate unique value propositions to maintain relevance.
- Investor Sentiment and Adoption: Market dynamics are driven by multiple factors including investor sentiment, adoption rates, and practical utility. The success of BCH depends on its ability to gain traction in real-world use cases and maintain community support.
III. 2026-2031 BCH Price Forecast
2026 Outlook
- Conservative Forecast: $408.57 - $609.80
- Neutral Forecast: Around $609.80
- Optimistic Forecast: Up to $682.98 (requiring favorable market conditions and increased adoption)
The 2026 price projections for Bitcoin Cash suggest a trading range between $408.57 and $682.98, with an average price estimate of $609.80. This baseline scenario reflects the current market positioning and anticipated developments in the BCH ecosystem.
2027-2029 Mid-Term Outlook
- Market Phase Expectation: Potential consolidation period with gradual upward momentum as the cryptocurrency market matures
- Price Range Forecast:
- 2027: $349.05 - $879.09, average around $646.39
- 2028: $579.68 - $884.78, average around $762.74
- 2029: $560.15 - $1,169.73, average around $823.76
- Key Catalysts: Enhanced network utility, growing merchant adoption, technological improvements in transaction efficiency, and broader cryptocurrency market trends
The mid-term forecast indicates progressive price appreciation, with 2028 showing a projected 25% increase and 2029 potentially reaching a 35% gain compared to the baseline year. These projections assume continued development of the BCH network and sustained interest in peer-to-peer electronic cash systems.
2030-2031 Long-Term Outlook
- Baseline Scenario: $588.08 - $996.75 (assuming steady ecosystem growth and moderate market expansion)
- Optimistic Scenario: $996.75 - $1,216.03 (contingent upon significant adoption milestones and favorable regulatory developments)
- Transformative Scenario: $962.56 - $1,272.35 (dependent on breakthrough use cases and mainstream payment integration)
By 2030, BCH could potentially achieve a 63% increase with prices ranging between $588.08 and $1,216.03, averaging around $996.75. The 2031 forecast suggests further growth potential with an estimated 81% increase, positioning the average price at approximately $1,106.39, with a possible high of $1,272.35.
These long-term projections reflect the potential maturation of Bitcoin Cash as a payment-focused cryptocurrency, though actual outcomes will depend on numerous factors including technological advancements, competitive positioning, regulatory landscape, and overall cryptocurrency market dynamics. Investors should note that cryptocurrency markets remain highly volatile, and these forecasts represent analytical estimates rather than guaranteed outcomes.
| Year |
Predicted High Price |
Predicted Average Price |
Predicted Low Price |
Price Change |
| 2026 |
682.98 |
609.8 |
408.57 |
0 |
| 2027 |
879.09 |
646.39 |
349.05 |
6 |
| 2028 |
884.78 |
762.74 |
579.68 |
25 |
| 2029 |
1169.73 |
823.76 |
560.15 |
35 |
| 2030 |
1216.03 |
996.75 |
588.08 |
63 |
| 2031 |
1272.35 |
1106.39 |
962.56 |
81 |
IV. BCH Professional Investment Strategies and Risk Management
BCH Investment Methodology
(I) Long-term Holding Strategy
- Suitable for: investors who believe in Bitcoin's original scaling vision and seek exposure to peer-to-peer electronic cash systems
- Operational recommendations:
- Accumulate positions during market downturns when BCH trades below its 30-day average
- Monitor BCH's development progress and adoption metrics for on-chain payment use cases
- Utilize cold storage solutions for holdings intended for multi-year timeframes
(II) Active Trading Strategy
- Technical analysis tools:
- Support and resistance levels: BCH's 24-hour range of $607-$638.75 provides reference points for short-term position management
- Volume analysis: Current 24-hour volume of $5.91 million indicates liquidity conditions for entry and exit timing
- Swing trading key points:
- Consider BCH's historical volatility patterns, noting its -5.85% weekly decline versus +5.53% monthly gain
- Monitor correlation with Bitcoin price movements as BCH originated from BTC hard fork
BCH Risk Management Framework
(I) Asset Allocation Principles
- Conservative investors: 1-3% portfolio allocation
- Aggressive investors: 5-10% portfolio allocation
- Professional investors: 10-15% portfolio allocation with hedging strategies
(II) Risk Hedging Solutions
- Diversification approach: combine BCH exposure with Bitcoin and stablecoin positions to balance fork-specific risks
- Position sizing strategy: scale into positions gradually rather than single large purchases given BCH's price volatility
(III) Secure Storage Solutions
- Hardware wallet recommendation: Gate Web3 Wallet for multi-chain asset management including BCH
- Multi-signature solution: implement 2-of-3 or 3-of-5 signature schemes for larger BCH holdings
- Security precautions: verify receiving addresses multiple times, maintain offline backups of recovery phrases, and never share private keys
V. BCH Potential Risks and Challenges
BCH Market Risks
- Price volatility: BCH has experienced -4.32% decline in 24 hours, demonstrating significant short-term price fluctuations
- Liquidity concerns: with $5.91 million daily trading volume, large position exits may face slippage
- Market dominance: BCH holds 0.37% market share, indicating limited investor attention compared to major cryptocurrencies
BCH Regulatory Risks
- Cryptocurrency classification uncertainty: regulatory treatment of Bitcoin forks remains undefined in multiple jurisdictions
- Exchange compliance requirements: trading restrictions may affect BCH availability on platforms in certain regions
- Tax treatment complexity: capital gains reporting for hard fork recipients creates accounting challenges
BCH Technical Risks
- Network security considerations: smaller mining hashrate compared to Bitcoin may present 51% attack vulnerability
- Development fragmentation: decentralized development approach can lead to coordination challenges and competing implementation proposals
- Scaling limitations: while BCH increased block size, ongoing debates about optimal scaling approaches create uncertainty
VI. Conclusion and Action Recommendations
BCH Investment Value Assessment
Bitcoin Cash presents a unique value proposition as a peer-to-peer electronic cash system following Bitcoin's original scaling roadmap. With 95.14% of its 21 million maximum supply already in circulation and a market capitalization of $12.19 billion, BCH occupies an established position in the cryptocurrency ecosystem. The project's +36.06% year-over-year performance demonstrates long-term resilience, though recent -5.85% weekly decline indicates short-term volatility risks. Investors should evaluate BCH based on their conviction in on-chain scaling approaches and payment use case adoption potential.
BCH Investment Recommendations
✅ Beginners: start with minimal allocation (1-2% of crypto portfolio), focus on understanding Bitcoin Cash's technical differences from Bitcoin, and use only funds you can afford to lose
✅ Experienced investors: consider BCH as a diversification component within cryptocurrency holdings, implement dollar-cost averaging during periods of market weakness, and monitor development milestones
✅ Institutional investors: evaluate BCH exposure as part of broader Bitcoin ecosystem investments, implement robust custody solutions, and assess correlation dynamics with Bitcoin
BCH Trading Participation Methods
- Spot trading: direct purchase of BCH on Gate.com with immediate ownership and withdrawal capabilities
- Portfolio rebalancing: periodically adjust BCH allocation based on performance relative to other cryptocurrency holdings
- Research-driven accumulation: build positions based on fundamental analysis of Bitcoin Cash development progress and adoption metrics
Cryptocurrency investment carries extremely high risks, and this article does not constitute investment advice. Investors should make prudent decisions based on their own risk tolerance and are advised to consult professional financial advisors. Never invest more than you can afford to lose.
FAQ
What are the historical highest and lowest prices of BCH?
BCH reached its all-time high of $1635 on May 12, 2021, and its all-time low of $1.0000 in 2017.
What is the BCH price prediction for 2024?
In 2024, BCH reached a high of $714 and a low of $219, closing the year around $470. These predictions are based on market trends and technical analysis of the Bitcoin Cash network fundamentals.
What are the main factors affecting BCH price?
BCH price is primarily influenced by market competition from Bitcoin and Ethereum, trading volume and investor demand, blockchain technology developments, regulatory changes, and overall cryptocurrency market sentiment and adoption rates.
What are the main factors determining the price difference between BCH and BTC?
BCH and BTC price differences are primarily determined by market demand, transaction speed, and transaction fees. BCH has larger block sizes, faster transactions, and lower fees, while BTC has higher market capitalization but slower transaction speed and higher fees.
How to predict BCH price trends through technical analysis?
Use technical indicators like moving averages, RSI, and MACD to analyze BCH price patterns. Monitor trading volume, support/resistance levels, and market trends. Based on historical data analysis, BCH may range from $333 to $356, with average trading volume indicating potential price movements.
What is the relationship between BCH mining difficulty and price?
Mining difficulty adjusts based on network hashrate but has no direct correlation with BCH price. Lower difficulty may reduce miner profitability, while higher difficulty doesn't guarantee price appreciation. Price is primarily driven by market demand and sentiment.
* The information is not intended to be and does not constitute financial advice or any other recommendation of any sort offered or endorsed by Gate.