# 2025 BST Price Prediction: Expert Analysis and Market Forecast for the Next Bull Run
**Article Overview:**
This comprehensive guide analyzes Blocksquare (BST), a pioneering Real World Asset (RWA) tokenization platform, examining its market position, historical performance, and price trajectories through 2030. As of December 2025, BST trades at $0.02465 with a $1.15M market cap, having declined 90.18% over one year amid extreme market fear (Fear & Greed Index: 20). The article combines technical analysis, market sentiment evaluation, and macroeconomic factors to deliver professional price forecasting ranging from $0.01455 to $0.0692 across five-year scenarios. Designed for beginners, experienced traders, and institutional investors on Gate, this analysis provides actionable investment strategies, risk management frameworks, and realistic assessments of BST's potential within the emerging RWA sector, emphasizing that early believers face significant volatility but potential long-term upside as real estate t
Introduction: BST's Market Position and Investment Value
Blocksquare (BST) is an award-winning Real World Asset (RWA) focused company building the world's leading blockchain-based real estate tokenization system. Since its inception in 2018, Blocksquare has established infrastructure powering over 1,000 marketplaces globally and entered the DeFi market through Oceanpoint.fi. As of December 27, 2025, BST maintains a market capitalization of approximately $1,149,020.88, with a circulating supply of 46,613,423 tokens trading at $0.02465 per unit. This innovative asset, recognized as a pioneer in real estate tokenization, is playing an increasingly critical role in bridging traditional real estate with decentralized finance markets.
This article will provide a comprehensive analysis of Blocksquare's price trajectories and market dynamics, combining historical performance patterns, market supply and demand forces, ecosystem development, and macroeconomic factors to deliver professional price forecasting and actionable investment guidance for investors evaluating BST's potential through 2030.
Blocksquare (BST) Market Analysis Report
I. BST Price History Review and Current Market Status
BST Historical Price Evolution
-
2024: BST reached its all-time high of $0.9842 on March 30, 2024, marking a significant peak in the token's market performance.
-
2025: Following the peak, BST experienced substantial decline. The token hit its all-time low of $0.0232 on December 5, 2025, representing a sharp correction from previous highs.
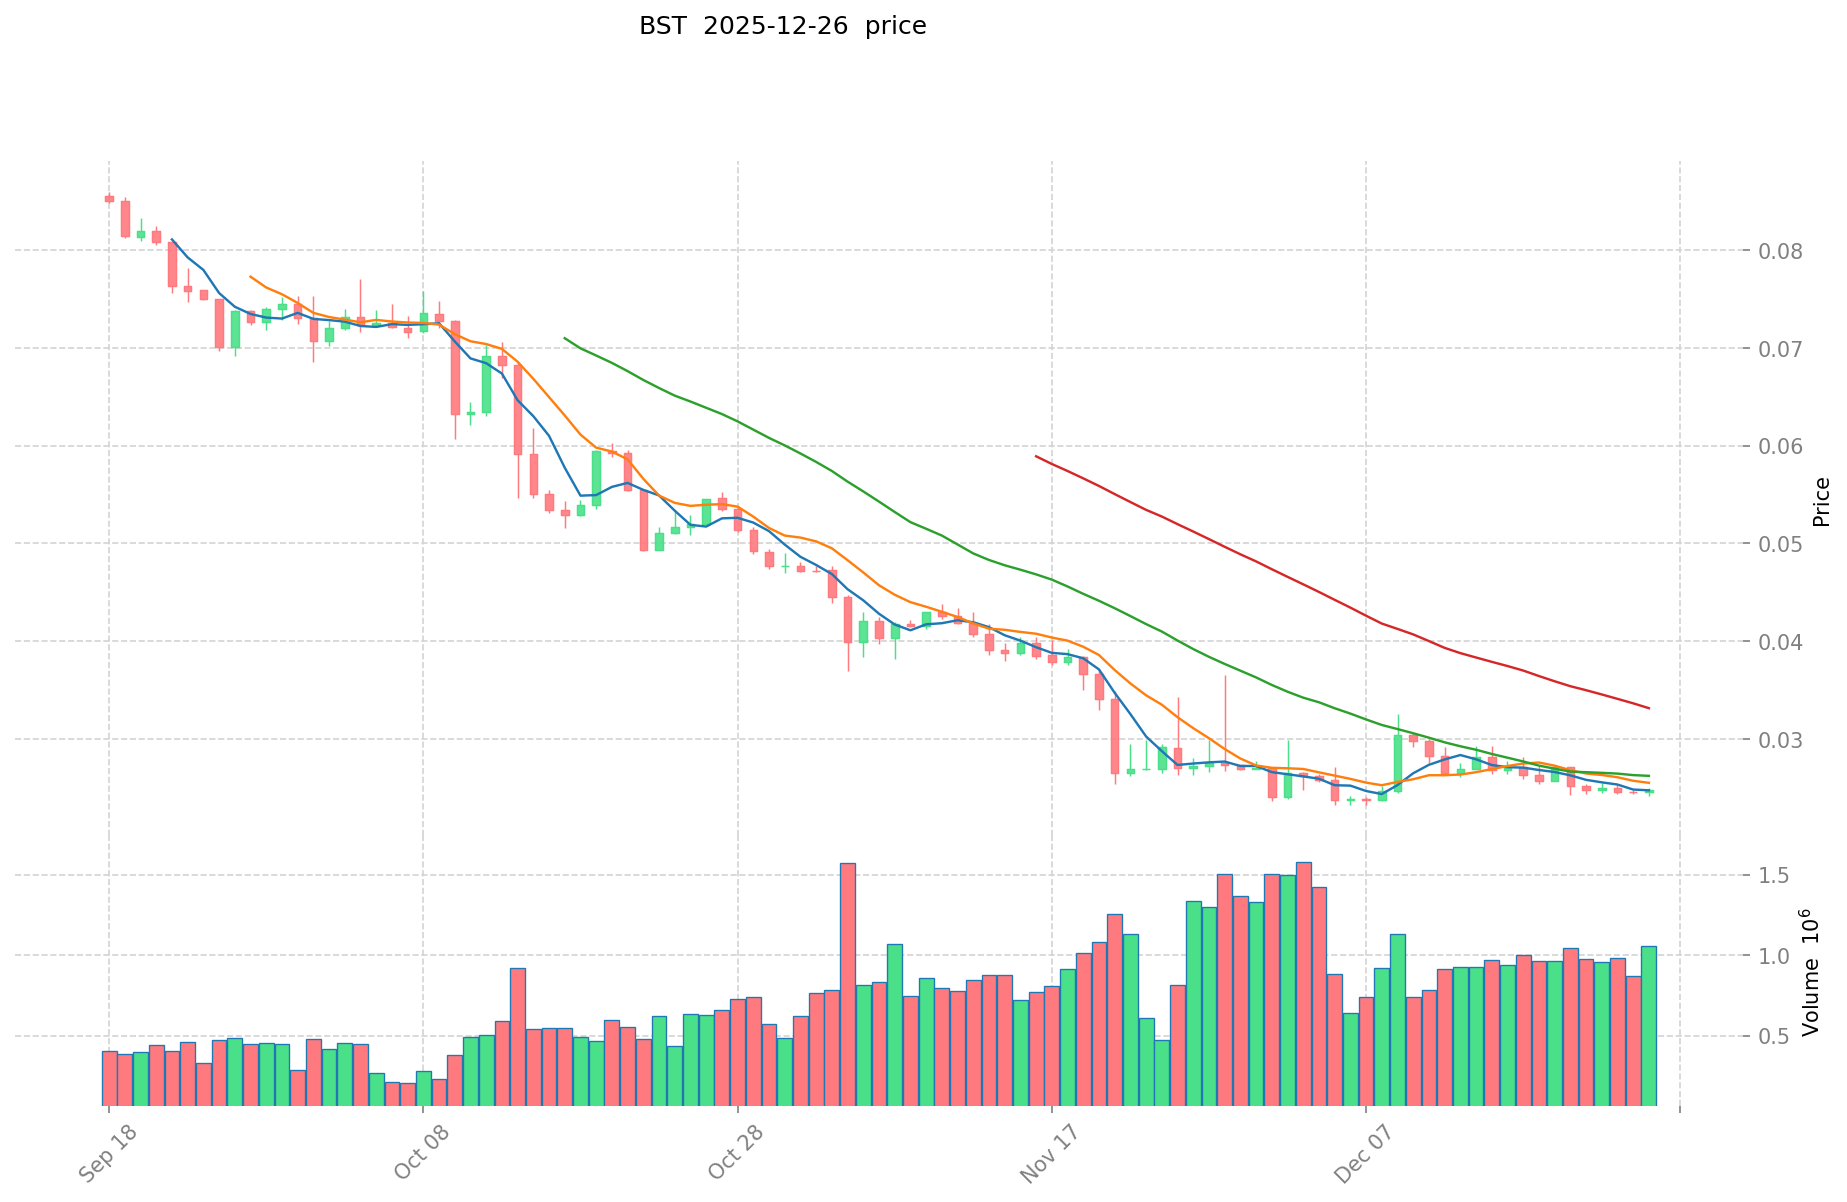
BST Current Market Situation
As of December 27, 2025, BST is trading at $0.02465, reflecting a 1.77% increase over the past 24 hours. Despite the recent daily recovery, the token shows concerning longer-term performance metrics:
- 7-day performance: -7.5%
- 30-day performance: -7.16%
- 1-year performance: -90.18%
The 24-hour trading volume stands at $20,606.92, with the token currently ranked #2,519 by market capitalization. The circulating market cap is approximately $1,149,020.88, based on 46,613,423 BST tokens in circulation (representing 46.61% of the total 100 million token supply). The fully diluted valuation is $2,465,000.
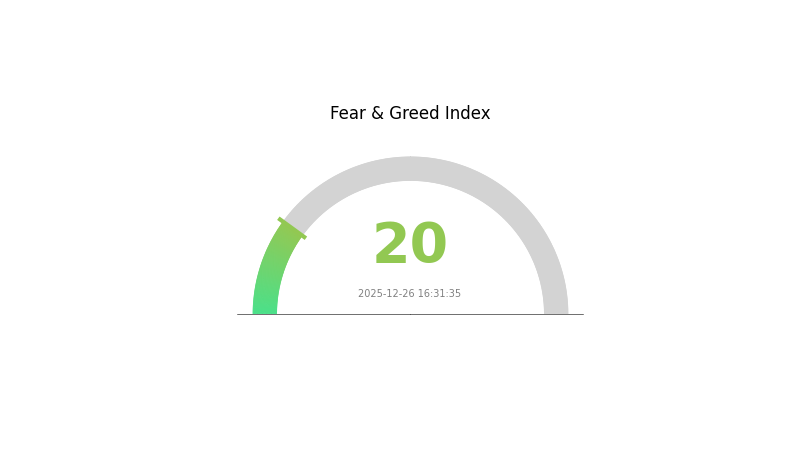
The current market emotion index is at 0, indicating "Extreme Fear" sentiment as of December 26, 2025. BST is supported across 3 exchanges with 4,753 token holders. The token operates on the Ethereum blockchain as an ERC-20 standard asset.
Click to view current BST market price
BST Market Sentiment Index
2025-12-26 Fear and Greed Index: 20 (Extreme Fear)
Click to view the current Fear & Greed Index
The crypto market is experiencing extreme fear with an index reading of 20, signaling significant market pessimism and risk aversion among investors. This extreme fear level typically indicates potential opportunities for contrarian investors, as such conditions often precede market reversals. However, caution is advised as further downside risks may persist. Traders should consider diversifying their portfolios and conducting thorough risk assessments before making investment decisions during this highly volatile period on Gate.com.
BST Holdings Distribution
The address holdings distribution chart illustrates the concentration pattern of BST tokens across blockchain addresses, revealing the degree of wealth centralization within the ecosystem. By analyzing the top holders and their respective percentages, we can assess the token's decentralization level, market structure stability, and susceptibility to potential price volatility driven by concentrated stakeholders.
BST exhibits significant concentration characteristics, with the top three addresses controlling approximately 62.70% of the total supply. The leading address (0x6f1e...9f7f8a) dominates the landscape with 39.55% of holdings, representing a substantial single-point concentration risk. The second and third addresses hold 13.25% and 9.90% respectively, creating a steep distribution curve. While the fourth and fifth addresses contribute 2.58% and 1.87%, the remaining 32.85% distributed among other addresses indicates a long tail of smaller holders. This hierarchical structure suggests moderate decentralization at the lower tiers but pronounced dependency on top-tier stakeholders.
The concentrated holdings present tangible implications for market dynamics. The dominant position of the leading address creates potential liquidity constraints and heightens vulnerability to coordinated selling pressure or whale-driven price movements. However, with nearly one-third of tokens dispersed among other holders, the ecosystem maintains a foundational layer of distributed participation. The current distribution reflects a market structure characterized by significant centralization in governance and price influence, though not extreme monopolistic control. This configuration suggests the need for continued organic holder growth and gradual decentralization to enhance market resilience and reduce systematic risks.
Click to view current BST Holdings Distribution
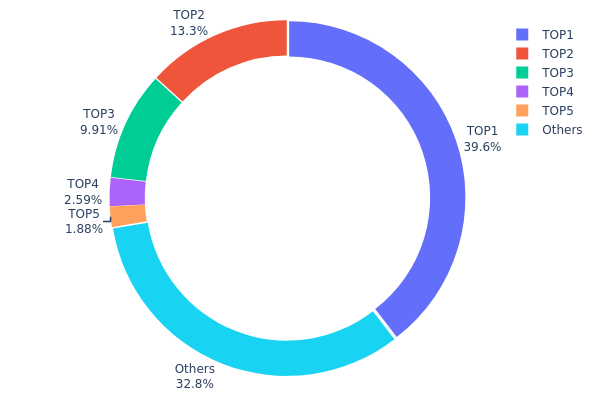
| Top |
Address |
Holding Qty |
Holding (%) |
| 1 |
0x6f1e...9f7f8a |
25568.03K |
39.55% |
| 2 |
0x9642...2f5d4e |
8569.17K |
13.25% |
| 3 |
0x0e85...df51a6 |
6403.68K |
9.90% |
| 4 |
0x1802...48daec |
1672.75K |
2.58% |
| 5 |
0x57ba...ecc73e |
1215.27K |
1.87% |
| - |
Others |
21216.08K |
32.85% |
II. Core Factors Influencing BST's Future Price
Macroeconomic Environment
-
Monetary Policy Impact: Central bank policy decisions and interest rate trajectories significantly influence cryptocurrency valuations. Changes in monetary policy, particularly from major central banks, create shifts in investor risk appetite toward alternative assets like cryptocurrencies. Market expectations around future rate decisions can drive both bullish and bearish sentiment in the digital asset space.
-
Inflation Hedge Properties: During inflationary environments, cryptocurrencies like BST are increasingly viewed as alternative stores of value. As traditional currencies face purchasing power erosion due to inflation pressures, investors may allocate capital toward digital assets perceived as inflation hedges, potentially supporting price appreciation.
-
Geopolitical Risk Factors: Extreme global political events—such as economic crises, geopolitical tensions, or threats to traditional fiat currency stability—can drive investors toward cryptocurrencies as safe-haven assets. Such scenarios may increase demand and support price growth during periods of heightened uncertainty.
Market Sentiment and Institutional Dynamics
- Spot Market Development: The emergence and growth of regulated cryptocurrency financial products, such as spot market instruments, continues to expand institutional participation. Institutional investor interest and capital inflows into cryptocurrency markets have historically coincided with price appreciation cycles and increased market maturity.
III. BST Price Forecast 2025-2030
2025 Outlook
- Conservative Forecast: $0.01455 - $0.02466
- Neutral Forecast: $0.02466
- Optimistic Forecast: $0.03403 (requiring sustained market sentiment and ecosystem development)
2026-2027 Medium-term Outlook
- Market Stage Expectation: Consolidation with gradual recovery, driven by ecosystem expansion and increasing institutional adoption
- Price Range Prediction:
- 2026: $0.01819 - $0.04372 (19% upside potential)
- 2027: $0.02375 - $0.04238 (48% cumulative growth)
- Key Catalysts: Platform upgrades, increased user adoption, DeFi integration expansion, and market sentiment recovery
2028-2030 Long-term Outlook
- Base Case Scenario: $0.02131 - $0.058 (60% growth potential by 2028, assuming steady ecosystem development and moderate market conditions)
- Optimistic Scenario: $0.03243 - $0.0692 (97-139% cumulative growth by 2029-2030, contingent on major partnerships and widespread institutional adoption)
- Transformational Scenario: $0.06073 - $0.0692 (139% growth by 2030, assuming breakthrough technological innovations, regulatory clarity, and mainstream market penetration)
- 2025-12-27: BST trading at foundational levels (consolidation phase with medium-term growth trajectory)
| 年份 |
预测最高价 |
预测平均价格 |
预测最低价 |
涨跌幅 |
| 2025 |
0.03403 |
0.02466 |
0.01455 |
0 |
| 2026 |
0.04372 |
0.02935 |
0.01819 |
19 |
| 2027 |
0.04238 |
0.03654 |
0.02375 |
48 |
| 2028 |
0.058 |
0.03946 |
0.02131 |
60 |
| 2029 |
0.0692 |
0.04873 |
0.03314 |
97 |
| 2030 |
0.06073 |
0.05896 |
0.03243 |
139 |
Blocksquare (BST) Professional Investment Strategy and Risk Management Report
IV. BST Professional Investment Strategy and Risk Management
BST Investment Methodology
(1) Long-term Holding Strategy
- Suitable for: Real estate tokenization believers, institutional investors seeking RWA exposure, and long-term blockchain infrastructure participants
- Operation Suggestions:
- Accumulate BST during market downturns, particularly when price falls below historical support levels
- Hold through market cycles to benefit from Blocksquare's infrastructure expansion across global markets
- Dollar-cost averaging (DCA) strategy to reduce timing risk and average entry prices
(2) Active Trading Strategy
- Technical Analysis Tools:
- Support and Resistance Levels: Monitor 0.0232 (all-time low as of December 5, 2025) as critical support and 0.9842 (all-time high on March 30, 2024) as resistance
- Volume Analysis: Track 24-hour trading volume movements to confirm trend reversals
- Trading Considerations:
- Monitor the 24-hour price volatility (currently trading between 0.02419 - 0.0251) for intraday opportunities
- Exercise caution given the 90.18% one-year decline, indicating significant market headwinds
BST Risk Management Framework
(1) Asset Allocation Principles
- Conservative Investors: 0.5% - 1% of portfolio allocation
- Moderate Investors: 1% - 3% of portfolio allocation
- Aggressive Investors: 3% - 5% of portfolio allocation
(2) Risk Hedging Approaches
- Portfolio Diversification: Combine BST holdings with established cryptocurrencies and traditional assets to reduce concentration risk
- Stop-Loss Implementation: Set stop-loss orders at 15-20% below entry price to limit downside exposure
(3) Secure Storage Solution
- Cold Storage Recommendation: Use hardware wallets for large BST holdings to eliminate counterparty risk
- Custody Consideration: Gate.com's secure asset management features for active traders requiring frequent trading access
- Security Best Practices: Enable multi-signature authentication, never share private keys, use hardware wallets for long-term storage, and maintain offline backups of recovery phrases
V. BST Potential Risks and Challenges
BST Market Risk
- Market Liquidity Risk: With only 3 exchange listings and limited trading volume (approximately 20,606.92 BST in 24-hour volume), BST faces significant liquidity constraints that could result in wider bid-ask spreads and slippage during large transactions
- Price Volatility: The token has experienced a devastating 90.18% decline over one year, indicating severe market pressure and investor confidence erosion
- Low Market Capitalization: At approximately $1.15 million in market cap (representing only 0.000077% market dominance), BST remains a micro-cap asset vulnerable to manipulation and sudden price swings
BST Regulatory Risk
- Real Estate Tokenization Regulation Uncertainty: As RWA (Real-World Asset) tokenization remains an evolving regulatory landscape globally, changes in real estate tokenization regulations could impact Blocksquare's business model and BST token utility
- Jurisdictional Compliance: Operating across 1000+ marketplaces exposes Blocksquare to diverse regulatory environments with varying requirements for tokenized asset trading and custody
BST Technology Risk
- Smart Contract Vulnerabilities: As an ERC-20 token on Ethereum, BST depends on Ethereum network security and potential smart contract vulnerabilities in Blocksquare's infrastructure
- Adoption Risk: The success of Blocksquare's platform depends on widespread adoption of real estate tokenization, which remains nascent and faces institutional adoption barriers
VI. Conclusion and Action Recommendations
BST Investment Value Assessment
Blocksquare represents a pioneering project in real estate tokenization with significant long-term potential within the emerging RWA sector. However, the dramatic 90.18% one-year price decline reflects substantial near-term headwinds and low market confidence. The project's infrastructure supporting 1000+ global marketplaces and entry into DeFi through Oceanpoint.fi demonstrate solid fundamentals. Yet current market conditions—characterized by minimal trading volume, limited exchange listings, and micro-cap status—present both opportunity for early believers and substantial downside risk for mainstream investors. The tokenization of real estate remains a compelling long-term vision, but execution and regulatory approval remain uncertain.
BST Investment Recommendations
✅ Beginners: Start with minimal allocation (0.1-0.5% of crypto portfolio) only if you have deep conviction in real estate tokenization; otherwise, wait for market stabilization signals and increased adoption metrics
✅ Experienced Investors: Consider 1-3% allocation with dollar-cost averaging approach; implement strict stop-losses and use this as a speculative play on RWA sector growth rather than core holding
✅ Institutional Investors: Evaluate based on Blocksquare's tokenization partnerships and platform adoption metrics; consider direct investment in Blocksquare Inc. rather than BST token speculation if pursuing real estate tokenization exposure
BST Trading Participation Methods
- Gate.com Spot Trading: Direct purchase and sale of BST tokens with real-time market pricing and secure custody options
- Gate.com Mobile App: Convenient access to BST trading with price alerts and portfolio tracking features
- Dollar-Cost Averaging (DCA): Use Gate.com's scheduled purchase features to systematically accumulate BST over time, reducing timing risk
Cryptocurrency investment carries extreme risk and volatility. This report does not constitute investment advice. Investors should make decisions based on personal risk tolerance and conduct thorough due diligence. Consult with professional financial advisors before making investment decisions. Never invest more than you can afford to lose completely. Past performance does not guarantee future results.
FAQ
Is BST stock a good buy?
BST is a Strong Buy based on technical analysis indicators. RSI (14) is 56.26, suggesting neutral momentum with bullish potential. Current market conditions support entry positions for long-term investors.
How risky is investing in BST stock?
BST involves emerging technology exposure with notable volatility. High-risk assets offer potential high returns but require careful consideration of your risk tolerance before investing.
What factors influence BST price movements?
BST price movements are influenced by market demand and supply dynamics, trading volume, investor sentiment, macroeconomic conditions, and broader cryptocurrency market trends. Regulatory news, technology developments, and adoption rates also play significant roles in price fluctuations.
What is the historical price trend of BST?
BST experienced a slight downward trend recently, declining from $41.24 on December 19 to $39.82 on December 23, 2025. The price shows moderate volatility with trading activity ranging from 110K to 174K in transaction volume during this period.
What are expert price predictions for BST in 2025?
Expert predictions suggest BST could reach $3.01 by December 2025. This forecast is based on current market analysis and trend assessments, indicating potential upward momentum through the year.
* The information is not intended to be and does not constitute financial advice or any other recommendation of any sort offered or endorsed by Gate.