The article, "2025 CAPS Price Prediction," offers an expert analysis of Ternoa (CAPS) in the NFT and blockchain sectors, forecasting price trends through 2030. It discusses CAPS' market position, historical price trajectory, and current market sentiment, providing detailed investment strategies and risk management insights. Readers will gain a comprehensive understanding of CAPS, suited for investors interested in long-term growth and high-risk, high-return opportunities. Keywords include 'CAPS price analysis,' 'NFT data transmission,' and 'investment strategy.' For quick navigation, key sections cover market analysis, price forecasts, investment strategies, and risk assessments.
Introduction: Market Position and Investment Value of CAPS
Ternoa (CAPS) is a specialized blockchain designed for transmitting data through NFTs using Polkadot's Substrate technology. Since its launch in 2021, the project has aimed to democratize blockchain and enable the general public to preserve their digital heritage across generations. As of December 2025, CAPS maintains a market capitalization of approximately $1,300,205.72, with a circulating supply of around 1.83 billion tokens, currently trading at $0.0007107 per token. This innovative asset is playing an increasingly significant role in the NFT data transmission and decentralized storage sectors.
This article will comprehensively analyze CAPS price trends through 2030, integrating historical patterns, market supply-demand dynamics, ecosystem development, and macroeconomic factors to provide investors with professional price forecasts and practical investment strategies.
Ternoa (CAPS) Market Analysis Report
I. CAPS Price History Review and Current Market Status
CAPS Historical Price Evolution Trajectory
- June 2021: Project launch with initial price of $0.0555, reaching an all-time high (ATH) of $0.227823 on June 8, 2021
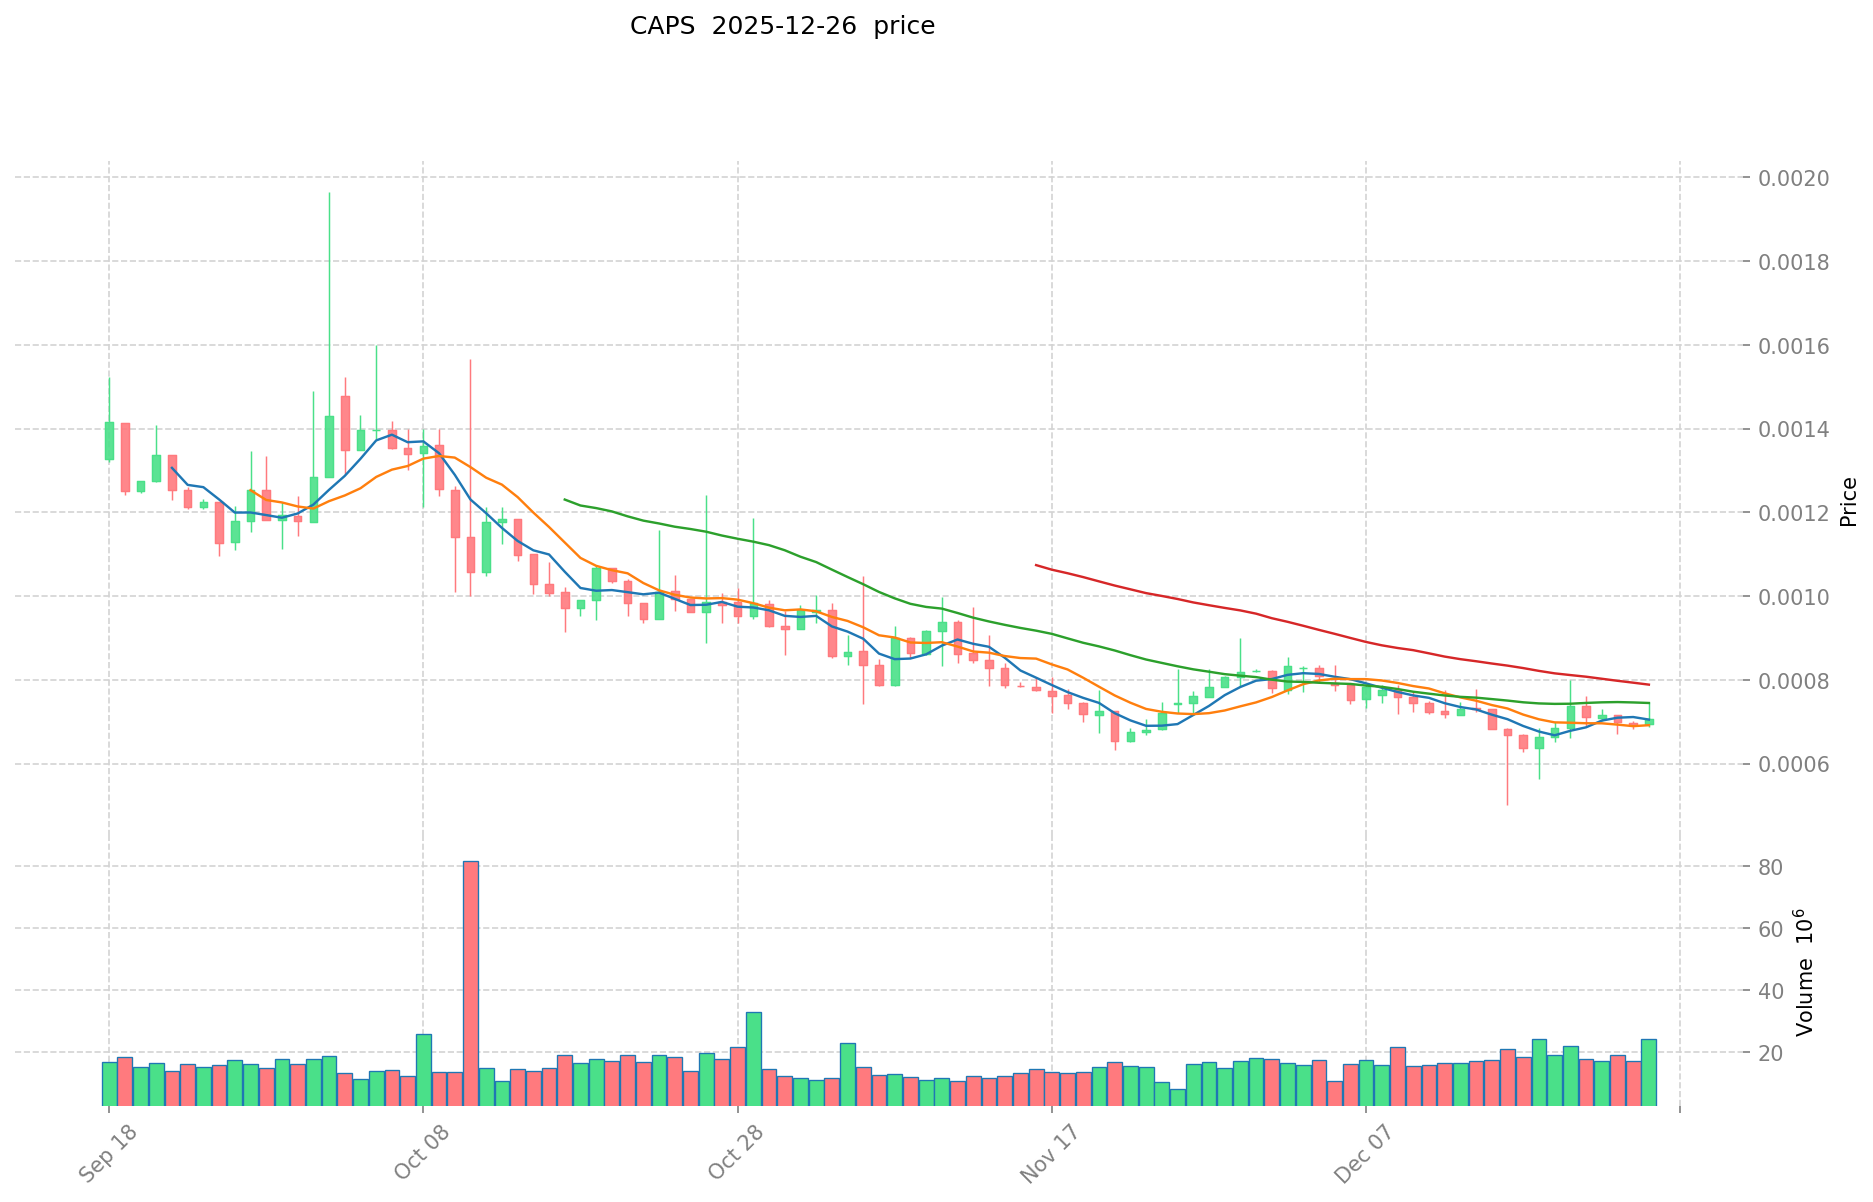
- 2021-2025: Extended market downturn period, with price declining significantly from peak levels
- December 2025: Recent price action showing volatility, with an all-time low (ATL) of $0.00054725 recorded on December 16, 2025
CAPS Current Market Situation
As of December 26, 2025, Ternoa (CAPS) is trading at $0.0007107, representing a 24-hour price increase of 2.35%. The token has shown modest positive momentum over the past week with a 7-day gain of 6.81%, though it remains under pressure with a 30-day decline of -4.83% and a significant year-to-date loss of -85.83%.
Key Market Metrics:
- Current Price: $0.0007107
- 24-Hour Volume: $18,100.41
- Market Capitalization: $1,300,205.72
- Fully Diluted Valuation (FDV): $1,773,897.39
- Circulating Supply: 1,829,471,951 CAPS (73.18% of total supply)
- Total Supply: 2,495,986,190 CAPS
- Maximum Supply: 2,500,000,000 CAPS
- Market Rank: #2432
- Market Dominance: 0.000055%
- Number of Holders: 8,133
The token has experienced extreme volatility throughout its lifecycle, with a decline of 99.72% from its initial offering price, reflecting the challenging market conditions faced by blockchain projects since the 2021 market peak. Current market sentiment shows "Extreme Fear" (VIX: 20), which typically characterizes periods of significant market stress and uncertainty.
Click to view current CAPS market price
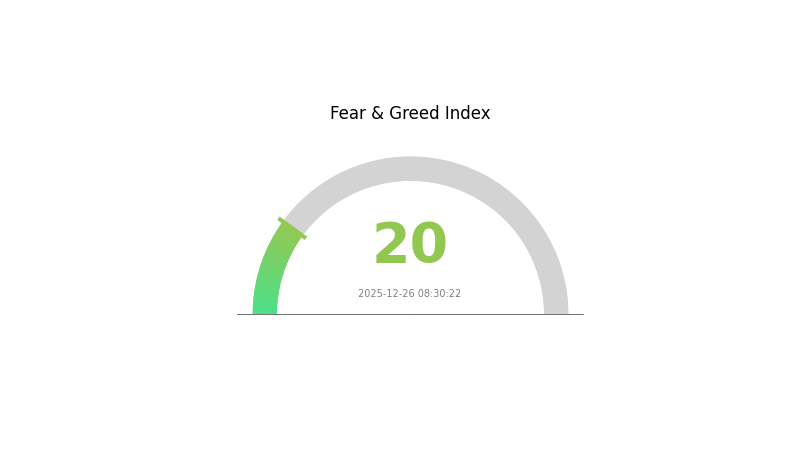
CAPS Market Sentiment Index
2025-12-26 Fear & Greed Index: 20 (Extreme Fear)
Click to view the current Fear & Greed Index
The cryptocurrency market is experiencing extreme fear, with the Fear & Greed Index dropping to 20. This indicates heightened market anxiety and pessimism among investors. Such extreme fear levels often present contrarian opportunities, as markets tend to rebound when sentiment reaches these lows. However, traders should remain cautious and conduct thorough research before making investment decisions. This is an important moment for long-term investors to reassess their portfolio strategies on Gate.com while managing risk carefully.
CAPS Holding Distribution
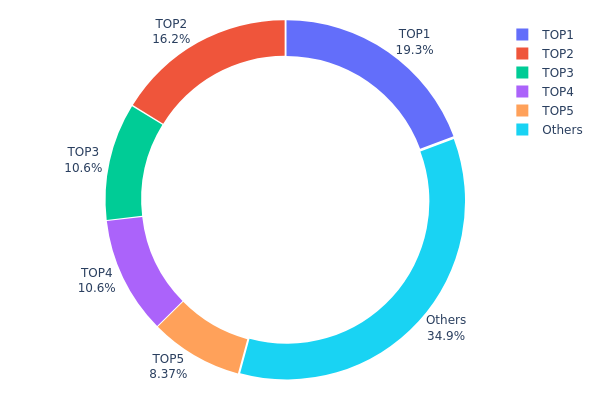
The address holding distribution chart illustrates the concentration of token ownership across blockchain addresses, serving as a critical metric for assessing the decentralization level and potential market manipulation risks of a cryptocurrency asset. By examining how holdings are distributed among top addresses and the broader holder base, analysts can evaluate whether token supply is concentrated in few hands or more equitably distributed across the network.
CAPS currently exhibits moderate concentration characteristics within its top-five addresses, which collectively control approximately 65.09% of the total token supply. The leading address (0x2a3d...ca2ede) commands 19.32% of holdings, while the second-largest holder (0x5fc0...a462ab) maintains 16.21%, indicating notable concentration among the largest stakeholders. The third address (0x0000...00dead), holding 10.60%, represents tokens in a burn wallet, effectively reducing circulating supply. The remaining top-five holders account for 10.59% and 8.37% respectively, demonstrating a gradual decline in individual holding sizes beyond the top two addresses. This distribution pattern suggests moderate centralization risk, as the top two non-burn addresses control over one-third of active supply.
The "Others" category, representing 34.91% of holdings distributed across numerous smaller addresses, indicates a meaningful secondary layer of token distribution that provides some counterbalance to top-holder concentration. However, the cumulative dominance of the top five addresses still presents potential volatility risks, as large position holders could significantly influence price movements through coordinated selling or market exits. The presence of a burn wallet among top holders is favorable, as it effectively removes tokens from circulation without representing an active threat vector. Overall, CAPS demonstrates a structure characteristic of projects in early-to-mid maturity stages, where institutional or early investors maintain substantial positions while retail participation gradually increases.
Click to view current CAPS holding distribution
| Top |
Address |
Holding Qty |
Holding (%) |
| 1 |
0x2a3d...ca2ede |
483008.55K |
19.32% |
| 2 |
0x5fc0...a462ab |
405414.28K |
16.21% |
| 3 |
0x0000...00dead |
265018.31K |
10.60% |
| 4 |
0xb6d7...936e31 |
264794.00K |
10.59% |
| 5 |
0xcbb5...d7971c |
209350.00K |
8.37% |
| - |
Others |
872414.86K |
34.91% |
Core Factors Influencing CAPS Future Price
Supply Mechanism
-
Token Supply Structure: CAPS has a total supply of 2,495,986,190 tokens, with a maximum supply capped at 2,500,000,000 tokens. This near-maximum supply allocation directly influences price dynamics and scarcity value in the market.
-
Current Impact: With circulating supply at approximately 1,829,471,951 CAPS as of November 2025, the token maintains relative scarcity at around 73% of total supply circulation. This controlled supply mechanism directly affects price valuation and investor perception of token scarcity.
Institutional and Whale Dynamics
- Major Holder Concentration: The top five wallet addresses collectively hold approximately 55.7% of CAPS tokens:
- Address 0x2a3d...ca2ede: 18.24% (456,038,380 tokens)
- Address 0x5fc0...a462ab: 16.50% (412,559,840 tokens)
- Address 0x0000...00dead: 10.60% (265,018,310 tokens, burn address)
- Address 0xb6d7...936e31: 10.59% (264,794,000 tokens)
- Address 0xcbb5...d7971c: 8.37% (209,350,000 tokens)
This significant concentration among major holders presents both liquidity risks and potential price stabilization factors depending on market sentiment and holder behavior.
Technology Development and Ecosystem Building
- NFT-Based Data Transmission Protocol: Ternoa has established itself as a core project in the crypto asset space through its NFT-powered data transmission functionality. This differentiated use case positions CAPS within the evolving NFT ecosystem and blockchain-enabled digital asset infrastructure.
III. 2025-2030 CAPS Price Forecast
2025 Outlook
- Conservative Forecast: $0.00062 - $0.00071
- Neutral Forecast: $0.00071
- Optimistic Forecast: $0.00084 (requires sustained market interest and positive ecosystem developments)
2026-2028 Medium-term Outlook
- Market Phase Expectation: Gradual recovery and consolidation phase with incremental growth momentum
- Price Range Forecast:
- 2026: $0.00053 - $0.00103
- 2027: $0.00063 - $0.00105
- 2028: $0.00059 - $0.00138
- Key Catalysts: Enhanced protocol adoption, increased community engagement, strategic partnerships, and positive regulatory developments in the cryptocurrency sector
2029-2030 Long-term Outlook
- Base Case Scenario: $0.00093 - $0.00151 (assuming stable market conditions and moderate adoption growth)
- Optimistic Scenario: $0.00099 - $0.00179 (contingent on accelerated ecosystem expansion and mainstream institutional interest)
- Transformational Scenario: $0.00179+ (extreme positive conditions including major technological breakthroughs and widespread market adoption)
- 2030-12-31: CAPS projected at $0.00179 (representing 88% potential cumulative gain from 2025 baseline)
Note: All price forecasts should be verified through Gate.com market data and should be considered speculative in nature. Market conditions and unforeseen events may significantly impact actual price performance.
| 年份 |
预测最高价 |
预测平均价格 |
预测最低价 |
涨跌幅 |
| 2025 |
0.00084 |
0.00071 |
0.00062 |
0 |
| 2026 |
0.00103 |
0.00078 |
0.00053 |
9 |
| 2027 |
0.00105 |
0.0009 |
0.00063 |
26 |
| 2028 |
0.00138 |
0.00098 |
0.00059 |
37 |
| 2029 |
0.00151 |
0.00118 |
0.00099 |
65 |
| 2030 |
0.00179 |
0.00134 |
0.00093 |
88 |
Ternoa (CAPS) Investment Strategy and Risk Management Report
IV. CAPS Professional Investment Strategy and Risk Management
CAPS Investment Methodology
(1) Long-term Holding Strategy
- Target Audience: Investors with medium to long-term investment horizons who believe in Ternoa's NFT data transmission technology and decentralization mission
- Operational Recommendations:
- Establish a strategic position during market downturns, taking advantage of the 85.83% year-over-year decline to accumulate at lower valuation levels
- Maintain consistent holdings through market cycles, as Ternoa's technology adoption may require extended development periods
- Set clear profit-taking targets at key resistance levels (0.05, 0.10, 0.15) based on historical trading ranges
(2) Active Trading Strategy
- Technical Analysis Tools:
- Support and Resistance Levels: Current 24-hour trading range of 0.0006878 to 0.000748 provides immediate trading boundaries; monitor historical resistance at 0.0055 and support at 0.00054725
- Volume Analysis: Track the 24-hour volume of 18,100.41 CAPS to identify breakout signals and momentum shifts
- Wave Trading Highlights:
- Capitalize on the recent 2.35% 24-hour gain momentum and 6.81% 7-day increase as potential entry points for short-term positions
- Implement stop-loss orders below the all-time low of 0.00054725 to protect against further downside risk
CAPS Risk Management Framework
(1) Asset Allocation Principles
- Conservative Investors: 1-2% of portfolio allocation to CAPS, given the project's early-stage nature and high volatility
- Aggressive Investors: 3-5% of portfolio allocation, focusing on long-term growth potential in the NFT data transmission sector
- Professional Investors: 5-10% of portfolio allocation with active hedging strategies and regular rebalancing
(2) Risk Hedging Solutions
- Portfolio Diversification: Balance CAPS holdings with established cryptocurrencies and traditional assets to reduce concentration risk
- Stop-Loss Implementation: Establish automatic stop-loss orders at 15-20% below entry prices to limit potential losses
(3) Secure Storage Solutions
- Custody Options: Consider professional custody services for large holdings, with Gate.com's platform security infrastructure for active trading positions
- Cold Storage Strategy: Store the majority of long-term holdings in secure offline storage with multi-signature protection
- Security Precautions: Enable two-factor authentication on all trading accounts, never share private keys, and regularly audit wallet security
V. CAPS Potential Risks and Challenges
CAPS Market Risk
- Extreme Price Volatility: With a 98.7% decline from ICO price and current 85.83% year-over-year loss, CAPS demonstrates extreme volatility and liquidity constraints
- Low Market Capitalization: At $1.77 million fully diluted valuation, CAPS remains highly susceptible to price manipulation and sudden liquidity crises
- Limited Trading Liquidity: Listed on only 2 exchanges with 24-hour volume of 18,100 CAPS, creating potential slippage issues for larger transactions
CAPS Regulatory Risk
- Cryptocurrency Regulatory Uncertainty: Evolving global regulatory frameworks for blockchain projects and NFT platforms may impact Ternoa's operational model
- Compliance Challenges: As data transmission through NFTs may face data protection regulations, regulatory compliance remains a significant concern
- Jurisdiction-Specific Restrictions: Various jurisdictions may impose restrictions on NFT-based data transmission, limiting market expansion opportunities
CAPS Technical Risk
- Development Execution Risk: Substrate-based blockchain implementation requires continuous technical excellence; any major bugs or security vulnerabilities could severely damage investor confidence
- Substrate Dependency: Reliance on Polkadot's Substrate framework creates exposure to upstream protocol changes and potential incompatibilities
- Adoption and Scalability Concerns: The core use case of meme preservation through NFTs requires substantial user adoption to achieve commercial viability
VI. Conclusion and Action Recommendations
CAPS Investment Value Assessment
Ternoa (CAPS) presents a specialized use case in blockchain technology focused on NFT-based data transmission and democratizing blockchain access. However, the project faces significant challenges: extreme price depreciation (98.7% decline from ICO), minimal market capitalization ($1.77 million), and limited exchange liquidity. While the underlying technology demonstrates innovation, the current market position reflects substantial skepticism regarding mainstream adoption and commercial viability. Investors should view this as a highly speculative, early-stage project requiring extended timeframes and significant risk tolerance.
CAPS Investment Recommendations
✅ Beginners: Exercise extreme caution; limit exposure to 0.5-1% of portfolio if interested, focus on understanding the project fundamentals before investing, and consider starting with minimal positions on Gate.com
✅ Experienced Investors: Conduct detailed technical due diligence on the Substrate implementation and NFT data transmission mechanism; consider this a venture-stage investment suitable for diversified crypto portfolios with 2-5% allocation
✅ Institutional Investors: Evaluate the project team's technical credentials, development roadmap, and market adoption metrics; consider only if fitting a venture capital allocation strategy with appropriate risk-adjusted returns expectations
CAPS Participation Methods
- Direct Trading on Gate.com: Access CAPS trading pairs with competitive fees and professional trading tools on the Gate.com platform
- Scheduled Purchase Plans: Utilize dollar-cost averaging strategies through regular purchases to mitigate timing risk during volatile market conditions
- NFT Platform Participation: Engage with Ternoa's native NFT ecosystem to better understand the practical applications of the data transmission technology
Cryptocurrency investment carries extreme risk and is highly speculative. This report does not constitute investment advice. Investors must carefully evaluate their risk tolerance and financial situation before making any investment decisions. It is strongly recommended to consult with professional financial advisors. Never invest more than you can afford to lose completely.
FAQ
Which coin price prediction 2025?
CAPS shows strong bullish potential for 2025. Based on technical analysis and market momentum, CAPS could reach $0.85-$1.20 range. Bitcoin, Ethereum, and altcoins like Solana are also predicted to continue growth trajectory throughout the year.
What is CAPS (Capstone) crypto and what factors influence its price?
CAPS (Capstone) is a cryptocurrency whose price is influenced by market cap, trading volume, adoption rate, and market liquidity. Higher market cap generally indicates greater stability, while increased trading volume and wider adoption drive price movements. Market sentiment and liquidity significantly impact price volatility.
What is the price target for CAPS token in 2024-2025?
Based on current market analysis, CAPS token price target for 2025 is estimated around $0. Limited data available for precise projections. Market conditions and project developments will significantly influence actual price performance.
Is CAPS a good investment and what are the risks?
CAPS offers growth potential as a price prediction asset with active market participation. Key risks include price volatility, market sentiment shifts, and cryptocurrency regulatory changes that may affect valuations.
* The information is not intended to be and does not constitute financial advice or any other recommendation of any sort offered or endorsed by Gate.