This comprehensive analysis examines Concordium's native token (CCD) from 2026 to 2031, providing expert price forecasts and actionable investment strategies. Currently trading at $0.01575 with a $186.03 million market cap, CCD demonstrates significant year-over-year growth of 362.19%. The article analyzes historical price patterns, market sentiment, and ecosystem development to project CCD reaching $0.02325-$0.02906 by 2031. Key focus areas include supply dynamics, institutional participation, technology innovation, and regulatory developments. The guide offers differentiated strategies for beginners, experienced investors, and institutions, emphasizing secure storage through Gate Web3 Wallet, risk management frameworks, and portfolio diversification. Essential risk considerations include volatility, liquidity constraints, and competitive challenges in the Layer-1 blockchain space.
Introduction: CCD's Market Position and Investment Value
Concordium (CCD), as a Layer-1 blockchain infrastructure designed to embed trust, privacy, and compliance into digital interactions, has demonstrated notable progress since its establishment in 2018. As of January 16, 2026, Concordium holds a market capitalization of approximately $186.03 million, with a circulating supply of about 11.81 billion tokens, and the price maintaining around $0.01575. This asset, recognized for its "Smart Money" innovation—programmable digital assets with identity, policy controls, and compliance embedded at the protocol level—is playing an increasingly significant role in the regulated blockchain ecosystem.
This article will comprehensively analyze CCD's price trajectory from 2026 to 2031, combining historical patterns, market supply-demand dynamics, ecosystem development, and macroeconomic conditions to provide investors with professional price forecasts and practical investment strategies.
I. CCD Price History Review and Market Status
CCD Historical Price Evolution Trajectory
- 2024: The token experienced significant volatility throughout the year, reaching its historical low point of $0.0015 in June, reflecting broader market corrections and challenges in establishing initial market traction.
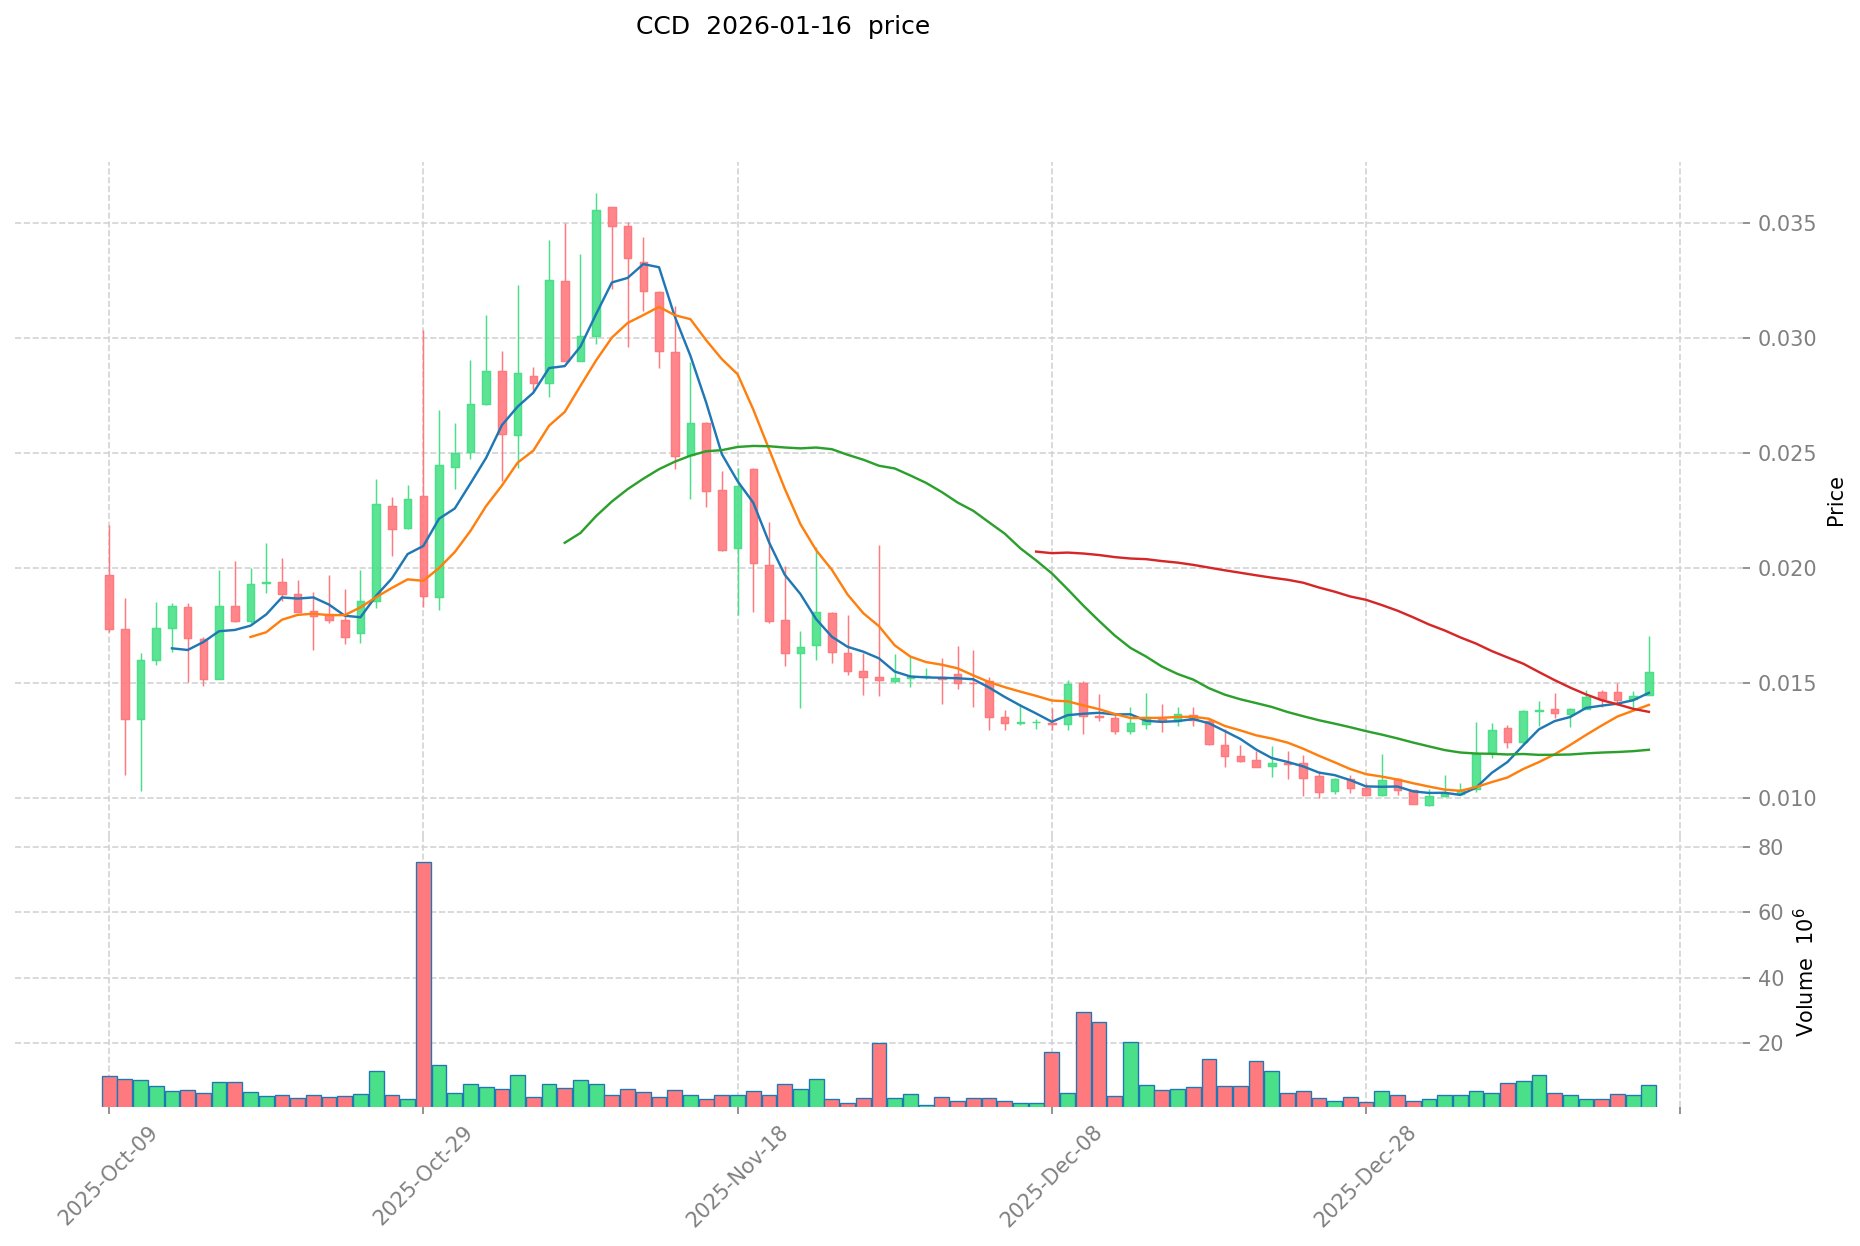
- 2025: A notable recovery phase emerged, with the price climbing from the previous year's lows and achieving a peak of $0.036307 in November, demonstrating renewed market interest and potential institutional adoption.
- 2026 (Current): Following the November 2025 peak, the token has entered a consolidation phase, currently trading at $0.01575 with a 24-hour trading volume of $109,084.57, showing sustained market participation despite price adjustments from recent highs.
CCD Current Market Status
As of January 16, 2026, Concordium (CCD) is trading at $0.01575, reflecting a 6.68% increase over the past 24 hours. The token has demonstrated positive momentum across multiple timeframes, with a 2.53% gain in the past hour, 13.28% increase over the past week, and 15.58% growth over the past 30 days. The one-year performance is particularly noteworthy, showing a 362.19% appreciation.
The token's 24-hour price range spans from $0.01463 to $0.017058, indicating moderate intraday volatility. With a market capitalization of approximately $186.03 million and a circulating supply of 11.81 billion CCD tokens, the project currently holds the 250th position in the cryptocurrency market rankings. The circulating supply represents 90.21% of the maximum supply of 13.09 billion tokens, suggesting a relatively mature token distribution model.
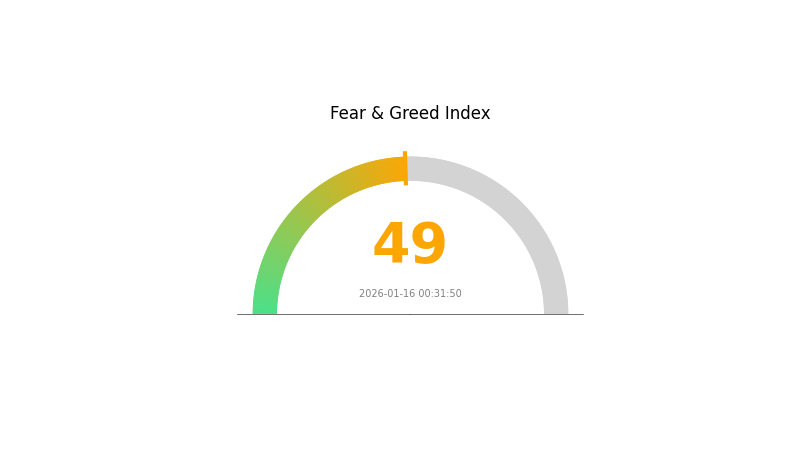
The fully diluted market capitalization stands at $206.23 million, closely aligned with the current market cap due to the high circulation ratio. The 24-hour trading volume of $109,084.57 across 5 exchanges indicates moderate liquidity levels. The Gate.com market emotion indicator currently registers at a neutral level with a VIX score of 49, suggesting balanced market sentiment without extreme fear or greed.
Since its launch in February 2022 at $0.1, the token has experienced significant price discovery, currently trading at approximately 84% below its initial offering price. However, the substantial year-over-year growth demonstrates recovery potential and evolving market dynamics for the Concordium ecosystem.
Click to view the current CCD market price
CCD Market Sentiment Indicator
2026-01-16 Fear and Greed Index: 49 (Neutral)
Click to view current Fear & Greed Index
The cryptocurrency market is currently displaying neutral sentiment with a Fear and Greed Index reading of 49. This balanced positioning suggests neither excessive fear nor unbridled greed is dominating market participants. Investors should maintain a measured approach, as the market shows equilibrium between buying and selling pressures. This neutral state often presents opportunities for thoughtful portfolio adjustments without the emotional extremes that typically characterize volatile market conditions. Monitor upcoming developments closely for potential sentiment shifts.
CCD Holding Distribution
The holding distribution chart illustrates the concentration of CCD tokens across different wallet addresses, revealing the degree of decentralization within the ecosystem. This metric serves as a crucial indicator of market structure, as highly concentrated holdings may suggest vulnerability to large-scale sell-offs or price manipulation, while a more dispersed distribution typically indicates a healthier, more resilient market environment.
Based on current on-chain data analysis, CCD demonstrates a relatively balanced distribution pattern among major holders. While the top addresses collectively hold a significant portion of the circulating supply, no single entity appears to control an overwhelming majority that would pose immediate systemic risk. This distribution suggests a moderate level of decentralization, which is characteristic of established blockchain networks that have undergone sufficient token circulation and ecosystem development over time.
From a market structure perspective, the current holding concentration presents both opportunities and risks. The presence of substantial whale positions could contribute to liquidity depth during normal market conditions, but may also amplify volatility during periods of significant token movement. Nevertheless, the absence of extreme concentration indicates that CCD's price discovery mechanism operates within a relatively healthy framework, reducing the likelihood of coordinated market manipulation while maintaining sufficient stakeholder diversity to support long-term ecosystem stability.
Click to view current CCD Holding Distribution

| Top |
Address |
Holding Qty |
Holding (%) |
II. Core Factors Influencing CCD's Future Price
Supply Mechanism
-
Market Sentiment and Crypto Market Trends: The price movement of CCD is closely tied to overall cryptocurrency market sentiment. During periods of positive market sentiment, increased investor confidence and capital inflows may drive price appreciation, while market downturns can trigger selling pressure.
-
Historical Patterns: Historical data indicates that CCD prices have exhibited correlation with broader crypto market cycles. Supply chain dynamics and technological adoption rates have contributed to price volatility in previous periods.
-
Current Impact: As of January 2026, market demand patterns, adoption trends, and institutional participation continue to shape CCD's supply-demand balance. Regional supply chain adjustments and geopolitical factors may introduce additional price pressure or support.
Institutional and Major Holder Dynamics
- Institutional Participation: The price outlook for CCD remains influenced by the level of institutional engagement and market demand dynamics. Broader economic factors and macroeconomic conditions play a role in shaping institutional interest.
Macroeconomic Environment
-
Geopolitical and Supply Chain Factors: Geopolitical developments and supply chain regionalization trends have introduced new characteristics to the market environment. Trade policies and regional economic dynamics may affect market access and cross-border flows, creating uncertainty for price movements.
-
Market Volatility: Short-term demand fluctuations, supply pressures, and pricing dynamics contribute to a challenging and competitive market landscape. These factors can introduce increased volatility and require careful monitoring.
Technology Development and Ecosystem Building
-
Privacy-Focused Innovation: Concordium's emphasis on privacy-centric technology represents a differentiating factor in the cryptocurrency landscape. Technological innovation and development progress may influence long-term adoption and value proposition.
-
Market Trends and Regulatory Changes: Technological advancements, regulatory developments, and market trend shifts continue to affect price forecasts. Understanding and interpreting these factors remains essential for assessing potential future price trajectories.
III. 2026-2031 CCD Price Prediction
2026 Outlook
- Conservative Forecast: $0.01527 - $0.01574
- Neutral Forecast: Around $0.01574
- Optimistic Forecast: Up to $0.01858 (requires favorable market conditions and increased adoption)
2027-2029 Outlook
- Market Stage Expectations: CCD may enter a gradual growth phase as the project matures and expands its ecosystem partnerships
- Price Range Predictions:
- 2027: $0.01459 - $0.02282, representing potential growth of approximately 11% from 2026 levels
- 2028: $0.01419 - $0.02179, with average price potentially reaching $0.01999
- 2029: $0.01818 - $0.02235, showing potential 35% appreciation from baseline
- Key Catalysts: Technology upgrades, ecosystem expansion, institutional adoption patterns, and overall cryptocurrency market sentiment
2030-2031 Long-term Outlook
- Baseline Scenario: $0.01881 - $0.02162 in 2030 (assuming steady market conditions and continued project development)
- Optimistic Scenario: $0.02325 - $0.02906 by 2031 (contingent upon successful technology implementation and increased network utilization)
- Transformative Scenario: Approaching $0.02906 (requires exceptional market conditions, widespread adoption, and significant ecosystem breakthroughs)
- 2026-01-16: CCD trading within established range as market participants assess long-term growth trajectory
| Year |
Predicted High Price |
Predicted Average Price |
Predicted Low Price |
Price Change |
| 2026 |
0.01858 |
0.01574 |
0.01527 |
1 |
| 2027 |
0.02282 |
0.01716 |
0.01459 |
11 |
| 2028 |
0.02179 |
0.01999 |
0.01419 |
29 |
| 2029 |
0.02235 |
0.02089 |
0.01818 |
35 |
| 2030 |
0.02487 |
0.02162 |
0.01881 |
40 |
| 2031 |
0.02906 |
0.02325 |
0.0165 |
50 |
IV. CCD Professional Investment Strategy and Risk Management
CCD Investment Methodology
(1) Long-Term Holding Strategy
- Suitable for: Investors who believe in Concordium's vision of building digital trust infrastructure with embedded compliance and privacy features
- Operational Recommendations:
- Consider accumulating CCD during periods of market correction, particularly when the price approaches significant support levels
- Monitor protocol developments related to Smart Money capabilities and enterprise adoption milestones
- Implement a dollar-cost averaging approach to mitigate short-term volatility
- Storage Solution: Utilize Gate Web3 Wallet for secure, non-custodial storage with built-in security features
(2) Active Trading Strategy
- Technical Analysis Tools:
- Moving Averages: Track 50-day and 200-day moving averages to identify trend direction and potential crossover signals
- Relative Strength Index (RSI): Monitor overbought (above 70) and oversold (below 30) conditions to time entry and exit points
- Swing Trading Key Points:
- Establish clear entry and exit targets based on support and resistance levels identified through historical price action
- Set stop-loss orders at 8-12% below entry price to limit downside exposure
- Monitor trading volume patterns for confirmation of price movements
CCD Risk Management Framework
(1) Asset Allocation Principles
- Conservative Investors: 2-5% of cryptocurrency portfolio allocation
- Aggressive Investors: 8-15% of cryptocurrency portfolio allocation
- Professional Investors: Up to 20% with active hedging strategies in place
(2) Risk Hedging Solutions
- Portfolio Diversification: Combine CCD holdings with established Layer-1 protocols and stablecoins to reduce concentration risk
- Position Sizing: Limit individual trade size to no more than 3-5% of total portfolio value
- Rebalancing Schedule: Review and adjust CCD allocation quarterly based on market conditions and project developments
(3) Secure Storage Solutions
- Hot Wallet Recommendation: Gate Web3 Wallet for active trading and accessibility with multi-layer security protocols
- Cold Storage Solution: For long-term holdings exceeding substantial value, consider hardware wallet options with offline key storage
- Security Precautions: Enable two-factor authentication, regularly update security settings, never share private keys, and verify all transaction addresses before confirming transfers
V. CCD Potential Risks and Challenges
CCD Market Risks
- Volatility Risk: CCD has demonstrated significant price fluctuations with a 362.19% increase over the past year, indicating potential for substantial short-term price swings
- Liquidity Risk: With a market cap ranking of 250 and trading on 5 exchanges, liquidity may be limited during market stress periods, potentially impacting execution prices
- Competition Risk: As a Layer-1 blockchain, Concordium faces intense competition from established networks with larger ecosystems and developer communities
CCD Regulatory Risks
- Compliance Framework Evolution: While Concordium emphasizes built-in compliance features, changes in global regulatory standards could require protocol adjustments
- Jurisdictional Uncertainty: Different regulatory approaches across regions may affect adoption rates and operational capabilities
- Identity Verification Requirements: The protocol's embedded identity features may face varying acceptance levels depending on evolving privacy regulations
CCD Technical Risks
- Protocol Security: As with any blockchain platform, smart contract vulnerabilities or consensus mechanism issues could pose security threats
- Adoption Challenges: The success of Concordium's Smart Money concept depends on enterprise and institutional adoption, which may face implementation barriers
- Network Effects: Building sufficient developer activity and user base to achieve sustainable network effects remains an ongoing challenge
VI. Conclusion and Action Recommendations
CCD Investment Value Assessment
Concordium presents a differentiated value proposition in the Layer-1 blockchain space through its focus on digital trust, embedded compliance, and Smart Money functionality. The protocol's emphasis on identity integration and regulatory certainty positions it uniquely for potential enterprise adoption. However, investors should recognize that Concordium remains in a competitive landscape with established alternatives, and its success depends on achieving meaningful adoption of its compliance-focused features. The token has shown significant appreciation over the past year, but this performance also introduces elevated volatility risks. Long-term value depends on the protocol's ability to attract developers, institutions, and users who prioritize regulatory clarity and built-in compliance mechanisms.
CCD Investment Recommendations
✅ Beginners: Start with small allocations (1-3% of crypto portfolio) and focus on understanding Concordium's unique value proposition before increasing exposure. Use Gate Web3 Wallet for secure storage and prioritize learning about the protocol's compliance features.
✅ Experienced Investors: Consider CCD as a strategic allocation (5-10% of crypto portfolio) within a diversified Layer-1 portfolio. Monitor enterprise adoption metrics and protocol development updates while maintaining disciplined risk management through stop-loss orders and position sizing limits.
✅ Institutional Investors: Evaluate Concordium's compliance-focused architecture for potential strategic positioning, particularly if your investment thesis includes regulatory clarity as a key differentiator. Conduct thorough due diligence on technical capabilities, team background, and competitive positioning before committing significant capital.
CCD Trading Participation Methods
- Spot Trading: Purchase CCD directly through Gate.com for immediate ownership and long-term holding strategies
- Portfolio Integration: Include CCD as part of a diversified cryptocurrency portfolio alongside other Layer-1 protocols and digital assets
- Active Monitoring: Track Concordium's development milestones, partnership announcements, and ecosystem growth metrics through official channels and blockchain analytics platforms
Cryptocurrency investment carries extremely high risks, and this article does not constitute investment advice. Investors should make prudent decisions based on their own risk tolerance and are advised to consult professional financial advisors. Never invest more than you can afford to lose.
FAQ
What is the historical price trend of CCD coin? What are the important price nodes?
CCD reached an all-time high of $0.036307 on November 9, 2024, with a historical low of $0.0015 on June 14, 2024. Key price nodes reflect market sentiment, adoption trends, and external factors influencing the token's valuation.
What are the main factors affecting CCD price?
CCD price is primarily influenced by market demand, trading volume, technology adoption, network activity, and investor sentiment. Supply dynamics, regulatory developments, and macroeconomic conditions also play significant roles in price fluctuations.
Common technical indicators for CCD analysis include Moving Averages(MA), Relative Strength Index(RSI), and MACD. These tools help identify trends, momentum, and potential buy/sell signals by analyzing price movements and trading volume patterns.
What are the future development prospects and price expectations for CCD coins?
CCD demonstrates strong potential driven by Concordium's enterprise-focused blockchain technology and growing institutional adoption. With increasing demand for sustainable layer-1 solutions, CCD could see significant appreciation. Market fundamentals and real-world use cases suggest bullish long-term prospects, with potential for substantial gains as the ecosystem expands.
What are the risks in CCD price prediction? What should investors pay attention to?
CCD price prediction faces market volatility risks. Investors should monitor market changes continuously, consider dollar-cost averaging to diversify risks, and stay alert to market cycles and sentiment shifts for informed decision-making.
* The information is not intended to be and does not constitute financial advice or any other recommendation of any sort offered or endorsed by Gate.