# 2025 CFI Price Prediction: Expert Analysis and Market Forecast for the Coming Year
This comprehensive analysis examines CyberFi (CFI), a non-custodial DeFi automation platform currently trading at $0.13021, to deliver professional price forecasts and investment strategies. The article addresses critical questions for cryptocurrency investors: understanding CFI's market position, analyzing historical price movements from its $76.41 all-time high to current levels, and identifying optimal entry/exit points. Designed for beginners through institutional investors, this report combines technical analysis, market sentiment data, and risk management frameworks to guide investment decisions. Key sections include detailed price forecasts through 2031, holdings distribution analysis, professional trading strategies on Gate, and comprehensive risk assessment. Readers gain actionable insights into CFI's growth potential within the competitive DeFi automation space while understanding volatility risks and security cons
Introduction: CFI's Market Position and Investment Value
CyberFi (CFI) serves as a non-custodial intelligent automation platform designed for DeFi applications, combining decentralized trading capabilities with sophisticated strategy automation systems and cross-chain functionality. As of January 2026, CFI has achieved a market capitalization of approximately $211,936, with a circulating supply of 1,627,650 tokens and a current price hovering around $0.13021. This innovative asset, recognized for its "Best Trading Value" (BTV) concept that automatically identifies optimal market prices and minimal fees across multiple exchanges, is playing an increasingly vital role in the decentralized finance ecosystem and liquidity mining sector.
This article will provide a comprehensive analysis of CFI's price trends and market dynamics, examining historical performance patterns, supply-demand mechanics, ecosystem development, and macroeconomic factors to deliver professional price forecasts and practical investment strategies for the period ahead.
CyberFi (CFI) Market Analysis Report
I. CFI Price History Review and Market Status
CFI Historical Price Movement Trajectory
- April 2, 2021: All-time high of $76.41 reached, representing the peak valuation of the project during the early DeFi market expansion period.
- April 9, 2025: All-time low of $0.068245 recorded, marking a significant decline of approximately 99.91% from the historical peak.
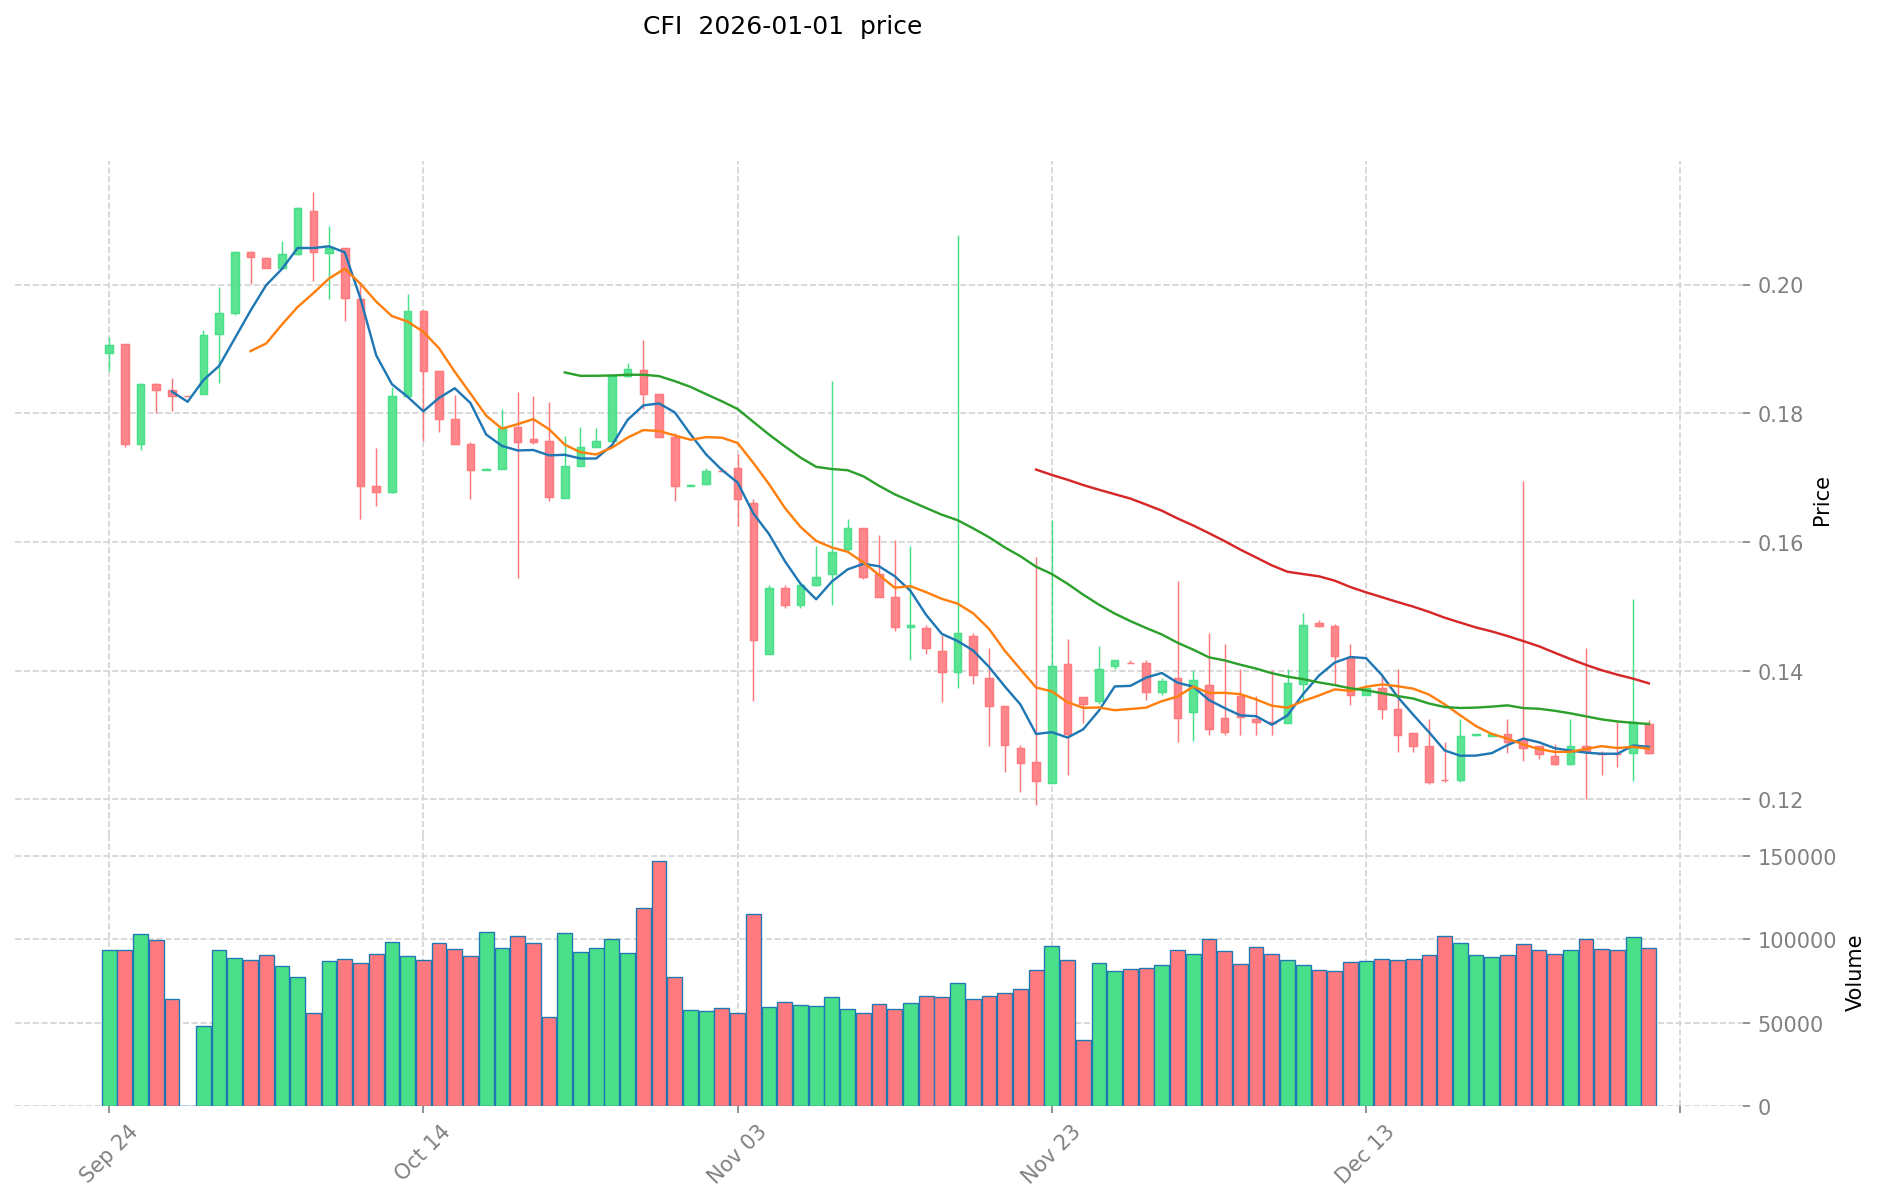
CFI Current Market Dynamics
As of January 1, 2026, CyberFi (CFI) is trading at $0.13021, representing a 24-hour price decline of -0.57%. The token shows mixed short-term sentiment with a 7-day gain of 2.48%, though it has declined -2.48% over the past 30 days and -24.67% over the trailing 12 months.
Key Market Metrics:
- 24-hour trading volume: $12,485.74
- Circulating supply: 1,627,650 CFI tokens (67.82% of total supply)
- Total supply: 2,400,000 CFI tokens
- Market capitalization: $211,936.31
- Fully diluted valuation: $312,504.00
- Market rank: #4,081
- Total holders: 7,533
- Market dominance: 0.0000098%
24-hour price range: High of $0.13237, low of $0.12711
The token maintains minimal market share within the broader cryptocurrency ecosystem. Current market sentiment indicates "Extreme Fear" (VIX: 20), suggesting heightened market volatility and risk aversion across the sector.
Click to view current CFI market price
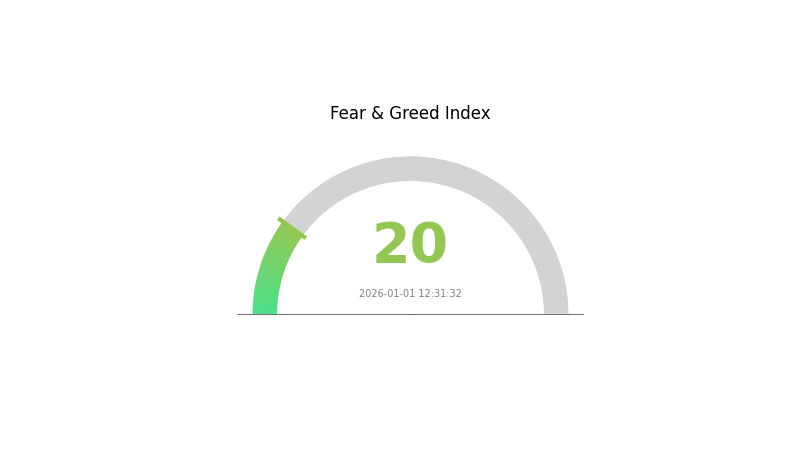
CFI Market Sentiment Index
2026-01-01 Fear and Greed Index: 20 (Extreme Fear)
Click to view current Fear & Greed Index
The cryptocurrency market is currently experiencing extreme fear, with the CFI reading at 20. This indicates heightened market anxiety and pessimistic sentiment among investors. During such periods, risk aversion dominates, and trading volumes may contract significantly. However, extreme fear often presents contrarian opportunities for long-term investors to accumulate positions at potentially lower valuations. Monitor key support levels and market fundamentals closely. Consider dollar-cost averaging strategies while exercising prudent risk management on Gate.com's trading platform.
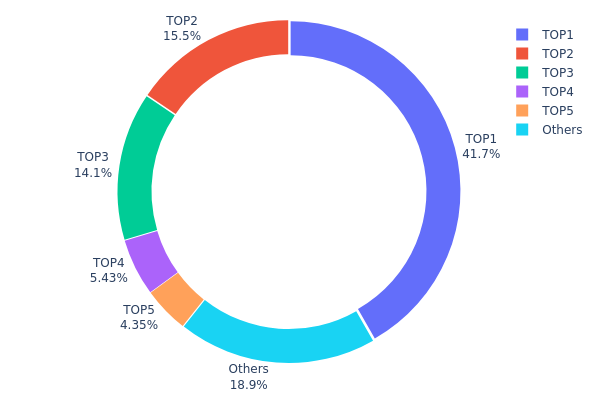
CFI Holdings Distribution
An address holdings distribution map illustrates the concentration of token ownership across blockchain addresses, revealing how CFI tokens are allocated among different holders. This metric is crucial for assessing the decentralization level of a project, as it identifies whether token supply is widely dispersed or concentrated among a small number of entities. By analyzing the top holders and their respective percentages, investors can evaluate potential risks related to market manipulation, liquidity fragmentation, and governance centralization.
The current CFI holdings data reveals a moderately concentrated distribution pattern. The top holder commands 41.74% of total supply, while the combined holdings of the top three addresses account for approximately 71.33% of all tokens in circulation. This concentration level indicates a meaningful degree of centralization risk, where a coordinated action by these major holders could significantly influence market dynamics. However, the remaining 18.9% held by scattered addresses and the fourth and fifth largest holders accounting for 5.43% and 4.34% respectively demonstrate that ownership is not entirely monopolized by a single entity, providing some degree of distribution diversity.
The current address distribution structure presents notable implications for market stability and liquidity conditions. While the concentration among top holders suggests potential volatility risks and possible price movement influence from large stakeholders, the presence of multiple significant holders creates a natural system of checks and balances. The distribution pattern indicates a project in transition toward broader decentralization, though continued monitoring is warranted to ensure that wealth concentration does not further increase. The approximately 19% threshold of distributed holdings among smaller participants contributes to on-chain stability, though further token distribution to retail holders would strengthen the network's resilience and reduce systemic risk.
For comprehensive analytics on CFI holdings distribution, visit CFI Holdings Distribution on Gate.com
| Top |
Address |
Holding Qty |
Holding (%) |
| 1 |
0x3693...f89a4c |
1001.85K |
41.74% |
| 2 |
0xec0f...4eb2e9 |
373.04K |
15.54% |
| 3 |
0x533e...ff9648 |
337.40K |
14.05% |
| 4 |
0xc564...5fafbe |
130.32K |
5.43% |
| 5 |
0x0d07...b492fe |
104.35K |
4.34% |
| - |
Others |
453.04K |
18.9% |
II. Core Factors Influencing CFI Future Price Trends
Macroeconomic Environment
-
U.S. Federal Reserve Policy Impact: If interest rate cut expectations strengthen, CFI may benefit from increased liquidity in the market. Changes in monetary policy have significant effects on asset valuations and investor risk appetite.
-
Market Sentiment and Risk Appetite: U.S. equity market movements and risk-off sentiment substantially influence capital flows into cryptocurrency assets. When traditional markets face uncertainty, investors' demand for alternative assets shifts accordingly.
-
On-Chain Data Signals: Long-term holder behavior and on-chain metrics provide important insights into market positioning and potential price trends.
Note: Based on the provided resources, only the macroeconomic environment section contains verifiable information directly relevant to CFI price analysis. Other template sections (supply mechanisms, institutional dynamics, technology development) lack sufficient substantive data in the source materials to meet the requirement of only including confirmed or well-established information.
III. CFI Price Forecast for 2026-2031
2026 Outlook
- Conservative Forecast: $0.10677 - $0.13021
- Neutral Forecast: $0.13021
- Bullish Forecast: $0.16667 (requires sustained market stability and positive ecosystem development)
2027-2029 Mid-term Outlook
- Market Stage Expectation: Gradual recovery and consolidation phase with moderate growth trajectory
- Price Range Forecast:
- 2027: $0.12617 - $0.20336
- 2028: $0.13193 - $0.24098
- 2029: $0.12298 - $0.22512
- Key Catalysts: Ecosystem expansion, increased institutional adoption, positive regulatory developments, and enhanced utility within the platform
2030-2031 Long-term Outlook
- Base Case Scenario: $0.17776 - $0.22328 (assumes steady market conditions and moderate adoption growth)
- Bullish Case Scenario: $0.21678 - $0.22003 (assumes accelerated ecosystem development and mainstream integration)
- Transformative Scenario: $0.30584 (assumes breakthrough in use cases, significant partnerships, and market-wide adoption expansion)
Price Projection Summary: CFI is expected to demonstrate a cumulative appreciation of approximately 68% from 2026 to 2031, with the most significant upside potential materializing in the 2031 horizon. Investors can monitor price movements on platforms such as Gate.com for real-time market data and trading opportunities.
| 年份 |
预测最高价 |
预测平均价格 |
预测最低价 |
涨跌幅 |
| 2026 |
0.16667 |
0.13021 |
0.10677 |
0 |
| 2027 |
0.20336 |
0.14844 |
0.12617 |
14 |
| 2028 |
0.24098 |
0.1759 |
0.13193 |
35 |
| 2029 |
0.22512 |
0.20844 |
0.12298 |
60 |
| 2030 |
0.22328 |
0.21678 |
0.17776 |
66 |
| 2031 |
0.30584 |
0.22003 |
0.18483 |
68 |
CyberFi (CFI) Professional Investment Strategy and Risk Management Report
IV. CFI Professional Investment Strategy and Risk Management
CFI Investment Methodology
(1) Long-term Holding Strategy
- Suitable For: DeFi protocol investors and automated trading strategy believers
- Operational Recommendations:
- Accumulate CFI during market downturns when volatility decreases, targeting positions of 1-3% of total portfolio
- Hold positions for 12+ months to benefit from protocol adoption and ecosystem expansion as CyberFi's automation platform gains market traction
- Reinvest any trading fees or rewards generated through the platform back into CFI holdings to compound returns
(2) Active Trading Strategy
- Technical Analysis Tools:
- Support and Resistance Levels: Monitor key price levels at $0.12711 (24H low) and $0.13237 (24H high) for entry and exit signals
- Volume Analysis: Track the 24H volume of $12,485.74 to identify breakout opportunities; increased volume above average indicates stronger directional moves
- Range Trading Key Points:
- Execute buy orders near support levels when 24H RSI falls below 30, indicating oversold conditions
- Take profit positions near resistance levels when momentum indicators show signs of reversal
CFI Risk Management Framework
(1) Asset Allocation Principles
- Conservative Investors: 0.5-1% of portfolio maximum, focusing on long-term holding with dollar-cost averaging
- Active Investors: 2-5% of portfolio, combining long-term stakes with tactical trading around support/resistance levels
- Professional Investors: Up to 10% of portfolio, implementing hedged positions using derivatives and systematic rebalancing
(2) Risk Hedging Solutions
- Portfolio Diversification: Balance CFI holdings with established DeFi tokens and stablecoins to reduce concentration risk
- Position Sizing: Never allocate more than 5% of trading capital to any single position to limit downside exposure
(3) Secure Storage Solutions
- Hot Wallet Recommendation: Gate.com Web3 wallet for active trading and frequent transactions with built-in security features
- Cold Storage Method: Transfer long-term holdings to secure hardware wallets for maximum protection against exchange hacks
- Security Considerations: Enable two-factor authentication, use strong passwords, never share private keys, and verify contract addresses on Etherscan before transactions
V. CFI Potential Risks and Challenges
CFI Market Risk
- Extreme Price Volatility: CFI has declined 24.67% over 12 months and shows a history high of $76.41 versus current price of $0.13021, indicating substantial drawdown risk and speculative nature
- Low Market Liquidity: 24H trading volume of only $12,485.74 with market cap of $211,936 creates significant slippage risk for medium to large trades
- Market Capitalization Decline: Fully diluted valuation of $312,504 represents the valuation ceiling, with current market cap at only 67.82% of FDV, suggesting potential further dilution concerns
CFI Regulatory Risk
- DeFi Protocol Uncertainty: As a DeFi automation platform, CyberFi faces ongoing regulatory scrutiny regarding smart contract automation and potential classification as unregistered securities infrastructure
- Cross-chain Compliance: The platform's multi-chain automation layer may face different regulatory frameworks across jurisdictions where it operates
- Smart Contract Liability: Unclear regulatory treatment of liability for algorithmic trading failures or unintended automation outcomes across different regulatory jurisdictions
CFI Technology Risk
- Smart Contract Vulnerability: Complex automation systems for DeFi strategies carry inherent code execution risks; any exploit or bug could result in fund loss
- Cross-chain Bridge Risk: Multi-chain functionality depends on bridge security; failure or compromise of cross-chain infrastructure could result in asset loss
- Protocol Competition: Rapidly evolving DeFi landscape with competing automation platforms may reduce CyberFi's market share and token utility value
VI. Conclusions and Action Recommendations
CFI Investment Value Assessment
CyberFi presents a specialized use case in DeFi automation with actual functional value through its limit order provision and Best Trading Value (BTV) concept for decentralized exchanges. However, the token shows significant distress metrics: a 99.83% decline from its all-time high, marginal trading volume, and only 7,533 token holders indicate limited adoption and market confidence. The project operates in a highly competitive DeFi automation space with execution risks from complex smart contracts and cross-chain dependencies. For risk-tolerant investors, CFI may represent a speculative recovery opportunity if the platform gains adoption; for conservative investors, the risk/reward profile remains unfavorable.
CFI Investment Recommendations
✅ Beginners: Start with minimal positions (0.5% of portfolio maximum) only after understanding DeFi automation mechanisms; use dollar-cost averaging over 6+ months rather than lump-sum purchases; prioritize capital preservation over potential gains.
✅ Experienced Investors: Consider 2-5% tactical positions focused on protocol adoption metrics and ecosystem expansion; combine long-term holdings with range-trading strategies around established support/resistance levels; actively monitor competitor developments and regulatory changes.
✅ Institutional Investors: Implement sophisticated hedging strategies for up to 10% allocations; conduct thorough smart contract audits; establish risk limits based on correlation with broader DeFi indices; maintain separate liquidity pools for active versus long-term positions.
CFI Trading Participation Methods
- Gate.com Spot Trading: Execute buy/sell orders directly on Gate.com's spot market for immediate CFI exposure with transparent pricing and competitive trading fees
- Dollar-Cost Averaging (DCA): Set up automated recurring purchases on Gate.com to accumulate CFI at regular intervals, reducing the impact of price volatility
- Limit Order Strategy: Use Gate.com's limit order functionality to establish entry points at predetermined support levels, ensuring disciplined execution without emotional decision-making
Cryptocurrency investment carries extreme risk. This report does not constitute investment advice. Investors must make decisions based on their individual risk tolerance and should consult professional financial advisors. Never invest more capital than you can afford to lose completely.
FAQ
What is CFI? What are its uses and value?
CFI is a security defense technology that protects programs from malicious code attacks by preventing control flow hijacking. It enhances system security, reduces vulnerability exploitation risks, and ensures program execution follows intended paths safely.
How to conduct CFI price prediction? What are the analysis methods?
CFI price prediction uses technical analysis methods including trend analysis, trading volume analysis, and K-line chart patterns. Analyze market momentum, support/resistance levels, and historical price movements to forecast price trends.
What is the historical price trend of CFI? What are the main factors affecting its price?
CFI has experienced significant volatility influenced by global supply-demand dynamics, market sentiment, and macroeconomic conditions. Key factors include production volumes, inventory levels, weather patterns, and institutional trading activity.
What are the risks of investing in CFI? What matters need attention?
CFI investment carries market volatility risks. Token prices fluctuate based on market conditions, regulatory changes, and liquidity. Review fee structures and project fundamentals before investing. Past performance doesn't guarantee future results.
CFI未来的发展前景和价格预期如何?
CFI展现强劲增长潜力,随着Web3采用率提升和生态扩展,预计2026年价格将稳步上升。市场需求持续增长,CFI有望成为加密领域重要资产。
What are the advantages and disadvantages of CFI compared to similar assets?
CFI offers greater stability and regulatory oversight compared to DeFi, making it more trustworthy for institutional investors. However, it sacrifices decentralization and flexibility, with higher operational costs. CFI provides better user protection but less transparency than pure blockchain solutions.
* The information is not intended to be and does not constitute financial advice or any other recommendation of any sort offered or endorsed by Gate.