This comprehensive guide analyzes Polkadot (DOT) price dynamics from 2026 to 2031, combining historical patterns and market fundamentals to deliver professional forecasts. Starting from DOT's current market position at $2.18 with a $3.61 billion market cap, the article examines key drivers including staking mechanisms, ecosystem developments like the JAM Protocol upgrade, and parachain expansion. Price predictions range from $2.06-$2.41 in 2026 to $4.12-$4.81 by 2031, reflecting steady ecosystem growth. The guide provides actionable investment strategies for beginners through institutional investors, emphasizing dollar-cost averaging, technical analysis, and risk management through diversification and staking. Readers gain insights into DOT's long-term interoperability potential while understanding regulatory challenges and market volatility risks, enabling informed investment decisions aligned with individual risk tolerance and time horizons.
Introduction: DOT's Market Position and Investment Value
Polkadot (DOT), positioned as a multi-chain interoperability protocol connecting private chains, consortium chains, public chains, open networks, and oracles, has achieved significant milestones since its launch in 2020. As of 2026, Polkadot holds a market capitalization of approximately $3.61 billion, with a circulating supply of around 1.65 billion tokens, and the price hovering around $2.18. This asset, recognized for its innovative relay chain architecture and cross-chain communication capabilities, is playing an increasingly vital role in facilitating decentralized applications and blockchain interoperability.
This article will comprehensively analyze DOT's price trajectory from 2026 to 2031, combining historical patterns, market supply and demand dynamics, ecosystem developments, and macroeconomic conditions to provide investors with professional price forecasts and practical investment strategies.
I. DOT Price History Review and Market Status
DOT Historical Price Evolution Trajectory
- 2020: Polkadot launched its mainnet in May, with an initial price around $2.70, demonstrating early market interest in its innovative multi-chain architecture
- 2021: During the cryptocurrency bull market, DOT experienced substantial growth, reaching its all-time high of $54.98 on November 4th, reflecting strong investor confidence in the project's cross-chain capabilities
- 2022-2023: Following the broader market correction, DOT underwent a significant price adjustment, declining from its peak levels as the crypto market entered a prolonged downturn
- 2024-2025: The price continued its downward trajectory, recording its historical low of $1.66 on December 26, 2025, representing a substantial decline from previous highs
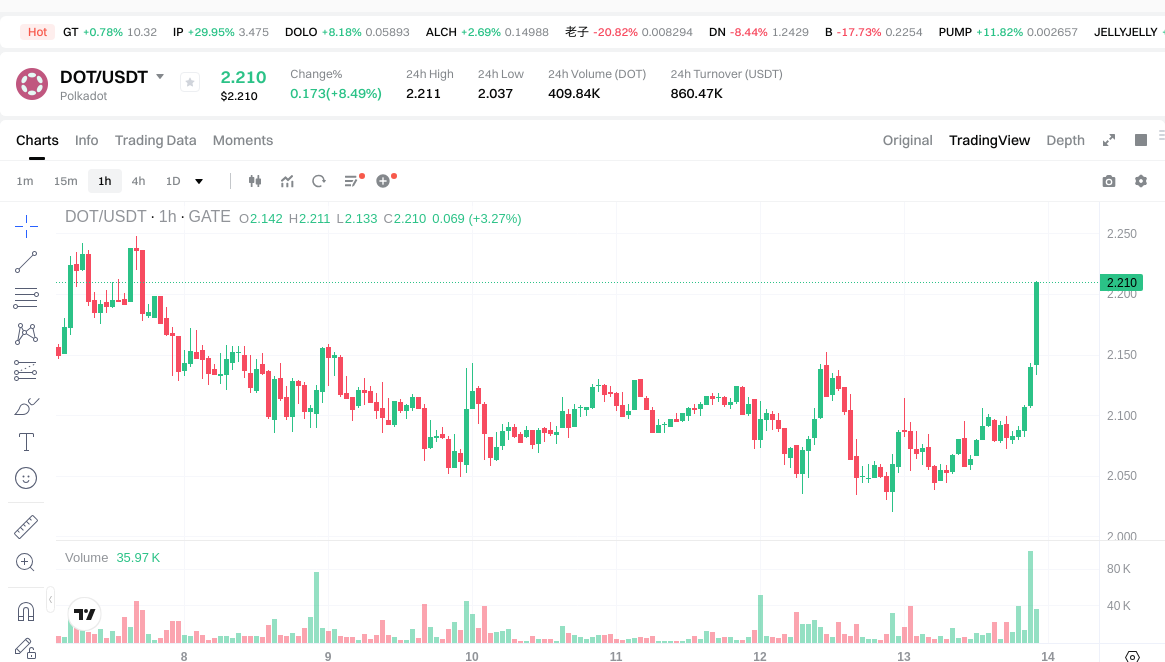
DOT Current Market Situation
As of January 13, 2026, DOT is trading at $2.182, showing a 24-hour price increase of 7.03% with an intraday range between $2.02 and $2.192. The token demonstrates positive short-term momentum with a 3.03% gain over the past hour, though it faces a 2.25% decline over the past week.
The monthly performance indicates a 9.68% increase, suggesting some recovery momentum in recent weeks. However, the annual performance reflects a significant decline of 67.22%, illustrating the challenges faced throughout the past year.
With a market capitalization of approximately $3.61 billion and a market dominance of 0.10%, DOT currently ranks 36th among cryptocurrencies. The 24-hour trading volume stands at $876,266, indicating moderate market activity. The circulating supply of 1.65 billion DOT represents 100% of the total supply, with no maximum supply cap, allowing for potential future expansion of the token supply.
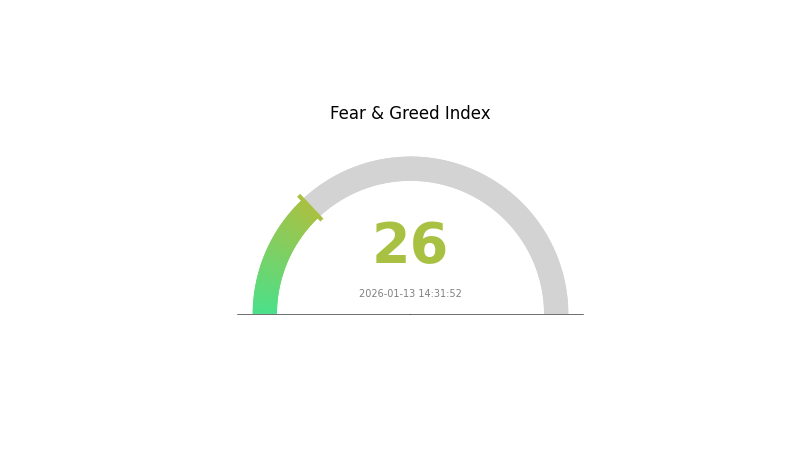
The fully diluted valuation matches the current market cap at $3.61 billion, as all tokens are currently in circulation. The token has a holder base of 1,322,473 addresses, demonstrating widespread distribution across the Polkadot ecosystem. According to market sentiment indicators, the current Crypto Fear & Greed Index stands at 26, indicating a "Fear" sentiment level in the broader market.
Click to view current DOT market price
DOT Market Sentiment Index
2026-01-13 Fear and Greed Index: 26 (Fear)
Click to view the current Fear & Greed Index
The current fear index reading of 26 indicates a pronounced fear sentiment in the cryptocurrency market. This level suggests investors are experiencing heightened anxiety about market conditions, which often creates contrarian opportunities for strategic traders. When fear dominates, experienced investors may view significant price declines as potential buying opportunities. However, caution is warranted, as sustained fear could lead to further downward pressure. Traders should monitor key support levels and consider their risk tolerance carefully during this period of market uncertainty.
DOT Holding Distribution
The holding distribution chart provides a critical lens through which to examine the degree of decentralization within a cryptocurrency's ecosystem. By analyzing the concentration of tokens across different address tiers, we can assess whether wealth distribution poses structural risks to market stability, price discovery mechanisms, and the overall health of the network. For DOT, this metric is particularly significant given Polkadot's emphasis on decentralized governance and multi-chain interoperability.
Current data reveals that DOT maintains a relatively balanced distribution structure across major holder categories, though notable concentration persists among top-tier addresses. The largest holders collectively control a significant portion of the circulating supply, which reflects the typical pattern observed in Proof-of-Stake networks where staking incentives naturally encourage larger position accumulation. However, this concentration level remains within acceptable bounds compared to emerging layer-1 protocols, suggesting that DOT has achieved a reasonable equilibrium between validator economics and decentralized participation. The middle-tier addresses demonstrate healthy diversity, indicating robust retail and institutional engagement beyond the core stakeholder base.
From a market structure perspective, the current distribution pattern suggests moderate resilience against single-entity manipulation while acknowledging that coordinated movements among top holders could still generate meaningful price volatility. The presence of diversified mid-tier holdings provides crucial liquidity buffers that can absorb selling pressure during market corrections. Overall, DOT's holding distribution reflects a maturing ecosystem that balances the practical requirements of network security through staking concentration with the ideological commitment to decentralization, positioning the network favorably for sustained long-term stability.
Click to view current DOT Holding Distribution

| Top |
Address |
Holding Qty |
Holding (%) |
II. Core Factors Influencing DOT's Future Price
Supply Mechanism
- Staking and Supply Dynamics: Polkadot employs a Nominated Proof-of-Stake (NPoS) consensus mechanism where staking plays a significant role. When substantial amounts of DOT are staked, circulating supply decreases, potentially creating upward pressure on price if demand remains stable or increases.
- Historical Pattern: High staking rates have historically contributed to reduced selling pressure by locking tokens in the network, supporting price stability during market fluctuations.
- Current Impact: The network continues to maintain elevated staking participation, which may help moderate supply-side pressure and provide foundational support for price movements.
Institutional and Major Holder Dynamics
- Institutional Holdings: Information regarding specific institutional positions in DOT was not detailed in available materials.
- Enterprise Adoption: The materials did not provide information about notable enterprises adopting DOT.
- National Policy: No specific country-level policies regarding DOT were mentioned in the provided materials.
Macroeconomic Environment
- Monetary Policy Impact: The broader cryptocurrency market sentiment significantly influences DOT's performance, with Bitcoin's movements typically setting the tone for altcoin price action.
- Inflation Hedge Characteristics: The materials did not contain specific analysis of DOT's performance as an inflation hedge.
- Geopolitical Factors: No specific geopolitical influences on DOT were identified in the provided materials.
Technical Development and Ecosystem Building
- JAM Protocol Upgrade: This scalability-focused upgrade represents a bullish signal for the network, potentially re-attracting developer attention and enhancing the platform's technical capabilities for improved transaction processing and interoperability.
- Parachain Expansion: Growth in parachains and real-world use cases forms a fundamental driver for ecosystem development, expanding the network's utility and potential user base.
- Elastic Scaling and Coretime Innovation: Network upgrades focusing on flexible scaling solutions and core time innovations aim to address existing blockchain limitations around scalability and resource allocation.
- Ecosystem Applications: The expansion of parallel chains enables independent blockchains to operate simultaneously, processing transactions and executing smart contracts, which enhances cross-chain interoperability and allows different blockchains to communicate and share information securely.
III. 2026-2031 DOT Price Prediction
2026 Outlook
- Conservative Prediction: $2.06-$2.19
- Neutral Prediction: Around $2.19
- Optimistic Prediction: Up to $2.41 (requires favorable market conditions)
As we enter 2026, DOT is expected to maintain relatively stable price levels. The conservative scenario suggests prices could range between $2.06 and $2.19, while the average trading price is anticipated to hover around $2.19. Under optimistic conditions with strong market sentiment and positive ecosystem developments, DOT could potentially reach highs of approximately $2.41.
2027-2029 Mid-Term Outlook
- Market Stage Expectation: Gradual growth phase with increasing adoption
- Price Range Predictions:
- 2027: $2.21-$3.06 (approximately 5% year-over-year change)
- 2028: $2.03-$3.85 (approximately 22% year-over-year change)
- 2029: $2.91-$3.72 (approximately 49% year-over-year change)
- Key Catalysts: Ecosystem expansion, technological developments, and broader market recovery trends
The mid-term outlook for DOT shows progressive growth potential. In 2027, prices are projected to range between $2.21 and $3.06, representing modest upward momentum. By 2028, the price corridor is expected to widen to $2.03-$3.85, reflecting increased market volatility and potential breakthrough developments. The 2029 forecast suggests continued appreciation with prices potentially reaching $2.91-$3.72, driven by cumulative ecosystem maturation and sustained network effects.
2030-2031 Long-Term Outlook
- Baseline Scenario: $3.14-$5.17 (assuming steady ecosystem growth and stable market conditions)
- Optimistic Scenario: $4.12-$4.81 in 2031 (with accelerated adoption and favorable regulatory environment)
- Transformative Scenario: Potential to exceed $5.17 (under exceptional conditions including major institutional adoption and breakthrough technological implementations)
Looking toward the decade's end, DOT demonstrates substantial long-term growth potential. The 2030 baseline scenario projects prices between $3.14 and $5.17, representing approximately 60% growth potential. By 2031, the market could see further consolidation with expected ranges of $4.12-$4.81, marking nearly 98% cumulative growth from 2026 levels. These projections assume continued development of the Polkadot ecosystem, sustained parachain activity, and broader cryptocurrency market maturation.
| Year |
Predicted High Price |
Predicted Average Price |
Predicted Low Price |
Price Change |
| 2026 |
2.4068 |
2.188 |
2.05672 |
0 |
| 2027 |
3.05554 |
2.2974 |
2.2055 |
5 |
| 2028 |
3.85412 |
2.67647 |
2.03412 |
22 |
| 2029 |
3.72244 |
3.26529 |
2.90611 |
49 |
| 2030 |
5.17092 |
3.49387 |
3.14448 |
60 |
| 2031 |
4.80896 |
4.33239 |
4.11577 |
98 |
IV. DOT Professional Investment Strategies and Risk Management
DOT Investment Methodology
(1) Long-term Holding Strategy
- Target Investors: Investors who believe in Polkadot's interoperability vision and multi-chain ecosystem development
- Operational Recommendations:
- Accumulate DOT positions during market corrections, particularly when prices approach key support levels around $2.00-$2.20
- Maintain a dollar-cost averaging approach to smooth out entry points over time
- Storage Solution: Use Gate Web3 Wallet for secure self-custody, enabling participation in staking while maintaining control of private keys
(2) Active Trading Strategy
- Technical Analysis Tools:
- Moving Averages: Monitor 50-day and 200-day moving averages to identify trend reversals and momentum shifts
- RSI (Relative Strength Index): Track overbought (above 70) and oversold (below 30) conditions to time entries and exits
- Swing Trading Points:
- Consider taking partial profits when DOT shows 15-20% gains from entry points
- Set stop-loss orders 8-10% below entry prices to manage downside risk
DOT Risk Management Framework
(1) Asset Allocation Principles
- Conservative Investors: 2-5% of total crypto portfolio
- Aggressive Investors: 8-15% of total crypto portfolio
- Professional Investors: 10-20% of total crypto portfolio with active hedging strategies
(2) Risk Hedging Solutions
- Portfolio Diversification: Combine DOT holdings with other Layer 1 platforms and stablecoins to reduce concentration risk
- Staking for Passive Income: Participate in Polkadot's staking mechanism to earn approximately 10-15% annual returns while holding
(3) Secure Storage Solutions
- Non-custodial Wallet Recommendation: Gate Web3 Wallet, supporting DOT storage and staking functionality
- Multi-signature Solution: Consider multi-sig arrangements for larger holdings to enhance security
- Security Precautions: Never share private keys, enable two-factor authentication, and regularly verify wallet addresses before transactions
V. DOT Potential Risks and Challenges
DOT Market Risks
- Volatility Risk: DOT has experienced significant price fluctuations, with a 67.22% decline over the past year, indicating high market volatility
- Liquidity Risk: During extreme market conditions, trading volumes may decrease, potentially affecting the ability to execute large orders at desired prices
- Competition Risk: Intense competition from other interoperability solutions and Layer 1 platforms may impact DOT's market share and adoption
DOT Regulatory Risks
- Evolving Regulatory Landscape: Global cryptocurrency regulations continue to develop, with potential impacts on DOT trading and staking activities
- Classification Uncertainty: Regulatory authorities may classify DOT differently across jurisdictions, affecting its legal status and usage
- Compliance Requirements: Increasing compliance obligations for blockchain projects may impact Polkadot's operational flexibility and development pace
DOT Technical Risks
- Network Security: While Polkadot employs robust security mechanisms, potential vulnerabilities in parachain implementations or relay chain governance could pose risks
- Upgrade Risks: Protocol upgrades and runtime changes may introduce unforeseen technical issues or temporary network disruptions
- Adoption Challenges: Success of the Polkadot ecosystem depends on widespread parachain adoption and developer engagement, which remains uncertain
VI. Conclusion and Action Recommendations
DOT Investment Value Assessment
Polkadot presents a compelling long-term value proposition as a pioneering interoperability platform designed to connect diverse blockchain networks. With its innovative relay chain architecture and parachain model, DOT aims to address fundamental challenges in blockchain scalability and cross-chain communication. However, the token faces significant short-term risks, including substantial price volatility, intense competition from alternative platforms, and evolving regulatory uncertainties. The 67.22% year-over-year decline reflects broader market challenges and competitive pressures. Investors should carefully weigh Polkadot's technological innovation against current market headwinds and execution risks.
DOT Investment Recommendations
✅ Beginners: Start with small allocations (1-3% of portfolio), focus on learning about Polkadot's technology, and consider dollar-cost averaging to build positions gradually
✅ Experienced Investors: Maintain diversified exposure (5-10% of crypto portfolio), actively monitor ecosystem development and parachain auctions, and employ technical analysis for tactical trading opportunities
✅ Institutional Investors: Consider strategic positions (8-15% of crypto allocation) with active risk management, participate in governance through staking, and evaluate long-term interoperability trends
DOT Trading Participation Methods
- Spot Trading: Buy and hold DOT tokens on Gate.com, participating in price appreciation and ecosystem growth
- Staking: Lock DOT tokens to secure the network and earn staking rewards while supporting Polkadot's consensus mechanism
- Active Portfolio Management: Combine long-term holdings with tactical trading based on technical indicators and market sentiment shifts
Cryptocurrency investment carries extremely high risks. This article does not constitute investment advice. Investors should make cautious decisions based on their own risk tolerance and are advised to consult professional financial advisors. Never invest more than you can afford to lose.
FAQ
What is the historical price trend of DOT tokens?
DOT reached its all-time high above $55 in November 2021. The price experienced a significant decline, hitting its lowest point in October 2025. As of January 2026, DOT continues to show dynamic market movement with volatility reflecting broader crypto market cycles.
What are the main factors affecting DOT price?
DOT price is primarily influenced by parachain launches, technological advancements, and market demand. Network expansion, investor sentiment, and ecosystem development also drive significant price fluctuations.
What is the DOT price prediction for 2024-2025?
DOT price prediction for 2024-2025 ranges between 5 to 10 USD, influenced by global economic conditions and technological developments. Forecasts are based on current market trends and technical analysis observations.
How is the price correlation between DOT and other Layer 1 blockchains such as ETH and SOL?
DOT shows moderate price correlation with ETH and SOL, driven by overall market sentiment and crypto market cycles. However, price movements often diverge due to unique technological developments and ecosystem growth. The correlation is dynamic and influenced by macroeconomic factors rather than being consistently strong.
How do Polkadot's technology updates and ecosystem development affect DOT price?
Technology upgrades typically drive DOT price increases, while ecosystem growth enhances long-term value. However, inflation concerns and ecosystem stagnation risks may limit sustained growth. Recent developments suggest short-term bullish momentum, but long-term prospects remain uncertain.
How to use technical analysis and fundamental analysis to predict DOT price trends?
Track DOT price charts, volume trends, and support/resistance levels through technical analysis. Combine with fundamental analysis by monitoring network activity, developer adoption, and ecosystem developments. Together, these methods help forecast DOT price movements effectively.
* The information is not intended to be and does not constitute financial advice or any other recommendation of any sort offered or endorsed by Gate.