This comprehensive analysis examines Ethena's native token (ENA) from multiple perspectives, providing investors with data-driven price forecasts and strategic investment guidance. Currently trading at $0.2286 with a market cap of $1.82 billion, ENA demonstrates significant recovery potential from its 2025 lows. The article integrates historical price patterns, market supply-demand dynamics, and ecosystem development factors to project ENA's trajectory through 2031, with predictions ranging from $0.215 to $0.525 depending on market conditions. Key sections address ENA's core mechanisms, institutional adoption trends, macroeconomic pressures, and the delta-neutral strategy underpinning the protocol. Detailed investment methodologies, risk management frameworks, and secure storage solutions via Gate Web3 Wallet are provided for diverse investor profiles. The analysis also identifies potential regulatory challenges and competitive risks while evaluating ENA's positioning as a crypto-native financial alternative
Introduction: ENA's Market Position and Investment Value
Ethena (ENA), positioned as an Ethereum-based synthetic dollar protocol providing crypto-native financial solutions, has established significant presence since its launch in 2024. As of 2026, ENA holds a market capitalization of approximately $1.82 billion, with a circulating supply of around 7.96 billion tokens, and a current price hovering near $0.2286. This asset, known as the foundation of the "Internet Bond" concept, is playing an increasingly vital role in decentralized finance infrastructure and dollar-denominated savings instruments.
This article will comprehensively analyze ENA's price trajectory from 2026 to 2031, combining historical patterns, market supply-demand dynamics, ecosystem development, and macroeconomic conditions to provide investors with professional price forecasts and practical investment strategies.
I. ENA Price History Review and Market Status
ENA Historical Price Evolution Trajectory
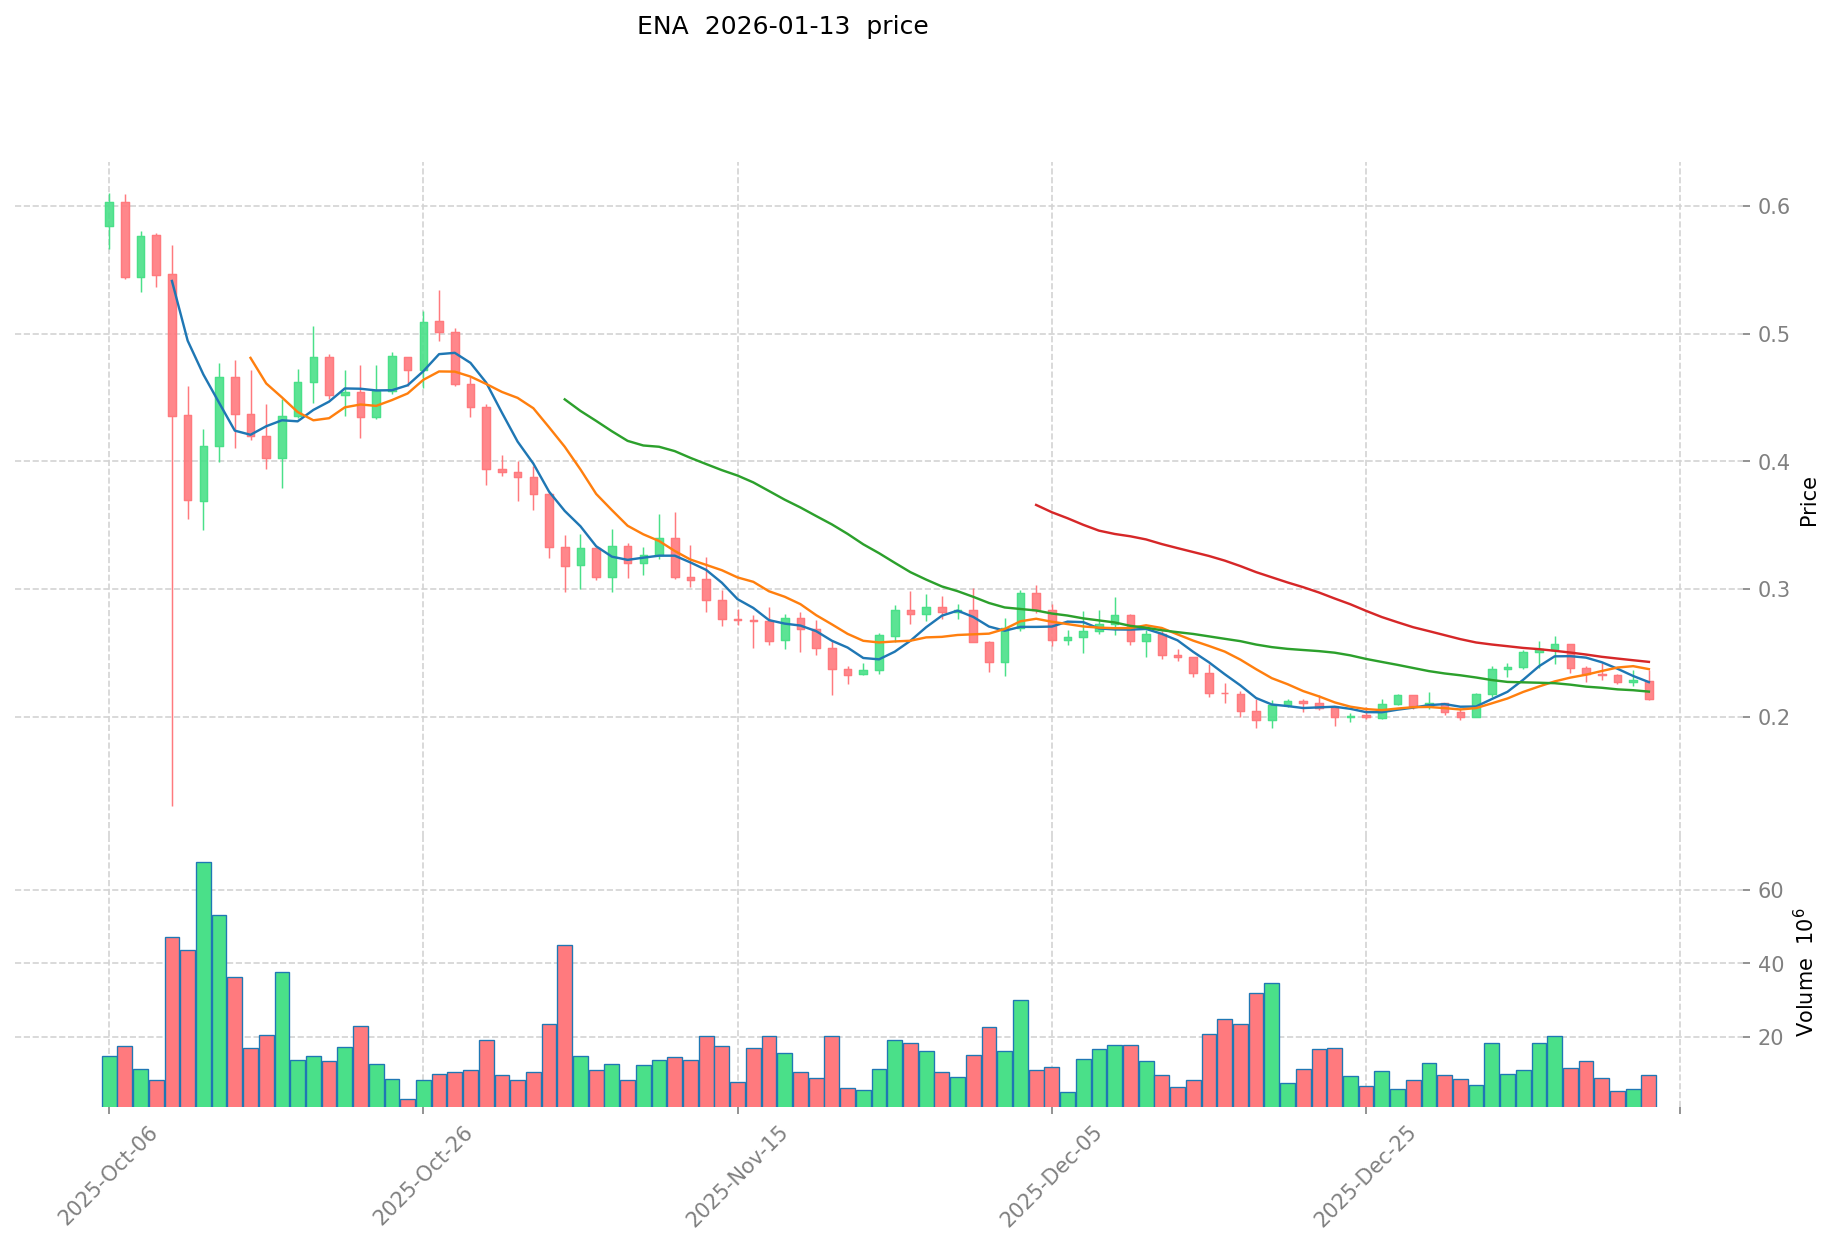
- 2024: Ethena launched in April, reaching a price peak of $1.5208 on April 11, marking a significant milestone in its early market performance
- 2025: The token experienced a substantial correction phase, with the price declining to its historical low of $0.1299 on October 10, representing a significant market adjustment period
- 2026: As of January 14, the price stands at $0.2286, showing a recovery from the previous year's low point but remaining well below the all-time high
ENA Current Market Status
Ethena (ENA) is currently trading at $0.2286, with a market capitalization of approximately $1.82 billion and a fully diluted valuation of $3.43 billion. The token holds the 52nd position in the overall cryptocurrency market rankings, representing a 0.10% market dominance.
Over the past 24 hours, ENA has demonstrated a positive price movement of 3.59%, with the price fluctuating between $0.2129 and $0.2296. The 24-hour trading volume reached approximately $2.52 million, indicating moderate market activity. However, the broader trend shows some weakness, with a 6.87% decline over the past seven days and a 2.74% decrease over the past 30 days.
The circulating supply currently stands at approximately 7.96 billion ENA tokens, representing 53.05% of the maximum supply of 15 billion tokens. The market cap to fully diluted valuation ratio of 53.05% suggests that a significant portion of the token supply has yet to enter circulation, which could potentially impact future price dynamics.
From a year-over-year perspective, ENA has experienced a substantial decline of 74.07%, reflecting the broader market corrections and challenges faced by the project since its launch. The current price of $0.2286 represents approximately 15% of its all-time high of $1.5208, while standing 76% above its historical low of $0.1299.
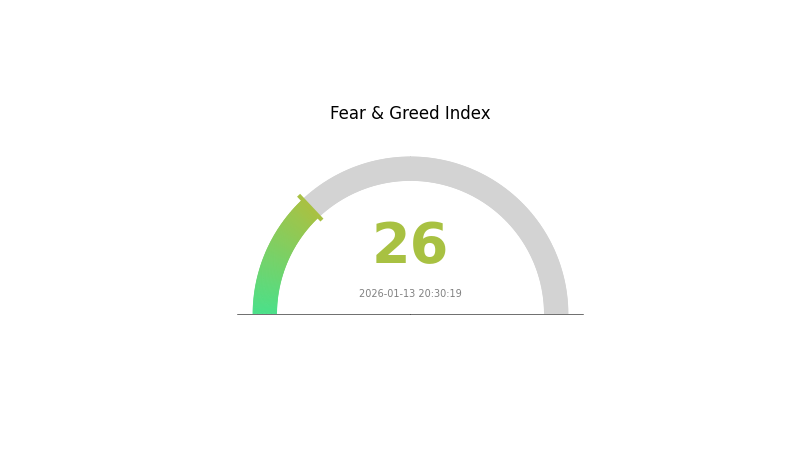
The market sentiment indicator shows a value of 26, classified as "Fear," suggesting cautious investor sentiment in the current market environment. This sentiment aligns with the recent price performance and broader market conditions.
Click to view the current ENA market price
ENA Market Sentiment Index
2026-01-13 Fear and Greed Index: 26 (Fear)
Click to view current Fear & Greed Index
The cryptocurrency market is currently experiencing a fear sentiment with an index reading of 26. This indicates significant market anxiety and pessimistic investor outlook. When the index falls below 25, it typically signals heightened market uncertainty and defensive positioning. Investors should exercise caution during this period, focusing on risk management and portfolio diversification. Such conditions often create opportunities for long-term investors to accumulate assets at potentially lower valuations. Monitor market developments closely and adjust strategies accordingly.
ENA Token Holding Distribution
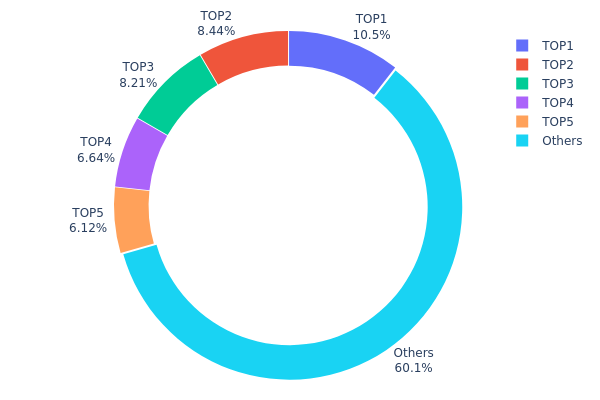
The token holding distribution chart illustrates the allocation of ENA tokens across different wallet addresses, revealing the degree of decentralization and concentration within the network. This metric serves as a critical indicator of market structure, helping investors assess potential risks associated with token concentration and the overall health of the token ecosystem.
Based on the current data, ENA exhibits a moderately concentrated holding pattern. The top five addresses collectively control approximately 39.92% of the total token supply, with the largest holder at address 0xb805...890936 possessing 10.52% (1,578,458.81K tokens). The second and third largest holders account for 8.44% and 8.21% respectively, while the remaining distribution shows a gradual decline to the fifth position at 6.11%. The "Others" category, representing all remaining addresses, holds 60.08% of the total supply, indicating a substantial portion of tokens is distributed among smaller holders.
This distribution pattern presents both opportunities and concerns for market participants. The concentration of nearly 40% among the top five addresses suggests these holders maintain significant influence over market dynamics and could potentially impact price movements through large-scale transactions. However, the fact that over 60% remains distributed among numerous smaller addresses demonstrates a reasonable level of decentralization, which typically contributes to market stability and reduces the likelihood of extreme price manipulation. From a structural perspective, this balance between concentrated and distributed holdings reflects a maturing token ecosystem, though traders should remain vigilant regarding potential liquidity events from major holders.
Click to view current ENA Token Holding Distribution
| Top |
Address |
Holding Qty |
Holding (%) |
| 1 |
0xb805...890936 |
1578458.81K |
10.52% |
| 2 |
0x2146...47f1d0 |
1266101.42K |
8.44% |
| 3 |
0x1dc5...ac0901 |
1231887.04K |
8.21% |
| 4 |
0xb2af...d98298 |
996693.71K |
6.64% |
| 5 |
0x8be3...a7b3b9 |
917955.86K |
6.11% |
| - |
Others |
9008903.17K |
60.08% |
II. Core Factors Influencing ENA's Future Price
Supply Mechanism
- Team Buyback Program: On January 8, 2026, Ethena Labs executed a substantial buyback of 50 million ENA tokens, demonstrating the team's confidence in the project's long-term value and creating potential upward pressure on token price through reduced circulating supply.
- Current Impact: The team's buyback activities have created a tug-of-war dynamic with existing market resistance, as increased demand from institutional buyers competes with prevailing market conditions.
Institutional and Major Holder Dynamics
- Institutional Adoption: Institutional adoption has emerged as one of the primary factors influencing ENA's price trajectory, with growing interest from professional investors seeking exposure to innovative stablecoin infrastructure.
- Investor Stickiness: The protocol's ability to maintain long-term capital retention depends on factors including lock-up periods and sustained annual returns, which directly impact institutional commitment levels.
Macroeconomic Environment
- Revenue Model Pressure: Ethena's income model exhibits high correlation with market sentiment. During bull markets, funding rates typically increase, enhancing protocol revenue. However, during bearish conditions, these rates may decline or turn negative, creating revenue pressure that could affect token valuation.
- Market Conditions: Broader cryptocurrency market conditions play a substantial role in ENA's performance, with overall sector momentum influencing investor appetite for protocol tokens.
Technology Development and Ecosystem Construction
- Delta-Neutral Strategy: Ethena's core mechanism accepts cryptocurrency collateral such as BTC, ETH, and stETH, while shorting corresponding perpetual contracts to achieve delta-neutral risk management and generate yield from collateral assets.
- Project Updates and Blockchain Advancement: The protocol's future value remains subject to ongoing project developments, technological improvements in blockchain infrastructure, and successful implementation of planned upgrades.
- Ecosystem Expansion Capacity: The protocol's ability to scale its Assets Under Management (AUM) represents a key factor for long-term growth, as increased capacity directly correlates with revenue generation potential and token utility.
III. 2026-2031 ENA Price Prediction
2026 Outlook
- Conservative Forecast: $0.215 - $0.227
- Neutral Forecast: $0.227 - $0.267
- Optimistic Forecast: $0.267 (requires favorable market conditions and increased adoption)
As we approach 2026, ENA is expected to establish its baseline trading range. The token may experience moderate volatility as the market assesses its fundamental value proposition and utility within the decentralized finance ecosystem. Technical indicators suggest a stabilization period with potential for gradual accumulation by long-term holders.
2027-2029 Mid-term Outlook
- Market Stage Expectation: Transition from early adoption phase to broader market recognition, with potential correlation to overall crypto market cycles
- Price Range Predictions:
- 2027: $0.160 - $0.365 (approximately 8% annual growth)
- 2028: $0.205 - $0.383 (approximately 34% cumulative growth)
- 2029: $0.196 - $0.506 (approximately 51% cumulative growth)
- Key Catalysts: Platform development milestones, strategic partnerships, integration with major DeFi protocols, and overall cryptocurrency market sentiment
During this mid-term period, ENA may benefit from increased institutional interest and expanded use cases. The projected price appreciation reflects potential network effects and enhanced token utility. Market participants should monitor protocol upgrades and ecosystem expansion as primary growth drivers.
2030-2031 Long-term Outlook
- Baseline Scenario: $0.366 - $0.525 (assuming steady protocol development and market maturation)
- Optimistic Scenario: $0.425 - $0.525 (assuming accelerated adoption and favorable regulatory environment)
- Transformational Scenario: $0.474 - $0.517 (under conditions of significant market expansion and dominant ecosystem position)
By 2031, ENA could potentially achieve more than double its 2026 baseline value, representing approximately 108% cumulative growth. This long-term trajectory depends on sustained innovation, competitive positioning within the DeFi landscape, and broader cryptocurrency market dynamics. Investors should consider both technological advancement and market cyclicality when evaluating these extended forecasts.
Note: All price predictions are speculative estimates based on historical patterns and market analysis. Cryptocurrency investments carry substantial risk, and actual prices may vary significantly from projections due to market volatility, regulatory changes, technological developments, and macroeconomic factors.
| Year |
Predicted High Price |
Predicted Average Price |
Predicted Low Price |
Price Change |
| 2026 |
0.26727 |
0.2265 |
0.21518 |
0 |
| 2027 |
0.36539 |
0.24689 |
0.16048 |
8 |
| 2028 |
0.38267 |
0.30614 |
0.20511 |
34 |
| 2029 |
0.50627 |
0.3444 |
0.19631 |
51 |
| 2030 |
0.52317 |
0.42534 |
0.36579 |
87 |
| 2031 |
0.51694 |
0.47425 |
0.29878 |
108 |
IV. ENA Professional Investment Strategies and Risk Management
ENA Investment Methodology
(1) Long-Term Holding Strategy
- Target Investors: Investors with a long-term horizon who believe in Ethena's synthetic dollar protocol and its potential to provide a crypto-native alternative to traditional banking infrastructure
- Operational Recommendations:
- Consider accumulating ENA during market corrections, as evidenced by its recent price movement showing a 6.87% decline over 7 days
- Monitor the project's development milestones and the adoption of its "Internet Bond" savings instrument
- Storage Solution: Utilize Gate Web3 Wallet for secure, decentralized custody of ENA tokens on the Ethereum network
(2) Active Trading Strategy
- Technical Analysis Tools:
- Volume Analysis: Current 24-hour trading volume of $2,523,962.47 indicates moderate liquidity for position entries and exits
- Support and Resistance Levels: Monitor the 24-hour low of $0.2129 as potential support and the 24-hour high of $0.2296 as near-term resistance
- Swing Trading Key Points:
- The 3.59% gain in the past 24 hours following a 7-day decline may indicate a potential short-term reversal opportunity
- Consider the significant gap between current price ($0.2286) and all-time high ($1.5208) when evaluating upside potential
ENA Risk Management Framework
(1) Asset Allocation Principles
- Conservative Investors: 2-5% of crypto portfolio allocation
- Aggressive Investors: 5-10% of crypto portfolio allocation
- Professional Investors: Up to 15% of crypto portfolio allocation, with active monitoring
(2) Risk Hedging Solutions
- Position Sizing: Given ENA's 74.07% decline over the past year, consider dollar-cost averaging to mitigate timing risk
- Stop-Loss Management: Implement stop-loss orders below key support levels to protect capital during volatile periods
(3) Secure Storage Solutions
- Decentralized Wallet Recommendation: Gate Web3 Wallet provides secure storage for ERC20 tokens like ENA with full user control of private keys
- Multi-Signature Solution: For larger holdings, consider implementing multi-signature wallet arrangements for enhanced security
- Security Precautions: Never share private keys or seed phrases; verify contract address (0x57e114B691Db790C35207b2e685D4A43181e6061) before transactions; be cautious of phishing attempts
V. ENA Potential Risks and Challenges
ENA Market Risks
- Price Volatility: ENA has experienced significant price fluctuation, with a 74.07% decline from its peak over the past year, indicating substantial volatility risk
- Limited Market Capitalization: With a market cap of approximately $1.82 billion and ranking at #52, ENA may face liquidity constraints during market stress
- Competition Risk: The synthetic dollar and stablecoin space is highly competitive, with numerous established protocols competing for market share
ENA Regulatory Risks
- Synthetic Asset Scrutiny: Regulatory frameworks for synthetic assets and dollar-pegged instruments remain uncertain across jurisdictions
- Banking Alternative Concerns: Ethena's positioning as an alternative to traditional banking infrastructure may attract regulatory attention from financial authorities
- Compliance Evolution: Changing regulatory requirements for crypto-native financial products could impact Ethena's operational model
ENA Technical Risks
- Smart Contract Vulnerability: As an ERC20 token on Ethereum, ENA is exposed to potential smart contract bugs or exploits
- Ethereum Network Dependency: Protocol performance and transaction costs are tied to Ethereum network conditions
- Protocol Mechanism Risk: The sustainability of the "Internet Bond" mechanism and its yield generation may face challenges under various market conditions
VI. Conclusion and Action Recommendations
ENA Investment Value Assessment
Ethena (ENA) presents an innovative approach to creating a crypto-native synthetic dollar protocol with its "Internet Bond" concept. With 53.05% of total supply currently in circulation and listing on 53 exchanges, the project demonstrates reasonable distribution and accessibility. However, the significant 74.07% decline over the past year and the substantial gap between current price ($0.2286) and all-time high ($1.5208) indicate considerable market challenges. The project's long-term value proposition lies in its potential to provide a decentralized alternative to traditional banking infrastructure, though this vision faces execution risks and regulatory uncertainties. Short-term risks include continued price volatility, competitive pressures in the synthetic asset space, and the need to demonstrate sustainable adoption of its savings instrument.
ENA Investment Recommendations
✅ Beginners: Start with small positions (1-3% of crypto portfolio) and focus on understanding Ethena's protocol mechanics before increasing exposure. Utilize Gate Web3 Wallet for secure storage and avoid leverage
✅ Experienced Investors: Consider strategic accumulation during market weakness, but maintain strict position sizing (5-8% of crypto portfolio). Monitor protocol development and adoption metrics while implementing stop-loss strategies
✅ Institutional Investors: Conduct thorough due diligence on protocol mechanisms and regulatory compliance. Consider measured positions (up to 10% of crypto allocation) with active risk management, including hedging strategies and regular rebalancing
ENA Trading Participation Methods
- Spot Trading: Purchase ENA directly on Gate.com with support for multiple trading pairs, offering straightforward exposure to price movements
- DCA Strategy: Implement dollar-cost averaging to mitigate timing risk, particularly given the asset's historical volatility
- Gate Web3 Wallet: Store and manage ENA tokens securely using Gate Web3 Wallet, which provides full custody control and seamless integration with Ethereum network
Cryptocurrency investment carries extremely high risks. This article does not constitute investment advice. Investors should make careful decisions based on their own risk tolerance and are advised to consult professional financial advisors. Never invest more than you can afford to lose.
FAQ
ENA launched in 2024, reaching a peak of approximately $1.52 before declining to around $0.40, representing a 70% drop from its high. The token has shown significant volatility with recent recovery signs, reflecting market dynamics and investor sentiment shifts.
What are the main factors affecting ENA price?
ENA price is influenced by user activity, exchange liquidity, ecosystem events like burns and upgrades, whale transfers, and social media sentiment. Market demand and adoption growth also play key roles in price movements.
Use technical analysis tools including price charts, moving averages, and RSI indicators. Monitor trading volume and historical price data to identify support and resistance levels. Combine multiple analytical methods to develop trading strategies for ENA price prediction.
How does ENA's price volatility compare to other major cryptocurrencies?
ENA exhibits moderate to high volatility, currently trading between $0.44-$0.47 with key support at $0.35. Price fluctuations are significantly influenced by market sentiment and token unlock events. Technical analysis suggests ENA has potential to reach $10 in future market cycles.
What is the price prediction for ENA in 2024-2025?
Based on market analysis, ENA is predicted to reach approximately $0.6568 in 2024. For 2025, continued growth is anticipated as the protocol expands its user base and market adoption increases, with potential price appreciation driven by increasing trading volume and ecosystem development.
What impact do ENA's technical fundamentals and application prospects have on its price?
ENA features strong fundamentals with fixed 15B supply and decentralization. As demand for decentralized stablecoins grows amid regulatory pressures on centralized alternatives, USDe synthetic dollar gains prominence. This positions ENA for significant price appreciation potential driven by expanding utility and market adoption.
What are the risks to pay attention to when investing in ENA tokens?
ENA investment carries risks including substantial private token unlocks exceeding 1.1 billion dollars over the next year, high token release ratios compared to protocol revenues, and unproven long-term sustainability through complete market cycles. The protocol's income heavily depends on market conditions and funding rate dynamics.
* The information is not intended to be and does not constitute financial advice or any other recommendation of any sort offered or endorsed by Gate.