The article offers a comprehensive analysis of ERA's price prediction for 2025, focusing on its market position, historical price development, and future forecasts. It evaluates factors like ecosystem development, market sentiment, and macroeconomic influences on ERA's value. The piece addresses investor needs for data-driven insights and risk management strategies, catering to beginners, experienced, and institutional investors looking at Layer 2 scaling solutions. Key sections include ERA's price history, influencing factors, future forecasts, and investment strategies, optimizing content for easy scanning with keyword relevance and readability.
Introduction: ERA's Market Position and Investment Value
Caldera (ERA) is The Internet of Rollups platform, dedicated to making cryptocurrency faster, cheaper, and more interconnected than ever before. Since its launch, ERA has demonstrated significant ecosystem development, securing over $400 million in total value and processing 850 million+ transactions across 25 million+ unique addresses—surpassing leading L2 solutions like Scroll and ZKSync in terms of user adoption.
As of December 2025, ERA's market capitalization stands at approximately $28.78 million, with a circulating supply of 148.5 million tokens and a current price of $0.1938. The token maintains a position ranked #714 in the broader cryptocurrency market with a 14.85% circulating-to-fully-diluted valuation ratio.
This comprehensive analysis will examine ERA's price trajectory through 2030, integrating historical market patterns, supply-demand dynamics, ecosystem development, and macroeconomic factors to provide investors with data-driven price forecasts and actionable investment strategies.
Caldera (ERA) Market Analysis Report
I. ERA Price History Review and Current Market Status
ERA Historical Price Development Trajectory
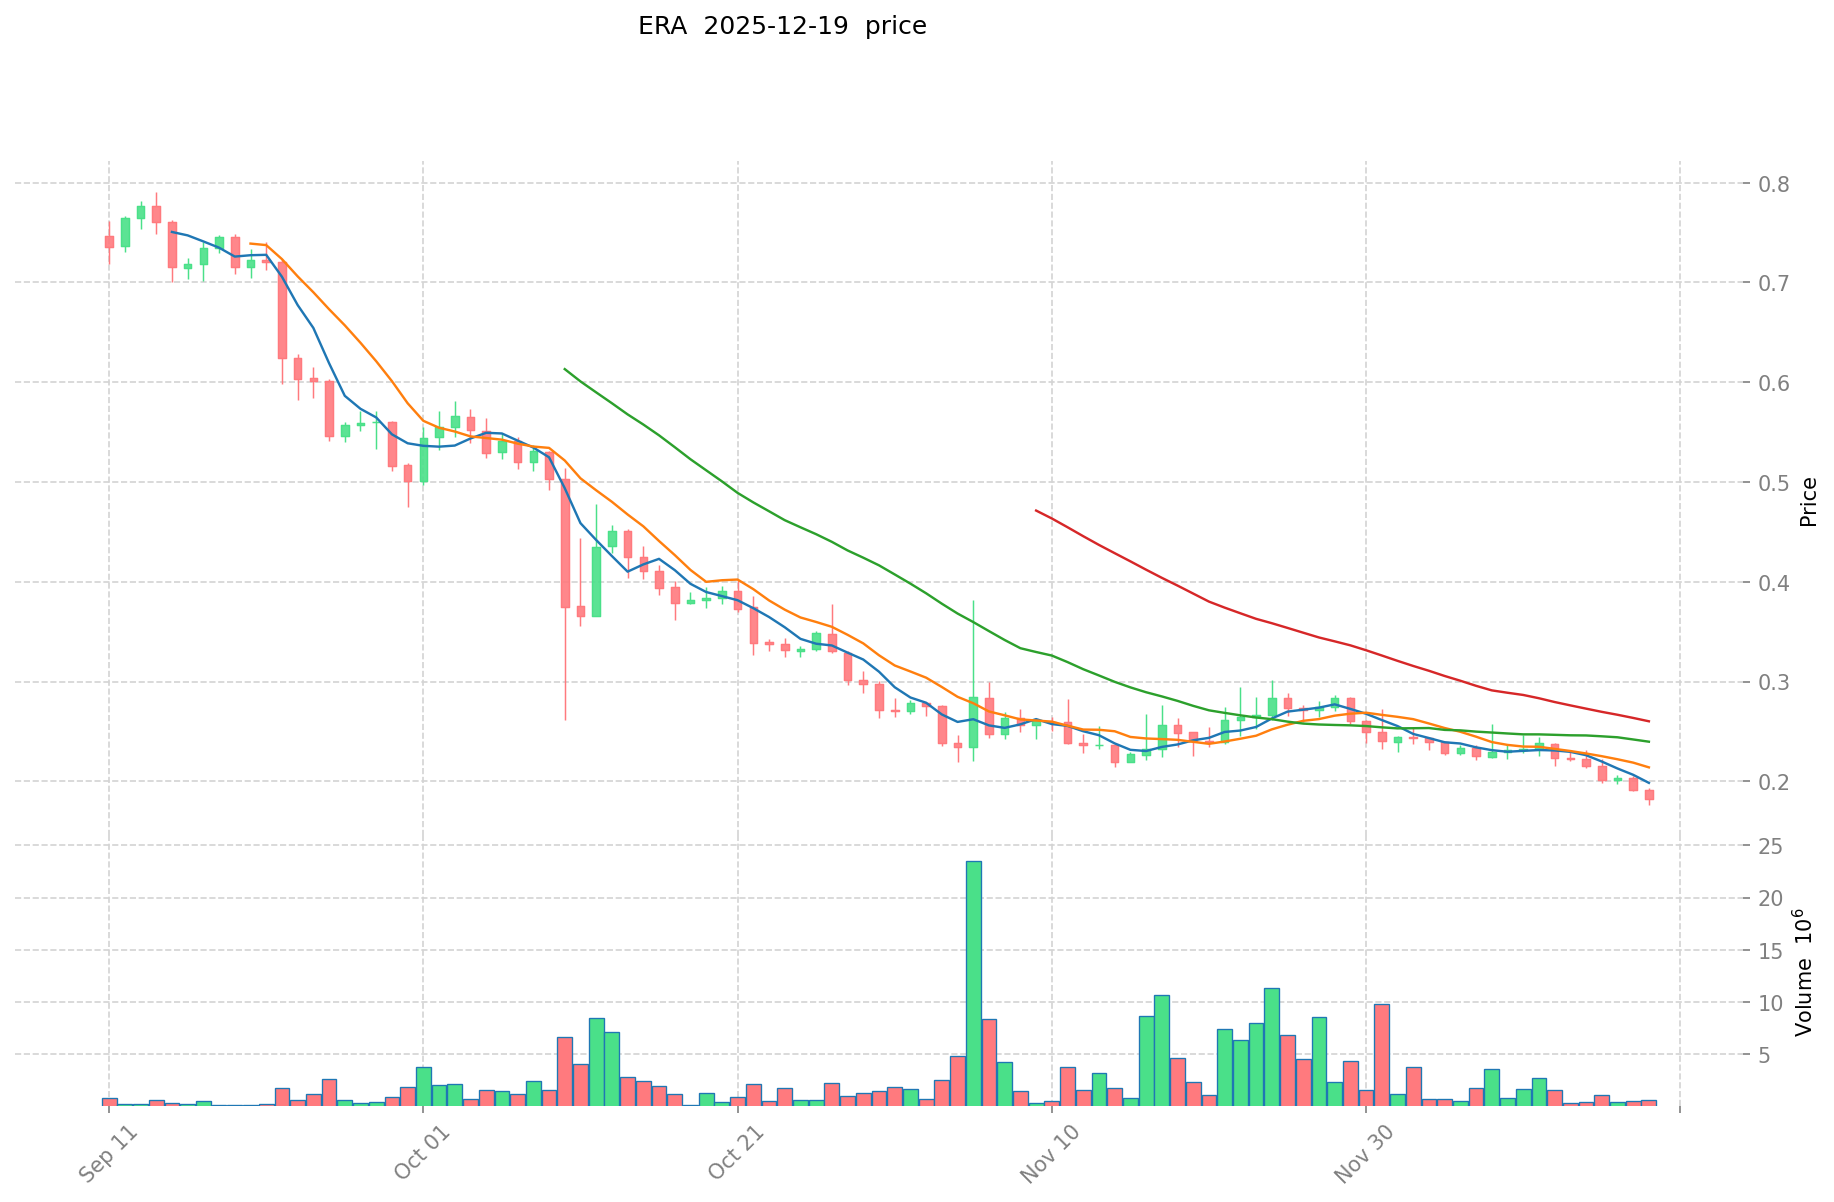
Based on available data, ERA has experienced significant volatility since its launch:
- July 17, 2025: ERA reached its all-time high of $1.85, marking the peak of early market enthusiasm for the Caldera platform.
- December 18, 2025: ERA hit its all-time low of $0.1759, representing a substantial correction from peak valuations.
- Current Period (December 2025): ERA is trading at $0.1938, showing modest recovery of approximately 1.05% over the past 24 hours despite the broader market downturn.
ERA Current Market Sentiment
ERA's price action reflects significant bearish pressure over extended timeframes. The token has declined 56.92% over the past year, 19.7% over the last 30 days, and 17.8% over the past 7 days. However, the intraday performance demonstrates slight resilience, with a 0.31% gain in the last hour and 1.05% recovery in the past 24 hours.
The current market conditions align with broader crypto market sentiment, which is experiencing "Extreme Fear" as indicated by the VIX reading of 16. The circulation ratio stands at 14.85%, with 148.5 million tokens circulating out of a total supply of 1 billion tokens. ERA maintains a market capitalization of approximately $28.78 million with a fully diluted valuation of $193.8 million, ranking #714 in the global cryptocurrency market.
Trading volume over 24 hours reached $134,762.53, indicating moderate liquidity. The token is available on 33 exchanges and holds approximately 19,828 token holders, demonstrating a growing but still developing holder base.
Visit ERA Market Price on Gate.com for real-time pricing data.
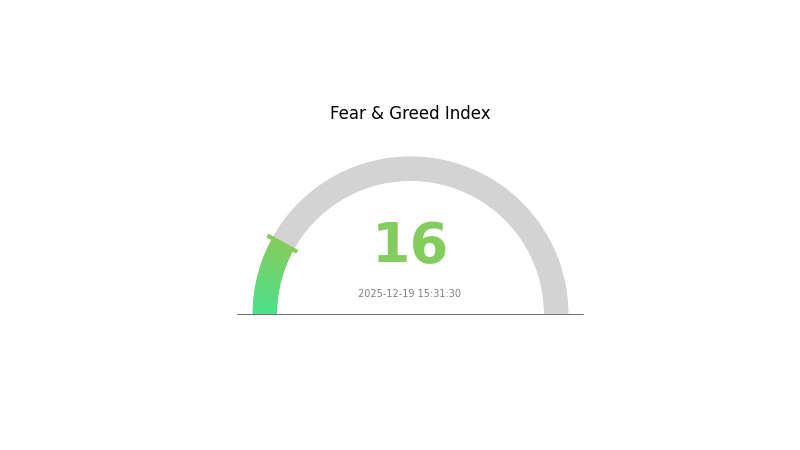
ERA Market Sentiment Index
2025-12-19 Fear and Greed Index: 16 (Extreme Fear)
Click to view current Fear & Greed Index
The cryptocurrency market is currently experiencing extreme fear, with the index plummeting to 16. This severely depressed sentiment suggests widespread panic selling and negative market expectations. Investors are displaying heightened risk aversion, creating potential opportunities for contrarian traders. During such extreme fear periods, historically resilient assets often present attractive entry points. However, market volatility remains elevated, requiring careful risk management. Monitor key support levels and market catalysts closely before making investment decisions. Consider dollar-cost averaging to mitigate timing risk in this turbulent environment.
ERA Holdings Distribution
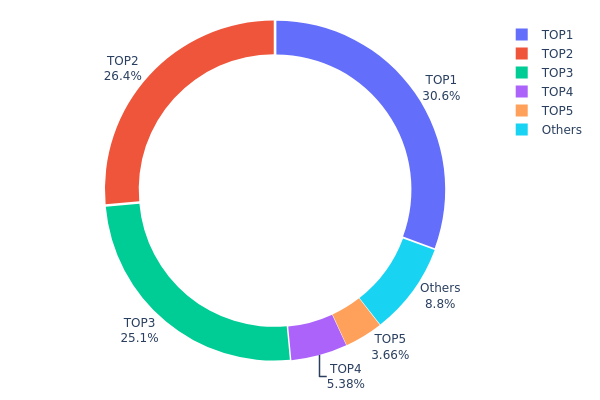
The address holdings distribution map visualizes the concentration of ERA tokens across blockchain addresses, revealing the degree of token centralization and ownership structure. By analyzing the top holders and their respective percentages, this metric provides critical insights into market concentration risk, potential for price manipulation, and the overall decentralization characteristics of the ERA ecosystem.
Current data demonstrates a pronounced concentration pattern within ERA's token distribution. The top three addresses collectively control approximately 82.14% of all circulating tokens, with the largest holder commanding 30.64%, the second holding 26.41%, and the third accounting for 25.09%. This level of concentration suggests a moderately centralized ownership structure. While the fourth and fifth largest holders possess significantly smaller stakes at 5.38% and 3.66% respectively, the remaining addresses fragment into a scattered distribution, with other holders collectively accounting for only 8.82% of total supply. This distribution pattern indicates that ERA's token supply remains predominantly controlled by a relatively small number of entities.
The concentrated holdings structure carries substantial implications for market dynamics and ecosystem stability. With over 82% of tokens held by just three addresses, there exists meaningful potential for significant price volatility should these major holders execute large transactions or alter their positioning. The skewed distribution may limit organic price discovery and increase susceptibility to market manipulation. However, the absence of a single dominant address—with the largest holder maintaining under 31%—provides some mitigation against absolute centralization risk. For long-term ecosystem health and decentralization goals, ERA would benefit from gradual token distribution toward a broader holder base, which would enhance market resilience and reduce concentration-driven volatility.
Click to view current ERA Holdings Distribution
</Holdings Distribution Analysis>
| Top |
Address |
Holding Qty |
Holding (%) |
| 1 |
0xb92d...59f983 |
306447.21K |
30.64% |
| 2 |
0x0306...516551 |
264173.87K |
26.41% |
| 3 |
0xf214...d499cd |
250900.00K |
25.09% |
| 4 |
0x1669...9f7cf3 |
53821.85K |
5.38% |
| 5 |
0xf001...cdbf3a |
36642.29K |
3.66% |
| - |
Others |
88014.78K |
8.82% |
II. Core Factors Influencing ERA's Future Price
Ecosystem Development Dependency
-
Developer Activity: ERA's long-term value depends on sustained developer activity. If major projects migrate to alternative platforms, network effects may weaken, resulting in decreased token demand.
-
Market Competition: ERA faces competitive pressure from other blockchain platforms. The ability to retain and attract development talent and projects is critical for maintaining ecosystem growth and token utility.
Macroeconomic Environment
-
Monetary Policy Impact: Global central bank policies, particularly the Federal Reserve's interest rate decisions and inflation control measures, influence risk asset valuations including cryptocurrencies. Rising interest rates typically increase the cost of capital and may reduce speculative demand for alternative assets.
-
Inflation Hedge Properties: In environments with elevated inflation concerns and mounting public debt levels, demand for alternative value stores and hedging assets may increase, potentially benefiting digital assets as investors seek portfolio diversification.
-
Geopolitical Factors: International tensions and trade uncertainties can drive investors toward alternative assets as portfolio hedges, while also creating regulatory uncertainty in different jurisdictions affecting adoption rates.
Three: 2025-2030 ERA Price Forecast
2025 Outlook
- Conservative Prediction: $0.16069 - $0.19130
- Neutral Prediction: $0.19130
- Bearish Prediction: $0.28312 (requires market recovery catalysts)
2026-2028 Medium-term Outlook
- Market Stage Expectation: Recovery and consolidation phase with gradual upward momentum, characterized by increasing institutional adoption and ecosystem expansion.
- Price Range Predictions:
- 2026: $0.15656 - $0.32498 (22% upside potential)
- 2027: $0.23612 - $0.35137 (45% upside potential)
- 2028: $0.22453 - $0.4364 (63% upside potential)
- Key Catalysts: Increased DeFi protocol integrations, enhanced liquidity on major exchanges including Gate.com, growing developer community engagement, and strategic partnership announcements.
2029-2030 Long-term Outlook
- Base Case Scenario: $0.25213 - $0.50427 (94% upside potential by 2029), reflecting steady ecosystem maturation and mainstream adoption.
- Optimistic Scenario: $0.31261 - $0.53275 (127% upside potential by 2030), assuming accelerated institutional investment and significant protocol upgrades.
- Transformative Scenario: $0.53275+ (extreme upside), contingent upon breakthrough technological innovations, regulatory clarity, and ERA becoming a fundamental infrastructure layer across major blockchain ecosystems.
- 2030-12-31: ERA could reach $0.53275 (potential consolidation phase with sustained bullish sentiment).
| 年份 |
预测最高价 |
预测平均价格 |
预测最低价 |
涨跌幅 |
| 2025 |
0.28312 |
0.1913 |
0.16069 |
-1 |
| 2026 |
0.32498 |
0.23721 |
0.15656 |
22 |
| 2027 |
0.35137 |
0.2811 |
0.23612 |
45 |
| 2028 |
0.4364 |
0.31623 |
0.22453 |
63 |
| 2029 |
0.50427 |
0.37632 |
0.25213 |
94 |
| 2030 |
0.53275 |
0.44029 |
0.31261 |
127 |
Caldera (ERA) Professional Investment Report
IV. ERA Professional Investment Strategy and Risk Management
ERA Investment Methodology
(1) Long-term Holding Strategy
- Target Investors: Investors seeking exposure to Layer 2 scaling solutions and cross-chain interoperability infrastructure
- Operational Recommendations:
- Accumulate ERA during periods of market weakness, particularly when the token shows -17.8% (7-day) and -19.7% (30-day) declines
- Maintain positions through market cycles, given Caldera's substantial ecosystem metrics (850M+ transactions processed and 25M+ unique addresses)
- Dollar-cost averaging (DCA) strategy to reduce timing risk during volatility
(2) Active Trading Strategy
- Technical Analysis Tools:
- Price Action: Monitor resistance at $0.1953 (24-hour high) and support at $0.1759 (24-hour low and recent all-time low)
- Volatility Indicators: Track the 1-hour change of +0.31% and 24-hour change of +1.05% for short-term momentum trading
- Wave Trading Key Points:
- Capitalize on oversold conditions given the -56.92% year-to-date decline from all-time high of $1.85
- Watch for reversal signals near the all-time low of $0.1759 (established on December 18, 2025)
ERA Risk Management Framework
(1) Asset Allocation Principles
- Conservative Investors: 1-3% of portfolio allocation
- Aggressive Investors: 5-8% of portfolio allocation
- Professional Investors: 10-15% of portfolio allocation
(2) Risk Hedging Solutions
- Diversification Across Layer 2s: Balance ERA holdings with exposure to other established scaling solutions to reduce single-project risk
- Position Sizing: Implement strict position limits based on individual risk tolerance and portfolio size
(3) Secure Storage Solutions
- Self-Custody Approach: Store ERA tokens on non-custodial platforms with strong security protocols
- Exchange Custody: Gate.com provides a secure environment for ERA trading and storage with institutional-grade security measures
- Security Considerations: Enable two-factor authentication (2FA), use strong passwords, regularly update security credentials, and never share private keys or seed phrases
V. ERA Potential Risks and Challenges
ERA Market Risks
- Severe Price Volatility: ERA has experienced a -56.92% decline over the past year and -19.7% over 30 days, indicating high volatility that could result in substantial losses
- Liquidity Risk: With 24-hour trading volume of $134,762.53 and 33 exchange listings, liquidity can be limited during periods of market stress
- Market Competition: Facing strong competition from established Layer 2 solutions like Scroll and ZKSync, though Caldera currently leads in unique address count metrics
ERA Regulatory Risks
- Evolving Regulatory Framework: Layer 2 protocols and their native tokens face uncertain regulatory treatment in major jurisdictions
- Token Classification: Regulatory bodies may classify ERA differently depending on jurisdiction, affecting trading and holding policies
- Compliance Requirements: Changes in global crypto regulations could impact Caldera's operations and token utility
ERA Technical Risks
- Smart Contract Vulnerabilities: As a complex Layer 2 infrastructure protocol, bugs or exploits could affect ecosystem security and token value
- Cross-Chain Bridge Risks: Caldera's core functionality involves cross-chain asset transfers, which introduce technical complexities and potential vulnerabilities
- Scalability Limitations: While designed to improve throughput, technical constraints could emerge as network usage grows
VI. Conclusion and Action Recommendations
ERA Investment Value Assessment
Caldera (ERA) represents an infrastructure investment in the Layer 2 ecosystem with impressive on-chain metrics: 850M+ transactions, 25M+ unique addresses, and $400M+ total value secured. However, the token has experienced significant depreciation (-56.92% year-to-date) and currently trades near recent lows ($0.1759). The project demonstrates strong technical adoption relative to competitors like Scroll and ZKSync, but remains a high-risk, early-stage infrastructure play. Investment suitability depends entirely on individual risk tolerance and conviction in cross-chain Layer 2 scaling solutions.
ERA Investment Recommendations
✅ Beginners: Start with minimal allocation (1-2% of crypto portfolio) through Gate.com's simple interface; focus on understanding Caldera's technology before increasing exposure
✅ Experienced Investors: Consider tactical accumulation during significant drawdowns; implement technical analysis-based entry/exit signals; maintain strict position sizing discipline
✅ Institutional Investors: Conduct detailed due diligence on Caldera's technical architecture and competitive positioning; consider ERA as a small-cap infrastructure allocation (3-5% of larger blockchain portfolio) with long-term holding horizon
ERA Trading Participation Methods
- Direct Trading on Gate.com: Trade ERA/USDT pairs with access to spot markets and leveraged trading options
- Dollar-Cost Averaging: Execute regular purchases at fixed intervals through Gate.com to mitigate timing risk
- staking/Incentive Programs: Monitor Caldera foundation for any upcoming rewards or staking opportunities that might enhance return profiles
Cryptocurrency investment carries extreme risk. This report does not constitute investment advice. Investors must make decisions based on their individual risk tolerance and should consult professional financial advisors. Never invest more capital than you can afford to lose completely. Past performance does not guarantee future results.
FAQ
What is the future prediction for the era coin?
Era Token price is projected to reach approximately S$0.00 by 2026, based on estimated 5% growth. However, cryptocurrency markets are highly volatile, and actual prices may vary significantly due to market dynamics and adoption rates.
What factors influence ERA coin price movements and predictions?
ERA coin price movements are driven by supply and demand dynamics, market sentiment, trading volume, adoption rates, and broader cryptocurrency market trends. Predictions depend on these factors and future protocol developments.
Is ERA coin a good investment based on current price trends and forecasts?
ERA shows promising market momentum with stable price performance and active trading volume. Current technical indicators suggest positive growth potential. However, conduct thorough market research before investing.
* The information is not intended to be and does not constitute financial advice or any other recommendation of any sort offered or endorsed by Gate.