This comprehensive guide delivers expert Ethereum (ETH) price analysis and forecasts spanning 2026-2031, tailored for investors seeking data-driven market insights. The article examines ETH's current market position ($3,105.45 with $374.81B market cap), historical price evolution, and core factors influencing future value including supply dynamics, institutional adoption, and technological upgrades. It provides detailed price forecasts ranging from $2,451.73-$6,814.71 across multiple scenarios, while addressing practical investment strategies, risk management frameworks, and secure storage solutions on Gate. Whether you're a beginner exploring cryptocurrency or an institutional investor evaluating digital asset allocation, this analysis combines technical metrics, market sentiment data, and ecosystem developments to guide your ETH investment decisions effectively.
Introduction: ETH's Market Position and Investment Value
Ethereum (ETH), as a leading decentralized open-source blockchain platform supporting smart contracts and decentralized applications (DApps), has achieved remarkable milestones since its inception in 2015. As of 2026, Ethereum maintains a market capitalization of approximately $374.81 billion with a circulating supply of about 120.69 million tokens, and its price hovers around $3,105.45. This asset, often referred to as the "foundation of decentralized finance," is playing an increasingly crucial role in powering Web3 infrastructure, DeFi protocols, NFT ecosystems, and enterprise blockchain solutions.
This article will comprehensively analyze ETH's price trajectory from 2026 to 2031, combining historical patterns, market supply-demand dynamics, ecosystem development, and macroeconomic factors to provide investors with professional price forecasts and practical investment strategies.
I. ETH Price History Review and Market Status
ETH Historical Price Evolution Trajectory
- 2015: Ethereum launched in July with an initial price of $0.308, experiencing extreme volatility with a low of $0.432979 recorded in October
- 2017-2018: Bull market cycle drove ETH price growth, followed by correction phase
- 2021: DeFi and NFT boom propelled significant price appreciation
- 2025: ETH reached a notable price level of $4,946.05 in August, marking a significant milestone in its price history
ETH Current Market Status
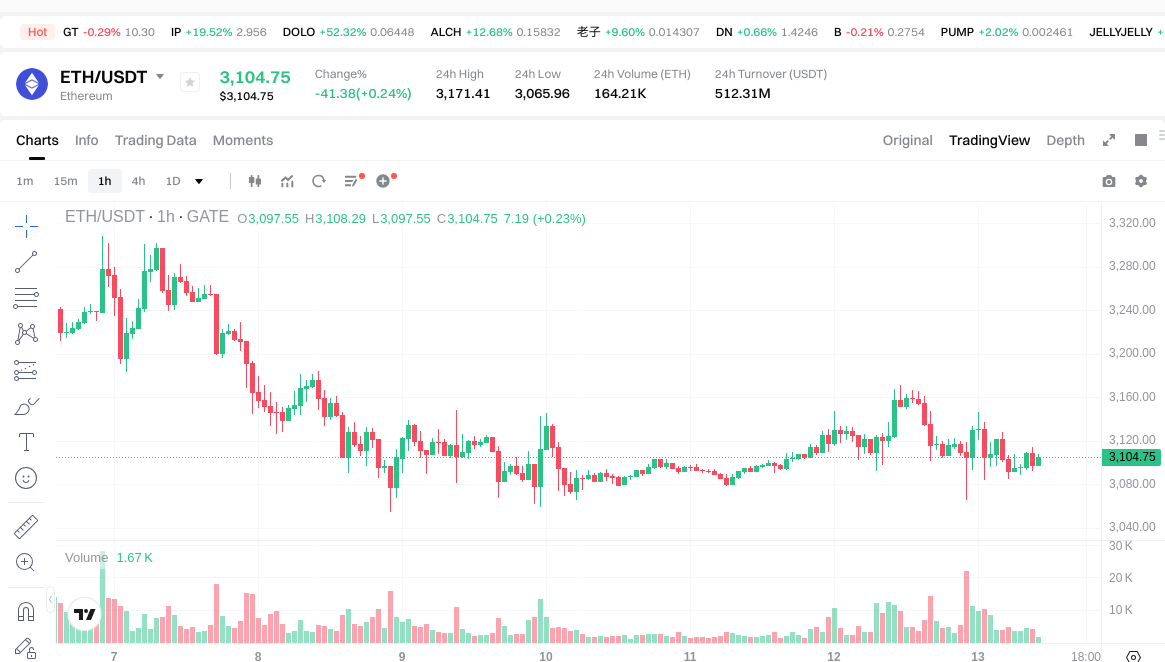
As of January 13, 2026, ETH is trading at $3,105.45, representing a decline from recent price levels. The token has experienced negative price momentum across multiple timeframes, with a 1.16% decrease over 24 hours, a 3.55% decline over 7 days, and a 0.5% drop over 30 days. The annual performance shows a 4.97% decrease.
Within the last 24 hours, ETH traded between a high of $3,171.41 and a low of $3,065.96, indicating moderate intraday volatility. The 24-hour trading volume stands at approximately $514.6 million, reflecting active market participation.
Ethereum maintains its position as the second-ranked cryptocurrency by market capitalization, with a total market cap of approximately $374.81 billion and a market dominance of 11.51%. The circulating supply of 120.69 million ETH represents 100% of the total supply, with no maximum supply cap in place.
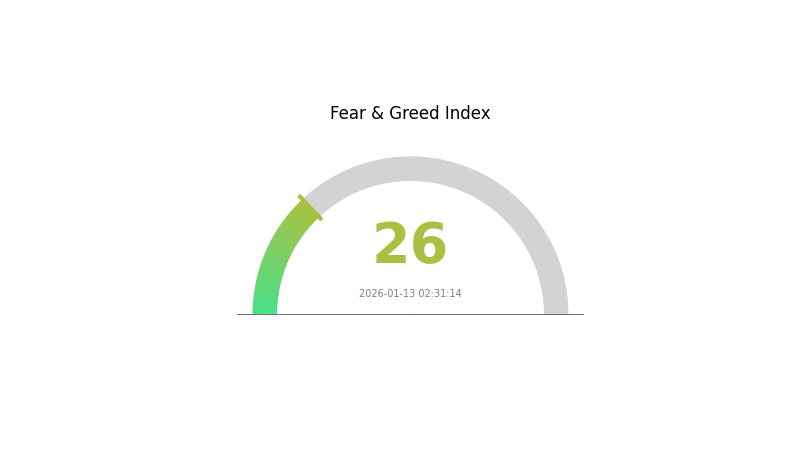
The current market sentiment indicator shows a reading of 26, classified as "Fear" territory, suggesting cautious investor sentiment in the broader cryptocurrency market. ETH is held by approximately 264.53 million addresses across various blockchain networks.
Ethereum continues to serve as the foundation for decentralized applications, smart contracts, and various DeFi protocols, maintaining its role as a core infrastructure layer in the blockchain ecosystem. The platform supports operations across multiple networks including mainnet, layer-2 solutions, and various scaling implementations.
Click to view current ETH market price
ETH Market Sentiment Index
2026-01-13 Fear and Greed Index: 26 (Fear)
Click to view the current Fear & Greed Index
Currently, the market is experiencing a fear sentiment with an index reading of 26. This indicates that investors are showing heightened caution and risk aversion in the cryptocurrency market. During periods of fear, market volatility tends to increase as participants reassess their positions. Savvy investors often view such corrections as potential accumulation opportunities, as extreme fear can signal oversold conditions. Monitor market developments closely and consider your risk tolerance before making investment decisions on Gate.com.
ETH Holding Distribution
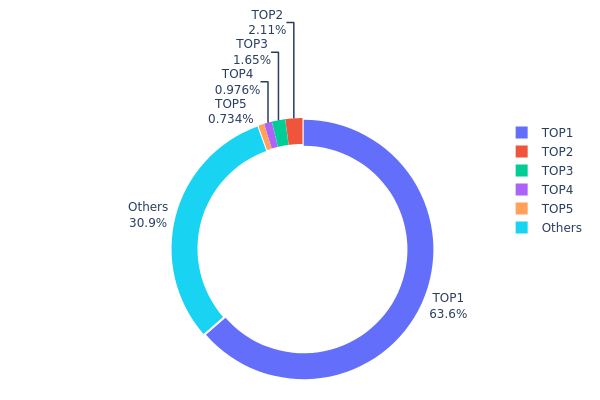
The holding distribution chart illustrates the concentration of ETH tokens across different wallet addresses, revealing how cryptocurrency assets are distributed among holders. This metric is crucial for assessing the degree of decentralization and potential market manipulation risks within the Ethereum ecosystem.
According to the current data, the top address holds approximately 76,734.93K ETH, accounting for 63.58% of the total supply. This represents the Ethereum 2.0 deposit contract, where ETH is locked for staking purposes. The second-largest holder contains 2,547.72K ETH (2.11%), while the third holds 1,996.01K ETH (1.65%). The remaining addresses in the top five collectively hold less than 2% of the total supply. Notably, addresses outside the top five control 30.95% of the total supply, indicating a relatively dispersed distribution among smaller holders.
The current distribution pattern reflects a dual-layer structure in the Ethereum network. While the dominance of the deposit contract appears as high concentration, this is fundamentally different from traditional centralization risks, as these tokens represent staked assets locked by numerous individual validators. The remaining 36% distribution across various addresses demonstrates healthy decentralization at the operational level. This structure suggests robust on-chain stability and a low likelihood of coordinated market manipulation by single entities, contributing to Ethereum's resilience as a decentralized platform.
Click to view current ETH Holding Distribution
| Top |
Address |
Holding Qty |
Holding (%) |
| 1 |
0x0000...7705fa |
76734.93K |
63.58% |
| 2 |
0xc02a...756cc2 |
2547.72K |
2.11% |
| 3 |
0xbe0e...4d33e8 |
1996.01K |
1.65% |
| 4 |
0x40b3...18e489 |
1177.79K |
0.98% |
| 5 |
0x0e58...d9bfcd |
885.96K |
0.73% |
| - |
Others |
37352.31K |
30.95% |
II. Core Factors Influencing ETH's Future Price
Supply Mechanism
-
Post-Merge Deflationary Model: Following Ethereum's transition to Proof of Stake (PoS) in 2022, the network shifted from inflationary to potentially deflationary supply dynamics. The combination of reduced issuance and ETH burning through EIP-1559 has fundamentally altered supply economics.
-
Historical Pattern: Historical data shows Ethereum experienced three bull market phases with varying magnitude: approximately 50x growth (2016-2018), 234x growth (2019-2021), and 55x growth (2022-2025), demonstrating a trend of diminishing returns as market capitalization expands.
-
Current Impact: Recent exchange reserve data indicates a reduction of 132,000 ETH over four days, with cumulative withdrawals of 323,000 ETH since April 24th, suggesting investors are moving holdings off exchanges for accumulation, which reduces selling pressure.
Institutional and Whale Dynamics
-
Institutional Holdings: Data shows Abraxas Capital recently acquired nearly 50,000 ETH (approximately $100 million) through major platforms, demonstrating institutional confidence in short-term upside potential. BMNR, the largest Ethereum-focused digital asset custodian, continues accumulating positions.
-
ETF Developments: Ethereum ETF products have experienced periods of both inflows and outflows. While crypto fund outflows reached $454 million in January, previous institutional adoption through ETF vehicles has provided structural support for ETH.
-
Regulatory Framework: Anticipated passage of the CLARITY Act could establish clearer regulatory guidelines for digital assets and decentralized finance, potentially unlocking additional activity across Ethereum ecosystem protocols.
Macroeconomic Environment
-
Monetary Policy Influence: Federal Reserve interest rate expectations significantly impact risk asset sentiment. Recent policy developments, including trade agreements announced by the Trump administration, have improved overall market optimism, benefiting cryptocurrencies alongside traditional equities. The S&P 500 and Nasdaq 100 both gained over 1%, demonstrating correlation between traditional markets and crypto assets.
-
Risk Asset Correlation: ETH's performance remains sensitive to broader economic uncertainty. When economic instability rises, traders typically reduce exposure to higher-risk assets including cryptocurrencies, directly affecting ETH demand.
-
Market Sentiment Dynamics: Trading activity shows ETH open interest surged to 1.208 million ETH ($25.04 billion), indicating increased leveraged capital entering the market and elevating price volatility potential.
Technical Development and Ecosystem Building
-
Pectra Upgrade: Successfully implemented upgrades introduced features including EIP-3074 for optimized transaction experiences and improved network efficiency. EIP-7702 enables basic accounts to temporarily function as smart contracts, allowing wallets to execute multiple operations in single transactions and support various authentication methods.
-
Scalability Enhancements: EIP-7251 raised maximum validator balance to 2,048 ETH, reducing overhead for maintaining numerous nodes while preserving decentralization. EIP-7691 doubled blob data block space capacity that rollups depend on for transaction batching, while EIP-7623 adjusted fee structures to discourage inefficient data storage methods like calldata.
-
Layer 1 Throughput Expansion: Ethereum is advancing plans to increase Layer 1 processing capacity approximately tenfold. Standard Chartered's internal analysis indicates positive correlation between higher transaction processing capability and network market capitalization, supporting the thesis for ETH's long-term market outperformance.
-
Ecosystem Applications: Ethereum maintains dominant position as the settlement layer for stablecoins, real-world assets (RWA), and decentralized finance (DeFi). These sectors represent medium-term structurally bullish areas. Current DeFi total value locked stands around $60 billion, with Layer 2 solutions like Arbitrum and Optimism showing increasing adoption rates. The Ethereum Foundation allocated $32.64 million in Q1 2025 to support ecosystem projects including ZK proofs and developer tools, strengthening the platform's competitive moat.
III. 2026-2031 ETH Price Forecast
2026 Outlook
- Conservative estimate: $2,451.73 - $3,103.45
- Neutral estimate: Around $3,103.45
- Optimistic estimate: Up to $3,506.90 (subject to favorable market conditions and sustained institutional adoption)
2027-2029 Mid-term Outlook
- Market phase expectation: Potential transition from recovery to growth phase, with gradual accumulation and increasing network activity
- Price range predictions:
- 2027: $2,809.40 - $3,734.85 (approximately 6% change from 2026)
- 2028: $2,323.21 - $3,696.01 (approximately 13% cumulative change)
- 2029: $2,200.89 - $4,942.97 (approximately 16% cumulative change)
- Key catalysts: Ethereum ecosystem development, DeFi innovation expansion, institutional investment inflows, and potential regulatory clarity
2030-2031 Long-term Outlook
- Baseline scenario: $3,121.11 - $4,275.49 (assuming steady network growth and moderate adoption rates)
- Optimistic scenario: $4,275.49 - $5,600.90 by 2030 (with accelerated institutional integration and enhanced scalability solutions)
- Transformative scenario: Up to $6,814.71 by 2031 (under conditions of widespread enterprise adoption, major protocol upgrades success, and favorable macroeconomic environment with approximately 59% cumulative growth)
- 2026-01-13: ETH trading within projected 2026 range as market participants assess fundamental developments and positioning strategies
| Year |
Predicted High Price |
Predicted Average Price |
Predicted Low Price |
Price Change |
| 2026 |
3506.9 |
3103.45 |
2451.73 |
0 |
| 2027 |
3734.85 |
3305.17 |
2809.4 |
6 |
| 2028 |
3696.01 |
3520.01 |
2323.21 |
13 |
| 2029 |
4942.97 |
3608.01 |
2200.89 |
16 |
| 2030 |
5600.9 |
4275.49 |
3121.11 |
37 |
| 2031 |
6814.71 |
4938.19 |
3111.06 |
59 |
IV. ETH Professional Investment Strategy and Risk Management
ETH Investment Methodology
(1) Long-term Holding Strategy
- Suitable for: Investors with a long-term perspective who believe in the fundamental value of the Ethereum ecosystem and its role in decentralized finance and smart contract applications
- Operational Recommendations:
- Consider building positions during market corrections, focusing on accumulation over time rather than timing the market
- Monitor key network metrics such as total value locked (TVL), active addresses, and transaction volume to assess ecosystem health
- Maintain discipline with a multi-year investment horizon, recognizing that blockchain infrastructure development occurs gradually
- Storage Solution: Utilize secure wallet solutions such as Gate Web3 Wallet for convenient access combined with self-custody security, or consider hardware wallet options for larger holdings with appropriate backup procedures
(2) Active Trading Strategy
- Technical Analysis Tools:
- Support and Resistance Levels: Monitor key price levels around psychological thresholds and historical trading ranges; current 24-hour range shows activity between $3,065.96 and $3,171.41
- Volume Analysis: Track 24-hour trading volume (currently $514.6M) to confirm price movements and identify potential reversals or continuations
- Trading Operation Points:
- Establish clear entry and exit criteria based on predetermined price targets and risk tolerance
- Implement position sizing rules that limit exposure to acceptable risk levels per trade
- Monitor correlation with Bitcoin and broader market sentiment, as ETH often exhibits significant correlation with overall crypto market movements
ETH Risk Management Framework
(1) Asset Allocation Principles
- Conservative Investors: 5-10% of crypto portfolio allocation, with emphasis on stablecoin reserves for risk management
- Moderate Investors: 15-25% allocation, balancing between established assets and growth opportunities
- Professional Investors: 20-40% allocation, with active management strategies and diversification across DeFi protocols
(2) Risk Hedging Solutions
- Diversification Strategy: Spread exposure across multiple blockchain assets rather than concentrating entirely in ETH, reducing single-asset risk
- Position Sizing: Limit individual position size to ensure no single investment can significantly impact overall portfolio value
- Stop-Loss Discipline: Establish predetermined exit points to limit downside exposure during adverse market conditions
(3) Secure Storage Solutions
- Hot Wallet Solution: Gate Web3 Wallet provides convenient access for active trading and DeFi participation while maintaining user control of private keys
- Cold Storage Approach: For long-term holdings, consider hardware wallet solutions with offline storage of recovery phrases in secure locations
- Security Precautions: Never share private keys or recovery phrases; beware of phishing attempts; verify all transaction details before confirmation; consider multi-signature wallets for significant holdings
V. ETH Potential Risks and Challenges
ETH Market Risks
- Volatility Risk: ETH exhibits significant price fluctuations; recent data shows a 24-hour decline of 1.16% and 7-day decline of 3.55%, demonstrating ongoing market volatility that can impact short-term positions
- Correlation Risk: As the second-largest cryptocurrency by market capitalization (11.51% market dominance), ETH remains correlated with broader crypto market sentiment and Bitcoin price movements
- Liquidity Risk: During extreme market conditions, order book depth may decrease, potentially resulting in wider spreads and increased slippage for larger transactions
ETH Regulatory Risks
- Securities Classification Uncertainty: Ongoing regulatory discussions regarding whether ETH and staking services may be classified as securities in various jurisdictions could impact market accessibility
- DeFi Regulatory Scrutiny: As Ethereum hosts numerous decentralized finance protocols, regulatory actions targeting DeFi could indirectly affect ETH demand and ecosystem development
- Global Regulatory Divergence: Different regulatory approaches across jurisdictions create complexity for users and developers, potentially fragmenting the ecosystem
ETH Technical Risks
- Network Congestion: During periods of high demand, transaction fees may increase significantly, potentially limiting accessibility for smaller users
- Smart Contract Vulnerabilities: While Ethereum itself has proven resilient, bugs in deployed smart contracts have historically resulted in significant losses for users
- Scalability Challenges: Despite ongoing development of Layer 2 solutions, the base layer still faces throughput limitations that could constrain ecosystem growth
- Competition Risk: Emerging blockchain platforms offering alternative smart contract environments present competitive pressure
VI. Conclusion and Action Recommendations
ETH Investment Value Assessment
Ethereum maintains its position as a foundational infrastructure for decentralized applications and smart contracts, holding 11.51% market dominance with a fully diluted market capitalization of approximately $374.8 billion. The platform supports a vast ecosystem of decentralized finance, NFTs, and enterprise applications with over 264.5 million holder addresses. Recent price performance shows some consolidation, with 7-day and 30-day declines of 3.55% and 0.5% respectively, suggesting a period of market digestion. The current price of $3,105.45 remains well below the historical peak of $4,946.05 recorded on August 25, 2025. Long-term value proposition centers on Ethereum's established network effects, developer community, and ongoing technical evolution. However, near-term risks include market volatility, regulatory uncertainty, and competitive pressures from alternative platforms.
ETH Investment Recommendations
✅ Beginners: Start with modest allocation (3-5% of investment portfolio), focus on understanding the technology and ecosystem, use regulated platforms like Gate.com for purchases, and prioritize secure storage education before making significant commitments
✅ Experienced Investors: Consider ETH as a core blockchain infrastructure holding (10-20% of crypto portfolio), actively monitor network development metrics, participate in ecosystem opportunities where comfortable with risk, and implement disciplined rebalancing strategies
✅ Institutional Investors: Evaluate ETH exposure as part of broader digital asset allocation strategy, conduct thorough due diligence on custody solutions, assess regulatory compliance requirements in relevant jurisdictions, and consider both direct holdings and exposure through DeFi protocols or staking services aligned with institutional risk frameworks
ETH Trading Participation Methods
- Spot Trading: Direct purchase and sale of ETH on cryptocurrency exchanges like Gate.com, suitable for investors seeking straightforward exposure with complete ownership
- Dollar-Cost Averaging: Systematic periodic purchases regardless of price, reducing timing risk and smoothing entry costs over time
- Staking Participation: Contributing ETH to network validation processes to earn rewards, though this involves locking periods and technical considerations
Cryptocurrency investment carries extremely high risk; this article does not constitute investment advice. Investors should make prudent decisions based on their own risk tolerance and are advised to consult professional financial advisors. Never invest more than you can afford to lose.
FAQ
What are the main factors influencing ETH price predictions?
ETH price is influenced by market demand, trading volume, regulatory news, technological upgrades, institutional investments, global economic conditions, and market sentiment. Technical indicators and market emotions drive short-term predictions, though precise forecasting remains challenging due to volatility.
How to use technical analysis to predict Ethereum price trends?
Use moving averages, RSI, and support/resistance levels to identify trends and turning points. Monitor trading volume to confirm breakouts. Combine technical indicators with market sentiment and news for comprehensive analysis.
What is the ETH price prediction target for 2024-2025?
Based on analyst predictions, the maximum price target for ETH in 2024-2025 is $4,154.77. This forecast reflects optimistic market conditions and strong adoption of ethereum's smart contract capabilities.
How does the macroeconomic environment impact ETH price predictions?
Deteriorating macroeconomic conditions may trigger capital outflows from crypto markets, pressuring ETH prices downward. Economic recovery and improved market sentiment typically support ETH price appreciation. Central bank policies and inflation rates significantly influence investor allocation to digital assets.
What are the difficulties and characteristics of ETH price prediction compared to Bitcoin?
ETH price prediction is more challenging than Bitcoin due to greater volatility from DeFi applications and network congestion. ETH is more sensitive to ecosystem developments, while Bitcoin is primarily driven by macroeconomic factors and adoption trends.
* The information is not intended to be and does not constitute financial advice or any other recommendation of any sort offered or endorsed by Gate.