This comprehensive analysis examines Falcon Finance (FF) price dynamics and investment potential through 2031. The article evaluates FF's market position, with current pricing at $0.08667 and market cap of $202.8 million, while highlighting significant token concentration risks among top holders. Historical analysis reveals 47.16% year-to-date decline despite project innovation in collateralization infrastructure. Price forecasts range from conservative ($0.05698-$0.08633 in 2026) to optimistic scenarios ($0.21813+ by 2031), contingent on ecosystem development and market recovery. The guide offers differentiated investment strategies for beginners, experienced, and institutional investors, emphasizing portfolio allocation limits and risk management frameworks. Technical analysis tools, secure storage solutions via Gate Web3 Wallet, and hedging approaches are provided. Critical risks include price volatility, regulatory uncertainty, and smart contract vulnerabilities. Suitable for investors evaluating DeFi inf
Introduction: FF's Market Position and Investment Value
Falcon Finance (FF), as the first universal collateralization infrastructure protocol creating sustainable yield opportunities, has been developing its ecosystem since its launch in 2025. As of 2026, FF has achieved a market capitalization of approximately $202.8 million with a circulating supply of around 2.34 billion tokens, and the price is maintained at around $0.08667. This asset, positioned as an innovative yield-generating protocol, is playing an increasingly important role in the decentralized finance infrastructure space.
This article will comprehensively analyze FF's price trends from 2026 to 2031, combining historical patterns, market supply and demand dynamics, ecosystem development, and macroeconomic environment factors to provide investors with professional price predictions and practical investment strategies.
I. FF Price History Review and Market Overview
FF Historical Price Evolution Trajectory
- 2025: Falcon Finance (FF) launched on September 29, 2025, with the price reaching a notable level of $0.85 during its initial trading period
- 2025: The token experienced significant volatility in its early days, with the price declining from $0.85 to $0.04786 by October 10, 2025
- 2025-2026: Following the initial correction, FF demonstrated recovery patterns, with the price stabilizing around the $0.08-$0.09 range in early 2026
FF Current Market Situation
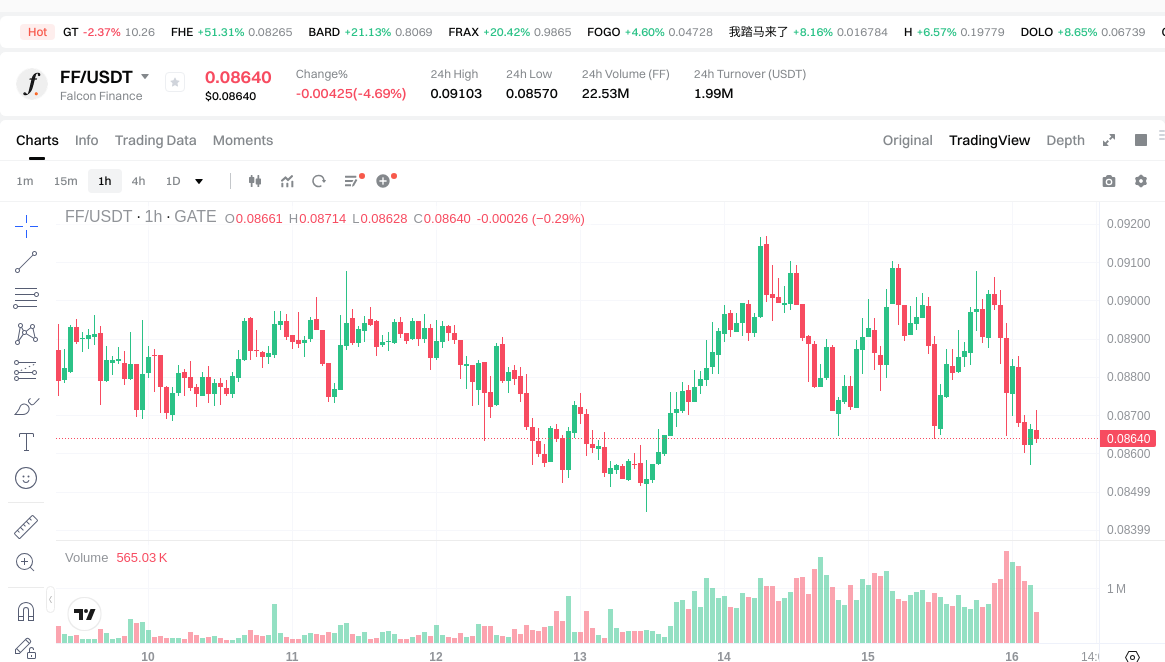
As of January 16, 2026, Falcon Finance (FF) is trading at $0.08667, reflecting a 3.99% decrease over the past 24 hours. The token's 24-hour trading range spans from a low of $0.0857 to a high of $0.09103, indicating moderate intraday volatility.
The token's market performance across different timeframes shows mixed signals. Over the past hour, FF has gained 0.55%, suggesting some short-term buying pressure. However, the broader trend reveals challenges, with a 0.89% decline over the past 7 days and a more substantial 15.73% decrease over the 30-day period. The year-to-date performance shows a 47.16% decline from previous levels.
Falcon Finance currently holds a market capitalization of approximately $202.81 million, with a circulating supply of 2.34 billion FF tokens out of a maximum supply of 10 billion tokens, representing 23.4% of the total supply in circulation. The fully diluted market capitalization stands at $866.7 million. The token ranks 235th in the cryptocurrency market and commands a 0.025% market share.
The 24-hour trading volume reached approximately $1.99 million, demonstrating active market participation. FF is listed on 31 exchanges, with Gate.com being among the major platforms offering FF trading pairs. The token holder count stands at 10,880, indicating a growing community base.
The Crypto Fear & Greed Index currently registers at 61, signaling a "Greed" sentiment in the broader cryptocurrency market, which may influence FF's trading dynamics.
Click to view current FF market price
FF Market Sentiment Index
2026-01-15 Fear and Greed Index: 61 (Greed)
Click to view current Fear & Greed Index
The crypto market is currently trading in a Greed state with an index reading of 61. This elevated sentiment suggests investors are becoming increasingly optimistic about market prospects, driving up demand and prices. When greed dominates, market participants tend to take higher risks and show greater appetite for crypto assets. However, it's worth noting that excessively high greed can signal potential overheating in the market. Traders should maintain rational decision-making and implement proper risk management strategies, as extreme sentiment shifts can quickly reverse market trends.

FF Holding Distribution
The holding distribution chart reveals the allocation of token holdings across different addresses on the blockchain, serving as a critical indicator of decentralization and market structure health. For FF tokens, the current distribution data demonstrates a notably concentrated ownership pattern that warrants careful examination.
According to the latest on-chain data, the top three addresses collectively control 73.98% of the total FF supply, with the largest holder possessing 29.98% (2.998M tokens), followed by 24.00% (2.4M tokens) and 20.00% (2M tokens) respectively. The fourth and fifth largest addresses hold 6.62% and 4.50% correspondingly, while all remaining addresses combined account for merely 14.9% of the circulating supply. This distribution pattern indicates a highly centralized token structure, where a small number of entities maintain dominant control over the majority of tokens in circulation.
Such concentrated holdings present several implications for market dynamics. The dominance of top holders increases the potential for significant price volatility, as large-scale token movements from these addresses could substantially impact market liquidity and price stability. Additionally, this concentration raises concerns regarding potential market manipulation risks, as coordinated actions among major holders could artificially influence token valuations. From a decentralization perspective, this distribution suggests that FF's current on-chain governance and economic model may be vulnerable to centralized decision-making, potentially limiting the project's resilience against single points of control.
Click to view current FF Holding Distribution

| Top |
Address |
Holding Qty |
Holding (%) |
| 1 |
0x0df0...d002cc |
2998000.00K |
29.98% |
| 2 |
0xaa7c...a5baf5 |
2400000.00K |
24.00% |
| 3 |
0x0fd7...d9ba24 |
2000000.00K |
20.00% |
| 4 |
0x05dd...77558e |
662684.79K |
6.62% |
| 5 |
0xe89f...e5bd92 |
450000.00K |
4.50% |
| - |
Others |
1489315.21K |
14.9% |
II. Core Factors Influencing FF's Future Price
Market Sentiment and Investor Behavior
- Dual-Market Strategy Impact: FF's unique dual-gene model, operating across both the US and China markets, combined with founder Jia Yueting's personal IP-driven approach to vehicle manufacturing, has created notable market attention and contributed to price movements.
- Historical Volatility Patterns: In October 2024, FF experienced significant volatility with price fluctuations showing a 94.4% range (from $0.85 to $0.04786), accompanied by daily trading volumes ranging from 105 million to 306 million units.
- Current Market Dynamics: As of November 2024, volatility has moderated to approximately 24.7% (ranging between $0.14878 and $0.11868), with daily trading volumes stabilizing around 45 million units, suggesting a gradual market maturation process.
Institutional and Strategic Developments
- Strategic Initiatives: The company has been advancing its bridge strategy connecting the US and China automotive industries, moving from initial framework establishment to strategic consolidation phases.
- Manufacturing Partnerships: FF has secured support from leading Chinese manufacturers, while engaging with influential stakeholders within the US government, potentially impacting long-term market confidence.
- Brand Expansion Plans: The introduction of the FX brand targeting mainstream pricing segments represents a strategic diversification effort aimed at addressing broader consumer segments and potentially expanding market reach.
Technical Levels and Trading Dynamics
- Support and Resistance Analysis: Current trading activity shows the $0.25-$0.29 range functioning as a critical zone, with the $0.25 level having been tested multiple times during November, indicating strengthening buying interest at this price point.
- Breakthrough Patterns: Technical analysis suggests that breaking through key resistance levels has historically led to rapid upward movements, though such advances are often followed by consolidation phases near breakthrough points.
- Liquidity Considerations: As the project continues to develop and liquidity improves over time, volatility levels may gradually decrease, though near-term price action may remain subject to market sentiment shifts.
Macroeconomic Environment
- Currency Market Dynamics: Broader financial market conditions, including US dollar strength and Treasury yield movements, have historically influenced risk asset pricing, which may indirectly affect FF's valuation environment.
- Economic Performance Indicators: The overall economic landscape, including inflation trends and monetary policy expectations, continues to shape investor appetite for growth-oriented assets across various sectors.
III. 2026-2031 FF Price Forecast
2026 Outlook
- Conservative forecast: $0.05698 - $0.08633
- Neutral forecast: $0.08633
- Optimistic forecast: $0.12518 (subject to favorable market conditions and increased adoption)
2027-2029 Mid-term Outlook
- Market stage expectation: The token may experience gradual growth as the project matures and expands its ecosystem partnerships
- Price range forecasts:
- 2027: $0.08566 - $0.14594
- 2028: $0.07173 - $0.1787
- 2029: $0.07766 - $0.16903
- Key catalysts: Ecosystem development, strategic partnerships, and broader market recovery could drive price appreciation during this period
2030-2031 Long-term Outlook
- Baseline scenario: $0.15262 - $0.19117 (assuming steady project development and stable market conditions)
- Optimistic scenario: $0.14425 - $0.21813 (with accelerated adoption and favorable regulatory environment)
- Transformative scenario: Above $0.21813 (contingent on breakthrough developments and mainstream integration)
- 2026-01-16: FF trading within established range as market participants assess long-term value proposition
| Year |
Predicted High Price |
Predicted Average Price |
Predicted Low Price |
Price Change |
| 2026 |
0.12518 |
0.08633 |
0.05698 |
0 |
| 2027 |
0.14594 |
0.10575 |
0.08566 |
22 |
| 2028 |
0.1787 |
0.12585 |
0.07173 |
45 |
| 2029 |
0.16903 |
0.15228 |
0.07766 |
75 |
| 2030 |
0.19117 |
0.16065 |
0.15262 |
85 |
| 2031 |
0.21813 |
0.17591 |
0.14425 |
102 |
IV. FF Professional Investment Strategies and Risk Management
FF Investment Methodology
(1) Long-term Holding Strategy
- Suitable for: Investors seeking exposure to decentralized finance infrastructure with a moderate to high risk tolerance
- Operational recommendations:
- Consider accumulating positions during market corrections when FF trades below its 30-day moving average
- Monitor the project's protocol development progress and partnership announcements for fundamental value drivers
- Implement a cold storage solution using Gate Web3 Wallet for enhanced security of long-term holdings
(2) Active Trading Strategy
- Technical analysis tools:
- Moving averages: Observe the 7-day and 30-day moving averages for trend identification; FF's recent 7-day decline of 0.89% and 30-day decline of 15.73% suggest caution in the near term
- Volume analysis: Monitor the 24-hour trading volume of approximately $1.99 million to assess liquidity and market interest
- Swing trading considerations:
- Set stop-loss orders given FF's volatility, with the token showing a 24-hour range between $0.0857 and $0.09103
- Consider the circulating supply of 2.34 billion tokens (23.4% of total supply) when evaluating potential price movements
FF Risk Management Framework
(1) Asset Allocation Principles
- Conservative investors: 1-3% of crypto portfolio allocation
- Aggressive investors: 5-10% of crypto portfolio allocation
- Professional investors: May allocate up to 15% with appropriate hedging strategies
(2) Risk Hedging Solutions
- Diversification approach: Combine FF holdings with established DeFi blue-chip tokens to reduce protocol-specific risk
- Position sizing: Limit initial exposure and scale in gradually as the project demonstrates sustained adoption
(3) Secure Storage Solutions
- Hot wallet recommendation: Gate Web3 Wallet for active trading and easy access to DeFi protocols
- Cold storage approach: Hardware wallet integration for long-term holdings exceeding trading needs
- Security precautions: Never share private keys, enable two-factor authentication, and regularly update wallet software
V. FF Potential Risks and Challenges
FF Market Risks
- Price volatility: FF has experienced a 47.16% decline over the past year, demonstrating significant price fluctuation that may continue
- Liquidity concerns: With a market cap of approximately $202.8 million and 24-hour volume around $1.99 million, liquidity may be limited during periods of high volatility
- Market sentiment: The token's recent negative price trends across multiple timeframes (1H: +0.55%, 24H: -3.99%, 7D: -0.89%, 30D: -15.73%) reflect challenging market conditions
FF Regulatory Risks
- DeFi protocol scrutiny: Collateralization infrastructure protocols may face evolving regulatory frameworks in different jurisdictions
- Compliance uncertainty: As a universal collateralization protocol, FF may encounter regulatory challenges regarding asset custody and lending practices
- Geographic restrictions: Potential limitations on protocol access in certain regions due to local cryptocurrency regulations
FF Technical Risks
- Smart contract vulnerabilities: As an ERC-20 token deployed on Ethereum, FF relies on smart contract security that requires ongoing audits and monitoring
- Protocol complexity: The universal collateralization infrastructure involves intricate mechanisms that may contain unforeseen technical issues
- Network dependency: FF's functionality depends on Ethereum network performance, which may be affected by congestion or upgrade challenges
VI. Conclusion and Action Recommendations
FF Investment Value Assessment
Falcon Finance presents itself as an infrastructure protocol in the collateralization space, aiming to create sustainable yield opportunities. The project's foundation in trust, transparency, and technology, backed by experienced professionals in blockchain and financial engineering, provides a basis for long-term potential. However, the token's performance over the past year, with a 47.16% decline and recent downward trends across multiple timeframes, indicates significant short-term challenges. The relatively low circulating supply of 23.4% suggests potential future token unlocks that could impact price dynamics. Investors should weigh the project's innovative approach to collateralization infrastructure against current market headwinds and execution risks.
FF Investment Recommendations
✅ Beginners: Consider waiting for clearer signs of price stabilization and increased market adoption before initiating positions; if interested, start with minimal allocation (1-2% of crypto portfolio) and focus on understanding DeFi infrastructure fundamentals
✅ Experienced investors: May consider selective accumulation during significant price corrections while maintaining strict risk management; monitor protocol development milestones and partnership announcements for entry opportunities
✅ Institutional investors: Conduct comprehensive due diligence on protocol mechanics, smart contract audits, and team credentials; consider pilot allocations while monitoring regulatory developments in the DeFi collateralization space
FF Trading Participation Methods
- Spot trading: Purchase FF directly on Gate.com and other supported exchanges for straightforward exposure to the token
- DeFi protocol interaction: Engage with Falcon Finance's collateralization infrastructure directly to understand protocol mechanics and earn potential yields
- Portfolio integration: Include FF as part of a diversified DeFi infrastructure basket alongside other protocols to spread sector-specific risk
Cryptocurrency investment carries extremely high risks, and this article does not constitute investment advice. Investors should make cautious decisions based on their own risk tolerance and are advised to consult professional financial advisors. Never invest more than you can afford to lose.
FAQ
What is the historical price trend of FF token?
FF token has shown fluctuation recently. On January 9, 2026, it traded at $0.08869, January 8 at $0.09057, and January 7 at $0.09889. The token demonstrates dynamic price movement with trading activity reflecting market sentiment.
What are the main factors affecting FF price?
FF price is primarily influenced by market demand, liquidity, trading volume, investor sentiment, and market trends. Network adoption and tokenomics also play significant roles in price movements.
What do professional analysts predict for FF's future price?
Professional analysts predict FF will decline to $0.09923 by mid-December 2025, representing a 24.72% decrease from current levels. However, as the project matures and liquidity improves, long-term volatility is expected to stabilize, presenting potential recovery opportunities for investors monitoring key support levels around $0.25-$0.29.
What are the risks and uncertainties in FF price prediction?
FF price prediction faces market volatility, policy uncertainty, and technical risks. Price manipulation and network security vulnerabilities are primary concerns. Regulatory changes may impact compliance and market dynamics.
Analyze FF price using technical indicators including MACD, RSI, KDJ, StochRSI, ATR, CCI, WR, TRIX, and MA. Monitor trading volume, support and resistance levels, and trend patterns to identify potential price movements and trading opportunities.
* The information is not intended to be and does not constitute financial advice or any other recommendation of any sort offered or endorsed by Gate.