The article offers an expert analysis of Fluence's (FLT) price prediction from 2025 to 2030. It evaluates FLT's market position, historical price trends, and current conditions, focusing on its competitive edge in decentralized cloud computing. Providing valuable insights for investors, the article discusses key factors like market sentiment, macroeconomic influences, and regulatory impacts on FLT's future value. Structured in sections covering historical analysis, price forecasts, investment strategies, and risks, it caters to seasoned investors keen on understanding FLT's investment potential amidst volatile market dynamics. Keywords: Fluence, FLT, decentralized cloud, investment strategies, 2025-2030 outlook.
Introduction: FLT's Market Position and Investment Value
Fluence (FLT) serves as the first decentralized "Cloudless" computing platform, providing an open alternative to major internet cloud monopolies. Since its inception in 2024, Fluence has established itself as a distinctive DePIN network solution. As of December 2025, FLT's market capitalization has reached approximately $11.44 million, with a circulating supply of around 244.59 million tokens and a current price hovering near $0.01144. This innovative asset, recognized for offering computing services up to 80% cheaper than traditional cloud providers while maintaining resilience and verifiability, is playing an increasingly vital role in decentralized computing infrastructure.
This article will conduct a comprehensive analysis of Fluence's price trajectory from 2025 through 2030, integrating historical patterns, market supply-demand dynamics, ecosystem development, and macroeconomic factors to provide investors with professional price forecasts and practical investment strategies.
Fluence (FLT) Market Analysis Report
I. FLT Price History Review and Current Market Status
FLT Historical Price Evolution
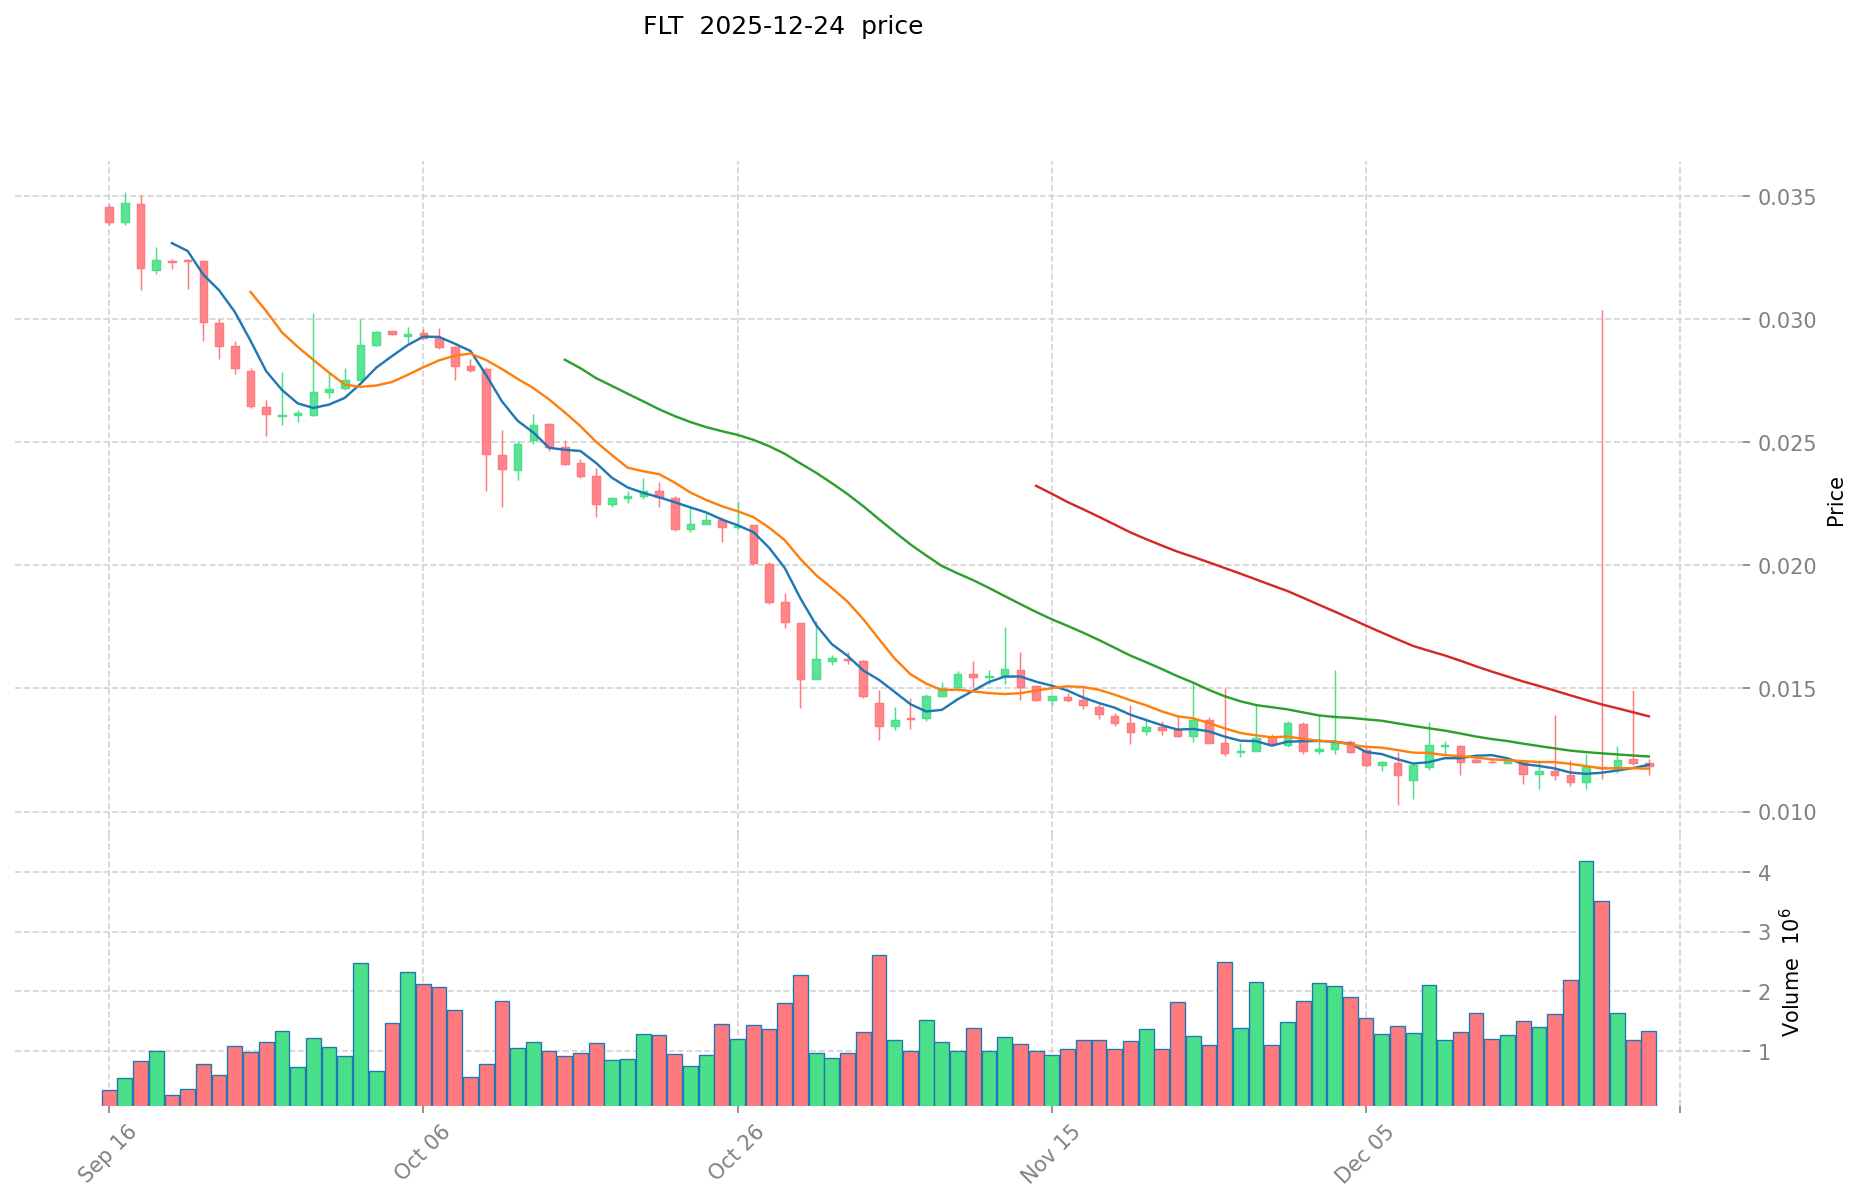
- March 2024: All-time high of $1.55 recorded on March 25, 2024, marking the peak of FLT's price performance since launch.
- December 2025: Sharp decline to all-time low of $0.01025 on December 7, 2025, representing a 99.34% decrease from the historical high over approximately 9 months.
FLT Current Market Conditions
As of December 25, 2025, FLT is trading at $0.01144, reflecting modest recovery from its all-time low recorded just 18 days prior. The token demonstrates recent volatility with the following price movements:
- 1-hour change: +0.26%, indicating slight upward momentum in the immediate term
- 24-hour change: -1.63%, showing minor pullback from recent levels
- 7-day change: -0.23%, suggesting relative price stability over the short-term period
- 30-day change: -14.51%, indicating continued downward pressure over the monthly timeframe
- 1-year change: -96.36%, underscoring the significant decline since the token's launch in March 2024
Market Metrics:
- Current market capitalization: $2,798,086.49 USD
- 24-hour trading volume: $17,114.04 USD
- Circulating supply: 244,587,979.51 FLT tokens (24.46% of total supply)
- Total supply: 1,000,000,000 FLT tokens
- Token holders: 7,653 addresses
- Market dominance: 0.00036%
- Market sentiment: Extreme Fear (VIX: 24)
The token trades across 7 cryptocurrency exchanges, with Gate.com providing market access for interested participants.
Click to view current FLT market price
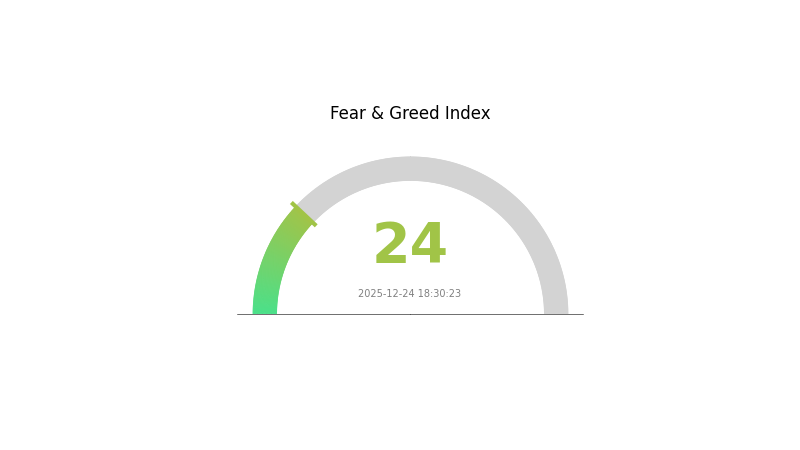
FLT Market Sentiment Index
2025-12-24 Fear and Greed Index: 24 (Extreme Fear)
Click to view current Fear & Greed Index
The cryptocurrency market is currently experiencing extreme fear, with the Fear and Greed Index at 24. This indicates severe market pessimism and heightened investor anxiety. When fear reaches such extreme levels, it often signals potential capitulation selling and market overshooting. Experienced traders frequently view extreme fear as a contrarian buying opportunity, as markets tend to recover from such depressed sentiment levels. However, investors should exercise caution and conduct thorough research before making investment decisions. Risk management remains critical during periods of market turmoil. Monitor market developments closely on Gate.com for real-time data and analysis.
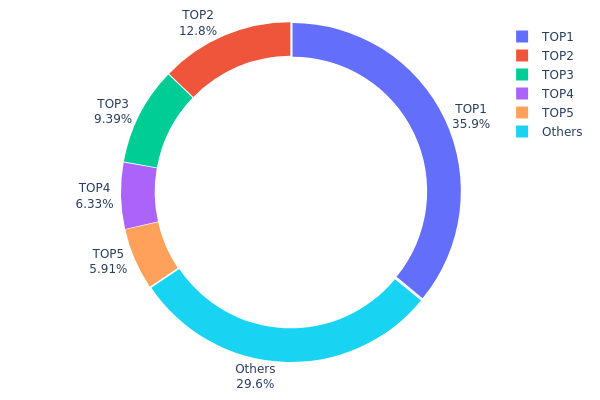
FLT Holding Distribution
The address holding distribution map illustrates the concentration of FLT tokens across different wallet addresses on the blockchain. This metric serves as a critical indicator for assessing token decentralization, market structure health, and the potential for price manipulation. By analyzing the distribution of holdings among top holders and other addresses, investors and analysts can evaluate the token's susceptibility to coordinated selling pressure or market control by large stakeholders.
FLT currently exhibits significant concentration risk, with the top five addresses collectively controlling 70.36% of total token supply. The leading address alone holds 35.94% of all FLT tokens, representing an exceptionally high concentration level that raises concerns about centralization. The second and third largest holders contribute 12.79% and 9.39% respectively, further compounding the concentration effect. While the remaining 29.64% of tokens are distributed across other addresses, this fragmented segment does not materially offset the dominance of the top holders. Such a distribution pattern suggests that FLT's current on-chain structure remains heavily centralized.
This pronounced holder concentration introduces notable market structure vulnerabilities. The concentration of over one-third of the token supply in a single address creates substantial downside price risk, as any significant liquidation or transfer from top holders could trigger substantial selling pressure and volatility. Furthermore, the elevated concentration levels reduce the effective decentralization of the protocol and may limit the diversity of decision-making power across the network. Market participants should remain cognizant that price movements in FLT could be disproportionately influenced by the trading decisions of a small number of large stakeholders, thereby reducing the token's market efficiency and stability.
Click to view current FLT holding distribution
| Top |
Address |
Holding Qty |
Holding (%) |
| 1 |
0x7f62...82afac |
359491.31K |
35.94% |
| 2 |
0xcda6...685cba |
127916.15K |
12.79% |
| 3 |
0x0e0a...634aac |
93926.87K |
9.39% |
| 4 |
0x5e6b...bd6d3a |
63342.59K |
6.33% |
| 5 |
0x2065...e17e77 |
59144.00K |
5.91% |
| - |
Others |
296179.08K |
29.64% |
II. Core Factors Influencing FLT's Future Price
Market Sentiment and Adoption
-
Investor Confidence: Market sentiment and investor confidence directly influence FLT price movements. Positive news regarding widespread adoption or major technological breakthroughs can trigger bullish market reactions, while negative sentiment can lead to price declines.
-
Adoption Rates: The expansion of FLT adoption across various use cases plays a crucial role in determining future price trajectories. Increased adoption by users and projects strengthens the token's utility and market value proposition.
Macroeconomic Environment
-
Monetary Policy Impact: Central bank policies, particularly decisions on interest rates and money supply, influence investment levels and subsequently impact FLT's market value. Changes in monetary conditions can shift capital allocation between different asset classes.
-
Regulatory Changes: Policy decisions and regulatory frameworks significantly impact FLT's market dynamics. Shifts in cryptocurrency regulation at national and international levels can create both opportunities and challenges for price appreciation.
Economic Factors
-
Investment Levels: The volume of capital flowing into FLT-related projects and initiatives directly affects market value. Increased investment activity typically correlates with positive price momentum.
-
Technological Advancements: Progress in technological development and ecosystem improvements supports long-term price growth by enhancing the token's functionality and attractiveness to market participants.
III. FLT Price Forecast 2025-2030
2025 Outlook
- Conservative Forecast: $0.00666-$0.01183
- Base Case Forecast: $0.01149
- Bullish Forecast: $0.01183 (requires sustained market momentum)
2026-2028 Medium-term Outlook
- Market Stage Expectation: Gradual accumulation and recovery phase with incremental growth momentum
- Price Range Forecasts:
- 2026: $0.00851-$0.01458
- 2027: $0.00879-$0.01889
- 2028: $0.00816-$0.02353
- Key Catalysts: Institutional adoption expansion, ecosystem development maturation, market sentiment improvement, and regulatory clarity enhancement
2029-2030 Long-term Outlook
- Base Case Scenario: $0.01681-$0.02333 (assumes steady ecosystem growth and market stabilization)
- Bullish Scenario: $0.01720-$0.02693 (assumes accelerated adoption and positive macroeconomic conditions)
- Transformational Scenario: $0.02693+ (extreme favorable conditions including breakthrough partnerships, major protocol upgrades, and sustained bull market sentiment)
- 2030-12-31: FLT projected at $0.02155 average valuation (mid-cycle consolidation phase)
Note: Price predictions are subject to market volatility, regulatory changes, and macroeconomic factors. Historical performance does not guarantee future results. Investors should conduct thorough due diligence before making investment decisions through authorized platforms like Gate.com.
| 年份 |
预测最高价 |
预测平均价格 |
预测最低价 |
涨跌幅 |
| 2025 |
0.01183 |
0.01149 |
0.00666 |
0 |
| 2026 |
0.01458 |
0.01166 |
0.00851 |
1 |
| 2027 |
0.01889 |
0.01312 |
0.00879 |
14 |
| 2028 |
0.02353 |
0.01601 |
0.00816 |
39 |
| 2029 |
0.02333 |
0.01977 |
0.0172 |
72 |
| 2030 |
0.02693 |
0.02155 |
0.01681 |
88 |
Fluence (FLT) Professional Investment Analysis Report
IV. FLT Professional Investment Strategy and Risk Management
FLT Investment Methodology
(1) Long-term Holding Strategy
-
Suitable Investors: Believers in decentralized cloud computing infrastructure and DePIN ecosystem development; investors with medium to long-term time horizons (1-3+ years); those seeking exposure to computing infrastructure alternatives.
-
Operational Recommendations:
- Accumulate during market downturns when FLT trades significantly below the $0.70 launch price, taking advantage of current low valuations.
- Set up dollar-cost averaging (DCA) plans to reduce timing risk and gradually build positions over 6-12 months.
- Monitor project milestones including network adoption metrics, data center partnerships, and application deployments on the Fluence platform.
-
Storage Solution:
- Store FLT tokens on Gate Web3 Wallet for secure self-custody with institutional-grade security standards.
- Enable two-factor authentication and backup recovery phrases in multiple secure locations.
- For larger holdings, consider cold storage solutions with regular security audits.
(2) Active Trading Strategy
FLT Risk Management Framework
(1) Asset Allocation Principles
- Conservative Investors: Allocate 1-2% of portfolio to FLT; prioritize capital preservation and only invest amounts you can afford to lose completely.
- Active Investors: Allocate 3-5% of portfolio; balance FLT positions with established cryptocurrencies and traditional assets.
- Professional Investors: Allocate up to 8-10% for specialized DePIN and infrastructure-focused portfolios; implement sophisticated hedging through derivatives and options strategies.
(2) Risk Hedging Solutions
- Diversification Strategy: Combine FLT with other established Layer 1 blockchains and infrastructure projects to reduce single-project concentration risk; maintain minimum 70% allocation to lower-volatility assets.
- Position Sizing: Limit individual trade sizes to 1-3% of total capital; use stop-loss orders at 15-20% below entry points to contain downside exposure.
(3) Secure Storage Solution
- Hot Wallet Option: Gate Web3 Wallet is recommended for frequent trading and active management, offering convenient access while maintaining security standards through multi-signature protocols.
- Cold Storage Plan: For long-term holdings exceeding $10,000 equivalent, transfer FLT to hardware-isolated storage with offline key management and regular security verification.
- Security Considerations: Never share private keys or seed phrases; enable withdrawal whitelisting on Gate.com accounts; periodically audit wallet activity for unauthorized transactions; maintain updated backups in geographically dispersed secure locations.
V. FLT Potential Risks and Challenges
FLT Market Risk
- Extreme Price Volatility: FLT has experienced a catastrophic 96.36% annual decline from its launch price of $0.70, indicating severe market repricing of project value; continued volatility poses significant risks to retail investors.
- Low Trading Liquidity: With only 24-hour volume of $17,114 and presence on just 7 exchanges, FLT faces liquidity constraints that could result in slippage and difficulty executing large positions without price impact.
- Limited Market Capitalization: The fully diluted valuation of $11.44 million represents a micro-cap asset class with inherent susceptibility to manipulation and sudden price movements based on minimal trading activity.
FLT Regulatory Risk
- Unclear Regulatory Status: The classification of DePIN computing tokens remains ambiguous in major jurisdictions; potential regulatory crackdowns on decentralized infrastructure could negatively impact project viability and token value.
- Jurisdictional Compliance: As Fluence operates globally across multiple regulatory environments, changes in any jurisdiction's stance toward distributed computing platforms could trigger forced delisting or service restrictions.
- Securities Law Exposure: Depending on how FLT token is ultimately classified, it could face securities regulation requirements, potentially leading to trading restrictions or additional compliance obligations.
FLT Technical Risk
- Platform Adoption Uncertainty: Fluence's success depends on achieving meaningful adoption by developers and enterprises; failure to compete with established cloud providers could render the platform economically unviable.
- Network Security Concerns: As a decentralized computing platform handling user applications and data, vulnerabilities in consensus mechanisms or node infrastructure could expose users to security breaches or data loss.
- Technological Obsolescence: Rapid advancement in cloud computing, edge computing, or alternative decentralized solutions could render Fluence's technology stack outdated before achieving market penetration.
VI. Conclusion and Action Recommendations
FLT Investment Value Assessment
Fluence presents an ambitious vision for decentralizing cloud computing infrastructure at a significantly depressed valuation. However, the 96.36% annual price decline reflects severe market skepticism regarding its ability to compete with incumbent cloud providers and achieve meaningful adoption. While the 80% cost advantage over traditional cloud infrastructure is theoretically compelling, real-world implementation, network effects, and developer adoption remain unproven. The project carries substantial execution risk combined with limited liquidity and market capitalization, making it suitable only for high-risk-tolerance investors with conviction in long-term DePIN infrastructure development.
FLT Investment Recommendations
✅ Beginners: Avoid direct FLT investment; if interested in DePIN ecosystem exposure, consider larger-cap infrastructure projects with established track records and higher liquidity first. If you must invest, limit to 0.5% of portfolio as a speculative position only.
✅ Experienced Investors: Consider FLT as a high-risk, high-reward allocation (2-3% of portfolio) within a diversified DePIN or infrastructure-focused sub-portfolio; employ strict stop-loss disciplines and dollar-cost averaging entry strategies over extended periods.
✅ Institutional Investors: Evaluate FLT only after comprehensive technical due diligence on platform architecture, competitive positioning against established cloud providers, and detailed analysis of network adoption potential; consider position sizing of 5-10% only if aligned with dedicated infrastructure investment mandates.
FLT Trading and Participation Methods
- Direct Purchase on Gate.com: Access FLT trading pairs directly through Gate.com's spot trading interface; current market conditions allow for limit orders at preferred price points given low trading velocity.
- Gradual Accumulation Strategy: Implement dollar-cost averaging purchases across weekly or monthly intervals to reduce timing risk and average entry prices over longer periods.
- Secure Transfer to Self-Custody: After purchase on Gate.com, transfer FLT to Gate Web3 Wallet for autonomous control; maintain diversified storage across hot and cold wallets based on intended holding periods.
Cryptocurrency investments carry extreme risk and volatility. This report does not constitute investment advice. Investors must conduct independent research and consult qualified financial advisors before making investment decisions. Never invest capital you cannot afford to lose completely. Past performance does not guarantee future results. The crypto market remains highly speculative and subject to rapid fundamental changes.
FAQ
What is the price prediction for FLT TSX?
FLT TSX price prediction for 2026 is 0.97 CAD, with estimates ranging from 0.80 CAD to 1.25 CAD based on analyst forecasts. Actual prices may vary as market conditions evolve.
How much is the FLT token worth?
The FLT token is currently worth $0.01197 as of December 24, 2025. With a total supply of 1 billion tokens and 7,651 holders, FLT maintains steady market presence in the DeFi ecosystem.
Does Flux coin have a future?
Yes, Flux has strong potential. With growing adoption in decentralized computing and cloud infrastructure, projections suggest it could reach $6.5 by 2030. Market momentum and technological development support long-term growth.
* The information is not intended to be and does not constitute financial advice or any other recommendation of any sort offered or endorsed by Gate.