This comprehensive guide analyzes FLUID token's market position and provides expert price forecasts from 2026 to 2031. As a lending protocol within Instadapp's DeFi ecosystem, FLUID currently trades at $3.23 with a $127.5 million market cap, showing 18.6% monthly growth despite 45% year-over-year decline. The article examines historical price evolution, technical development roadmap including DEX v2 upgrades and Layer 2 expansion, and macroeconomic influences affecting valuation. Price predictions range from $2.61-$4.30 in 2026 to $6.39-$9.62 by 2031, representing potential 112% cumulative growth. The analysis covers supply mechanisms, institutional adoption through Aave partnerships, and competitive positioning. Professional investment strategies include long-term holding and active trading approaches with detailed risk management frameworks. Key considerations include liquidity risks from token unlocks, regulatory uncertainties, and smart contract vulnerabilities. Investors can participate through Gate spot
Introduction: FLUID's Market Position and Investment Value
Fluid (FLUID), as a lending protocol under the multi-chain DeFi management platform Instadapp, has been developing since its launch in 2021. As of 2026, FLUID has achieved a market capitalization of approximately $127.5 million, with a circulating supply of around 39.44 million tokens, and its price maintains at approximately $3.23. This asset, recognized as an innovative DeFi lending solution, is playing an increasingly critical role in the decentralized finance lending sector.
This article will comprehensively analyze FLUID's price trends from 2026 to 2031, combining historical patterns, market supply and demand, ecosystem development, and macroeconomic environment, to provide investors with professional price forecasts and practical investment strategies.
I. FLUID Price History Review and Market Status
FLUID Historical Price Evolution Trajectory
- 2021: Token officially launched in June, marking the beginning of its market journey with initial price discovery phase
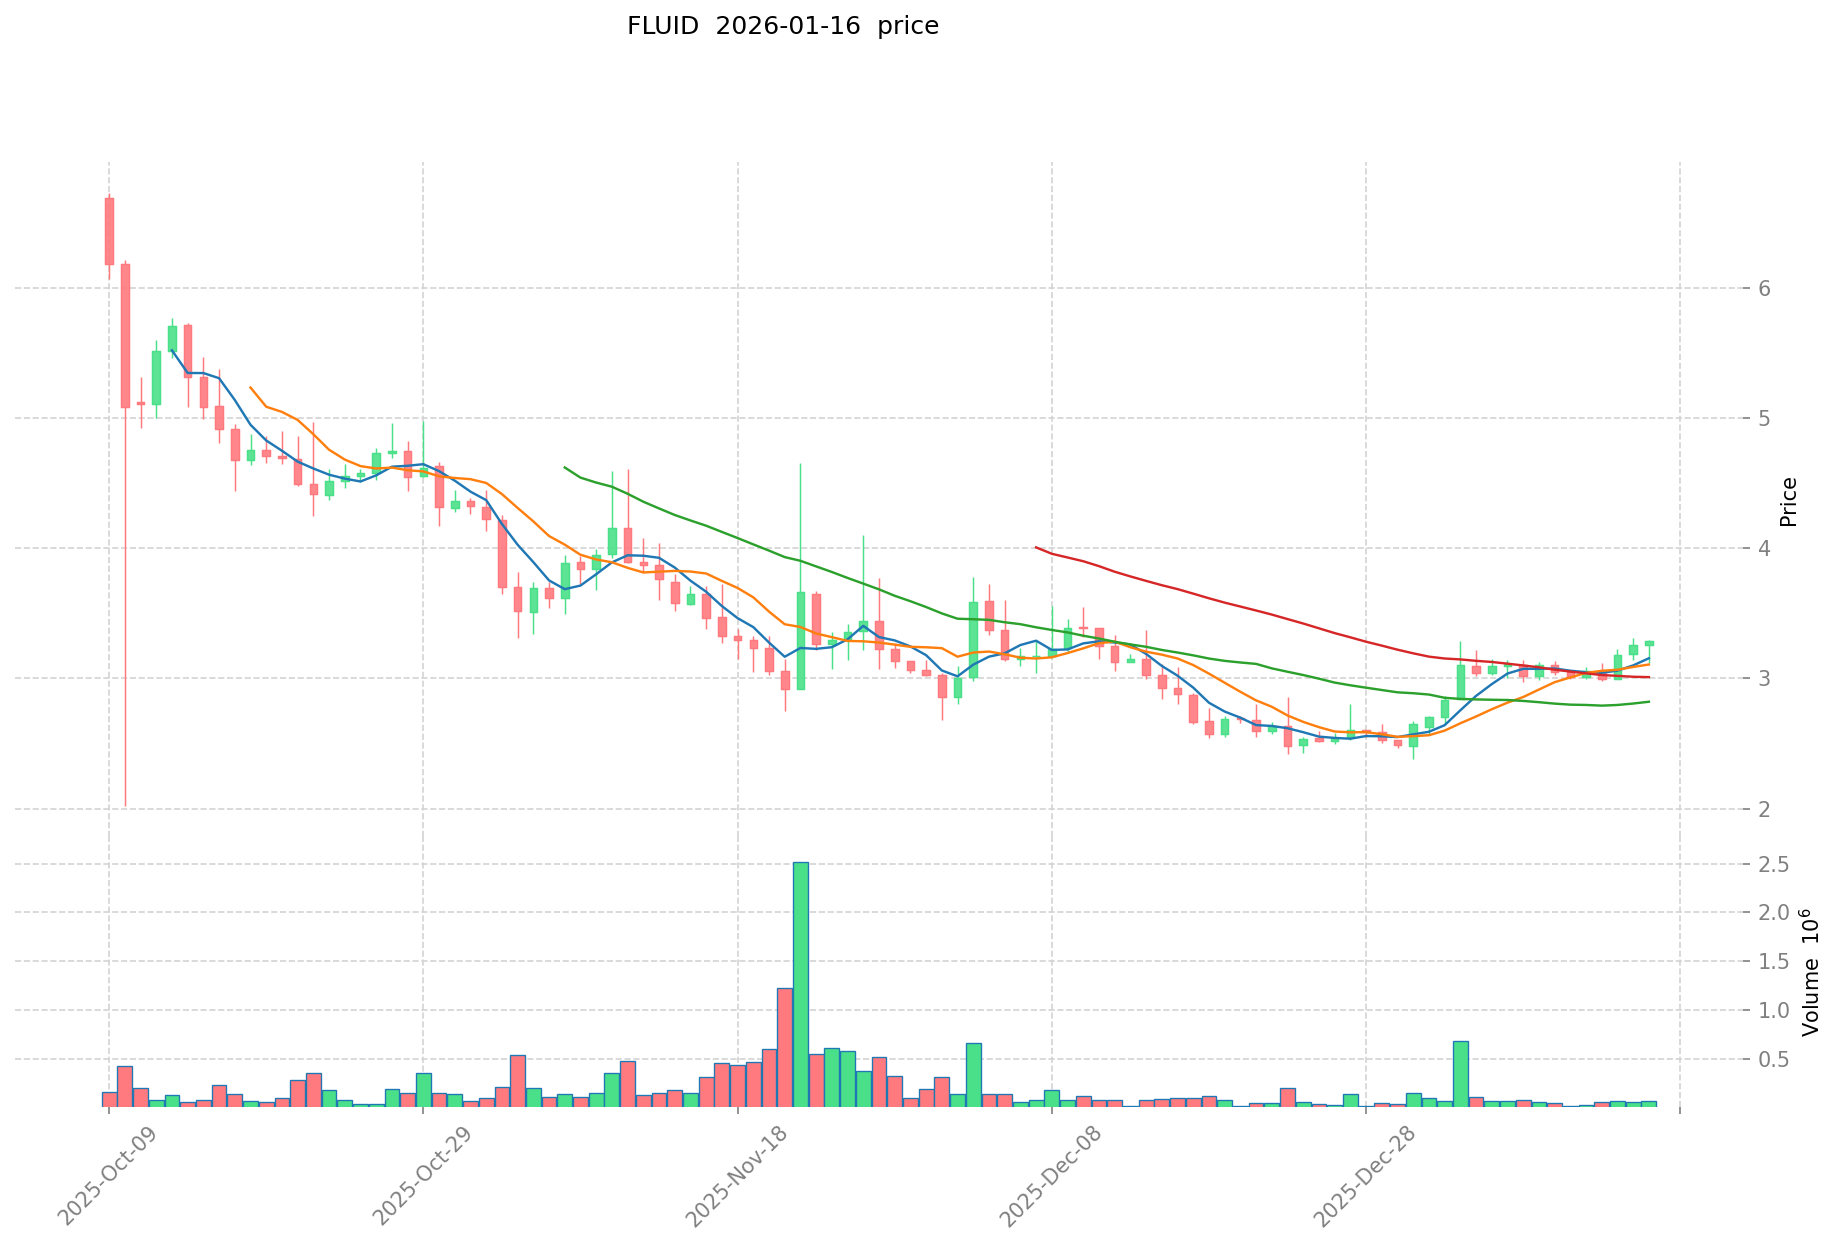
- 2025: Experienced significant volatility throughout the year, reaching an all-time high of $11 on September 24, followed by a sharp correction to an all-time low of $2.017 on October 10
- 2026: Price has shown recovery momentum with a 30-day increase of 18.6%, currently trading at $3.233
FLUID Current Market Situation
As of January 17, 2026, FLUID is trading at $3.233, representing a 2.57% increase over the past 24 hours. The token has demonstrated positive short-term momentum with a 4.93% gain over the past week and an 18.6% increase over the past month. However, the year-over-year performance shows a decline of 45%, reflecting the broader market challenges faced in 2025.
The current 24-hour trading range spans from $3.118 to $3.291, with a total trading volume of $142,770.88. FLUID maintains a market capitalization of approximately $127.5 million, ranking 317th among cryptocurrencies with a market dominance of 0.0096%. The circulating supply stands at 39,436,803 tokens, representing 39.44% of the maximum supply of 100 million tokens, resulting in a fully diluted valuation of $323.3 million.
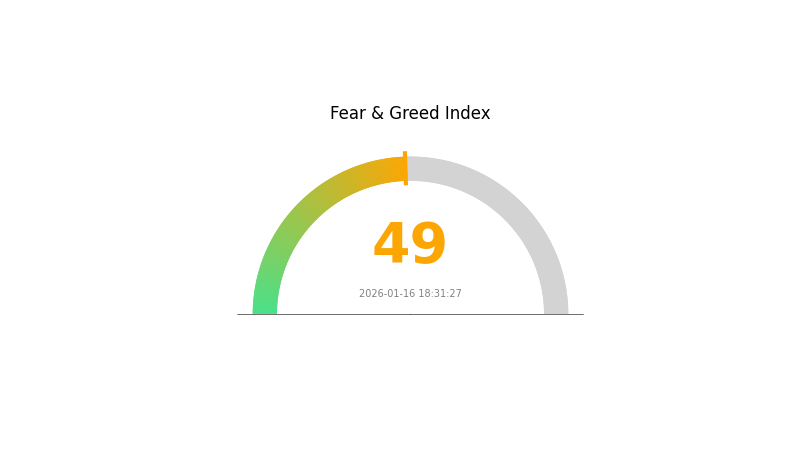
The token is actively traded across 20 exchanges and has attracted a community of 11,059 holders. The market-cap-to-FDV ratio of 39.44% indicates substantial token unlock potential in the future. Currently, the Gate market emotion indicator shows a neutral reading of 49, suggesting balanced market sentiment without extreme fear or greed.
Click to view the current FLUID market price
FLUID Market Sentiment Index
2026-01-16 Fear & Greed Index: 49 (Neutral)
Click to view current Fear & Greed Index
The cryptocurrency market is currently displaying neutral sentiment with an index reading of 49. This balanced state suggests that neither fear nor greed is dominating market behavior at present. Investors should maintain a measured approach, as neutral conditions often precede significant market movements. Market participants are advised to stay vigilant and monitor developments closely. Such periods typically offer opportunities for strategic positioning while requiring careful risk management to navigate potential volatility ahead.
FLUID Holding Distribution
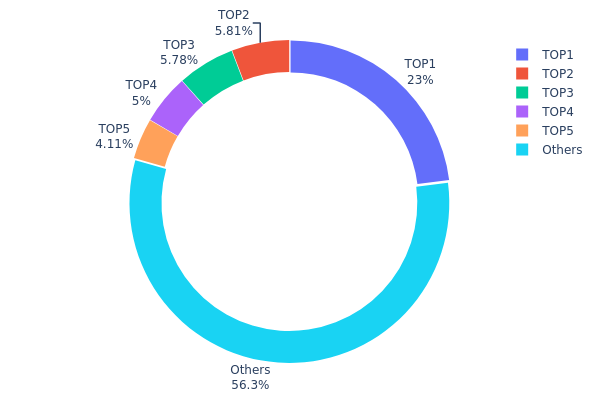
The holding distribution chart illustrates the concentration of FLUID tokens across different wallet addresses, revealing the degree of decentralization and potential market control risks. By analyzing the percentage of tokens held by top addresses versus smaller holders, we can assess the token's ownership structure and its implications for market stability.
Currently, FLUID exhibits a moderate to high concentration pattern. The top address holds approximately 22.96% of the total supply (22.97 million tokens), while the top five addresses collectively control 43.63% of the circulating supply. This level of concentration suggests that a relatively small group of major holders—potentially including the project team, early investors, or institutional participants—maintains significant influence over the token's market dynamics. The remaining 56.37% is distributed among other addresses, indicating some degree of decentralization but not enough to completely mitigate concentration risks.
This distribution structure presents both opportunities and risks for market participants. On one hand, the substantial holdings by top addresses may indicate strong confidence from early stakeholders and potentially provide price stability during market turbulence. On the other hand, such concentration increases the vulnerability to large-scale sell-offs, which could trigger significant price volatility if major holders decide to liquidate their positions. The current structure suggests that while FLUID has achieved some level of community distribution, monitoring the behavior of top holders remains crucial for anticipating potential market movements and assessing the token's long-term decentralization trajectory.
Click to view current FLUID Holding Distribution
| Top |
Address |
Holding Qty |
Holding (%) |
| 1 |
0x2884...884d09 |
22967.46K |
22.96% |
| 2 |
0x8675...37dffa |
5808.21K |
5.80% |
| 3 |
0xeeda...6b1505 |
5775.02K |
5.77% |
| 4 |
0xb671...ef422f |
5000.00K |
5.00% |
| 5 |
0xd21f...87ccf6 |
4107.49K |
4.10% |
| - |
Others |
56341.82K |
56.37% |
II. Core Factors Influencing FLUID's Future Price
Supply Mechanism
- Fixed Supply Model: FLUID has a maximum supply of 100,000,000 tokens, with a circulating supply of approximately 77,032,540 FLUID. This fixed-cap tokenomics creates potential scarcity dynamics that may support value appreciation over time.
- Historical Pattern: The protocol's token distribution follows a structured approach designed to balance ecosystem growth with supply stability, though detailed historical unlock schedules require monitoring for potential market impact.
- Current Impact: As approximately 77% of total supply is already in circulation, future price movements may be less affected by new token releases compared to projects with lower circulation ratios.
Institutional and Major Holder Dynamics
- Institutional Holdings: In November 2024, Aave community passed an ARFC proposal to invest in INST tokens and establish a strategic partnership with Instadapp, providing support for GHO trading pairs on Fluid and promoting cross-protocol product development.
- Enterprise Adoption: Fluid has integrated with major DeFi protocols including Aave, Compound, MakerDAO, and Uniswap, establishing itself as a key infrastructure layer in the decentralized finance ecosystem.
- Regulatory Considerations: As a DeFi protocol, FLUID's development trajectory remains sensitive to evolving regulatory frameworks governing decentralized finance globally.
Macroeconomic Environment
- Monetary Policy Impact: Like other digital assets, FLUID's valuation may respond to Federal Reserve policy decisions and global monetary conditions, though its DeFi-specific utility may provide some insulation from broader market trends.
- Inflation Hedge Characteristics: While FLUID's fixed supply theoretically provides anti-inflationary properties, its relatively short operational history limits conclusive analysis of its behavior during inflationary periods.
- Geopolitical Factors: Market volatility stemming from international tensions may influence risk appetite for DeFi assets, though Fluid's decentralized nature and protocol-level utility may offer some resilience.
Technical Development and Ecosystem Building
- DEX v2 Upgrade: Fluid plans to launch DEX v2 within the next 12 months, which aims to enhance trading efficiency and capital utilization, potentially strengthening its competitive position in the decentralized exchange landscape.
- Layer 2 Expansion: The protocol intends to deploy new DEX infrastructure on Layer 2 networks, which could reduce transaction costs and improve accessibility for a broader user base.
- Cross-Chain Capabilities: Future roadmap includes expanding cross-chain functionality to enhance DeFi ecosystem liquidity integration, enabling seamless asset movement across multiple blockchain networks.
- Ecosystem Applications: Fluid currently operates as the third-largest DEX on Ethereum by trading volume, with 7-day trading volume reaching $428 million and Total Value Locked (TVL) surpassing $920 million as of early 2025, demonstrating strong market traction.
III. 2026-2031 FLUID Price Prediction
2026 Outlook
- Conservative Prediction: $2.61 - $3.26
- Neutral Prediction: $3.26 - $3.26
- Optimistic Prediction: $3.26 - $4.30 (requires favorable market conditions and increased adoption)
2027-2029 Outlook
- Market Stage Expectation: FLUID is anticipated to enter a growth phase characterized by gradual price appreciation and expanding market recognition. The token may benefit from broader cryptocurrency market momentum and potential platform developments.
- Price Range Predictions:
- 2027: $3.40 - $4.99, representing approximately 16% growth
- 2028: $2.94 - $6.31, with potential 35% increase under favorable conditions
- 2029: $4.65 - $7.33, possibly reaching 65% growth milestone
- Key Catalysts: Market maturation, potential technological upgrades, increased liquidity provision activities, and broader DeFi ecosystem expansion could serve as primary drivers for price advancement.
2030-2031 Long-term Outlook
- Baseline Scenario: $6.15 - $7.41 (assuming steady market development and maintained user engagement)
- Optimistic Scenario: $6.87 - $9.62 (contingent upon significant platform growth and favorable regulatory environment)
- Transformative Scenario: Potential to exceed $9.62 (requires exceptional market conditions, major partnerships, or breakthrough protocol innovations)
- 2031-12-31: FLUID could potentially reach $6.39 - $9.62 range (representing cumulative growth of approximately 112% from 2026 baseline, subject to market conditions and project execution)
| Year |
Predicted High Price |
Predicted Average Price |
Predicted Low Price |
Price Change |
| 2026 |
4.29924 |
3.257 |
2.6056 |
0 |
| 2027 |
4.98712 |
3.77812 |
3.40031 |
16 |
| 2028 |
6.31097 |
4.38262 |
2.93635 |
35 |
| 2029 |
7.32511 |
5.3468 |
4.65171 |
65 |
| 2030 |
7.41306 |
6.33595 |
6.14587 |
95 |
| 2031 |
9.62431 |
6.87451 |
6.39329 |
112 |
IV. FLUID Professional Investment Strategy and Risk Management
FLUID Investment Methodology
(1) Long-term Holding Strategy
- Target Investors: Investors with a multi-year perspective who believe in the long-term development of DeFi lending protocols and have moderate to high risk tolerance
- Operational Recommendations:
- Consider accumulating positions during market corrections when FLUID trades below its 30-day average price
- Establish a diversified position over time rather than investing all capital at once, potentially allocating 5-10% of crypto portfolio to FLUID
- Storage Solution: Utilize Gate Web3 Wallet for secure self-custody with multi-signature protection capabilities
(2) Active Trading Strategy
- Technical Analysis Tools:
- Moving Averages: Monitor 7-day and 30-day moving averages to identify potential trend reversals; FLUID's recent 4.93% weekly gain suggests short-term momentum
- Support and Resistance Levels: Track historical high ($11) and low ($2.017) levels as psychological barriers, with current price at $3.233 suggesting substantial upside potential if protocol adoption increases
- Swing Trading Considerations:
- FLUID's 24-hour volatility range ($3.118-$3.291) provides opportunities for intraday traders with appropriate risk management
- Monitor broader DeFi lending sector trends and Instadapp ecosystem developments for trading signals
FLUID Risk Management Framework
(1) Asset Allocation Principles
- Conservative Investors: 2-3% of total crypto portfolio allocation
- Aggressive Investors: 5-8% of total crypto portfolio allocation
- Professional Investors: Up to 10-15% with active hedging strategies
(2) Risk Hedging Solutions
- Portfolio Diversification: Combine FLUID holdings with established DeFi blue-chips and stablecoins to reduce protocol-specific risk
- Position Sizing: Implement stop-loss orders at 15-20% below entry points to limit downside exposure
(3) Secure Storage Solutions
- Hot Wallet Recommendation: Gate Web3 Wallet for active trading with convenient access to Gate.com exchange
- Cold Storage Option: Hardware wallet integration through Gate Web3 Wallet for long-term holdings exceeding $10,000
- Security Precautions: Enable two-factor authentication, verify contract addresses (0x6f40d4a6237c257fff2db00fa0510deeecd303eb on Ethereum), and never share private keys or seed phrases
V. FLUID Potential Risks and Challenges
FLUID Market Risks
- Liquidity Risk: With a circulating supply of only 39.44% of max supply (39.4M/100M tokens), token unlocks or large holder distributions could create selling pressure
- Volatility Risk: FLUID has experienced a 45% decline over the past year, demonstrating significant price fluctuations characteristic of DeFi lending tokens
- Competition Risk: The DeFi lending sector includes numerous established protocols, requiring FLUID to continuously innovate to maintain market share
FLUID Regulatory Risks
- DeFi Protocol Scrutiny: Increasing global regulatory attention on DeFi lending platforms may impact operational flexibility and user accessibility
- Compliance Requirements: Potential future KYC/AML requirements for DeFi protocols could affect user adoption and protocol economics
- Jurisdictional Uncertainty: Regulatory frameworks for DeFi lending vary significantly across jurisdictions, creating operational complexity
FLUID Technical Risks
- Smart Contract Vulnerabilities: Lending protocols face inherent risks of code exploits or bugs despite auditing processes
- Oracle Dependency: DeFi lending protocols rely on price oracles for accurate asset valuation, creating potential manipulation risks
- Ethereum Network Risks: As an ERC20 token, FLUID is subject to Ethereum network congestion, gas fee volatility, and potential protocol-level issues
VI. Conclusion and Action Recommendations
FLUID Investment Value Assessment
FLUID represents a lending protocol within the Instadapp multi-chain DeFi ecosystem, offering exposure to the evolving DeFi lending sector. With a current market capitalization of approximately $127.5M and a fully diluted valuation of $323.3M, the protocol shows moderate-scale positioning in the DeFi landscape. Recent price performance indicates short-term positive momentum (18.6% monthly gain), though the year-over-year decline of 45% suggests investors should approach with measured expectations. The protocol's long-term value proposition depends on successful differentiation in the competitive lending market and sustained adoption growth. Short-term risks include market volatility, regulatory developments affecting DeFi protocols, and competition from established lending platforms.
FLUID Investment Recommendations
✅ Beginners: Start with small allocations (1-2% of crypto portfolio) to gain exposure while learning about DeFi lending mechanisms; use Gate.com's spot trading platform for straightforward purchasing
✅ Experienced Investors: Consider position building during market corrections with 5-8% portfolio allocation; combine with broader DeFi holdings for sector diversification
✅ Institutional Investors: Conduct thorough due diligence on protocol mechanics, smart contract audits, and competitive positioning before allocating capital; implement professional custody solutions and risk management frameworks
FLUID Trading Participation Methods
- Spot Trading on Gate.com: Direct purchase and sale of FLUID with various trading pairs and competitive liquidity
- Dollar-Cost Averaging: Systematic periodic purchases to reduce timing risk and build positions over time
- Yield Strategies: Explore potential staking or liquidity provision opportunities within the Instadapp ecosystem as they become available
Cryptocurrency investment carries extremely high risks, and this article does not constitute investment advice. Investors should make prudent decisions based on their own risk tolerance and are advised to consult professional financial advisors. Never invest more than you can afford to lose.
FAQ
What is FLUID token and what is its purpose?
FLUID token represents unregistered equity in Fluid Finance, with the goal of eventually distributing dividends to registered token holders. It is used to achieve specific levels on the platform, with required token quantities dynamically adjusting based on current price.
How to predict the future price trend of FLUID?
FLUID price prediction is based on technical analysis, market sentiment, and trading volume trends. Historical data suggests FLUID may reach $6.13 in 2025 and $6.12 by February 2026. Monitor on-chain metrics and market cycles for informed predictions.
What are the main factors affecting FLUID price?
FLUID price is primarily influenced by DeFi market sentiment, overall cryptocurrency trends, platform adoption rates, and total value locked in the protocol. Trading volume, investor demand, and macroeconomic conditions also play significant roles.
FLUID reached a peak price of $11.00 in September 2025 and dropped to $2.017 in October 2025, representing significant volatility in its trading history.
What risks should I be aware of when investing in FLUID?
FLUID carries system complexity risks where protocol vulnerabilities could trigger cascading effects across multiple modules. Market volatility and smart contract risks require careful consideration. Investors should understand the protocol's architecture and monitor security developments closely.
* The information is not intended to be and does not constitute financial advice or any other recommendation of any sort offered or endorsed by Gate.