This comprehensive FTT price analysis examines the FTX Token's trajectory from 2026-2031, currently trading at $0.5234 with a market cap of $172 million. The article reviews FTT's historical evolution from its $1.7354 launch price to an $84.18 peak in 2021, followed by a dramatic decline to recent lows. It analyzes core factors including extreme token concentration (59.55% held by top holder), macroeconomic influences, and regulatory challenges. The forecast predicts conservative 2026 range of $0.29-$0.52, with potential recovery to $0.70-$1.15 by 2030-2031 under favorable conditions. Investment strategies span long-term holding and active trading on Gate, complemented by detailed risk management frameworks. The analysis emphasizes FTT's high-risk profile, recommending minimal allocation under 2% for experienced investors while advising beginners to avoid until market stabilization occurs.
Introduction: FTT's Market Position and Investment Value
FTX Token (FTT), originally designed as the native utility token of the FTX ecosystem, has undergone significant transformation since its launch in 2019. As of January 16, 2026, FTT maintains a market capitalization of approximately $172 million, with a circulating supply of around 328.9 million tokens and a current price hovering at $0.52. Despite facing substantial challenges in recent years, this token continues to function within specific market segments and maintains presence across 23 cryptocurrency exchanges.
Currently ranked 264th by market capitalization with a market share of 0.0050%, FTT represents a case study in crypto asset volatility and recovery dynamics. The token experienced its all-time high of $84.18 in September 2021, contrasting sharply with its all-time low of $0.451119 recorded in December 2025. With approximately 30,994 holders and trading volume of $109,144 in the past 24 hours, FTT demonstrates ongoing market participation despite reduced liquidity compared to major cryptocurrencies.
This comprehensive analysis examines FTT's price trajectory from 2026 through 2031, incorporating historical patterns, supply-demand dynamics, ecosystem developments, and broader macroeconomic factors. Our research aims to provide investors with professional price forecasts and practical investment strategies, acknowledging both the opportunities and risks inherent in this digital asset. Understanding FTT's unique position requires careful consideration of its technical implementation on the Ethereum network, its tokenomics structure with a fixed maximum supply, and the evolving regulatory landscape affecting platform tokens.
I. FTT Price History Review and Market Status
FTT Historical Price Evolution Trajectory
- 2019: FTT launched on July 29, 2019, with an initial offering price of approximately $1.7354
- 2021: FTT reached its all-time high of $84.18 on September 10, 2021, representing significant growth from its launch price
- 2022-2025: The token experienced considerable volatility, with price movements reflecting broader market conditions
- 2025: FTT reached its all-time low of $0.451119 on December 30, 2025, marking a substantial decline from historical peaks
FTT Current Market Status
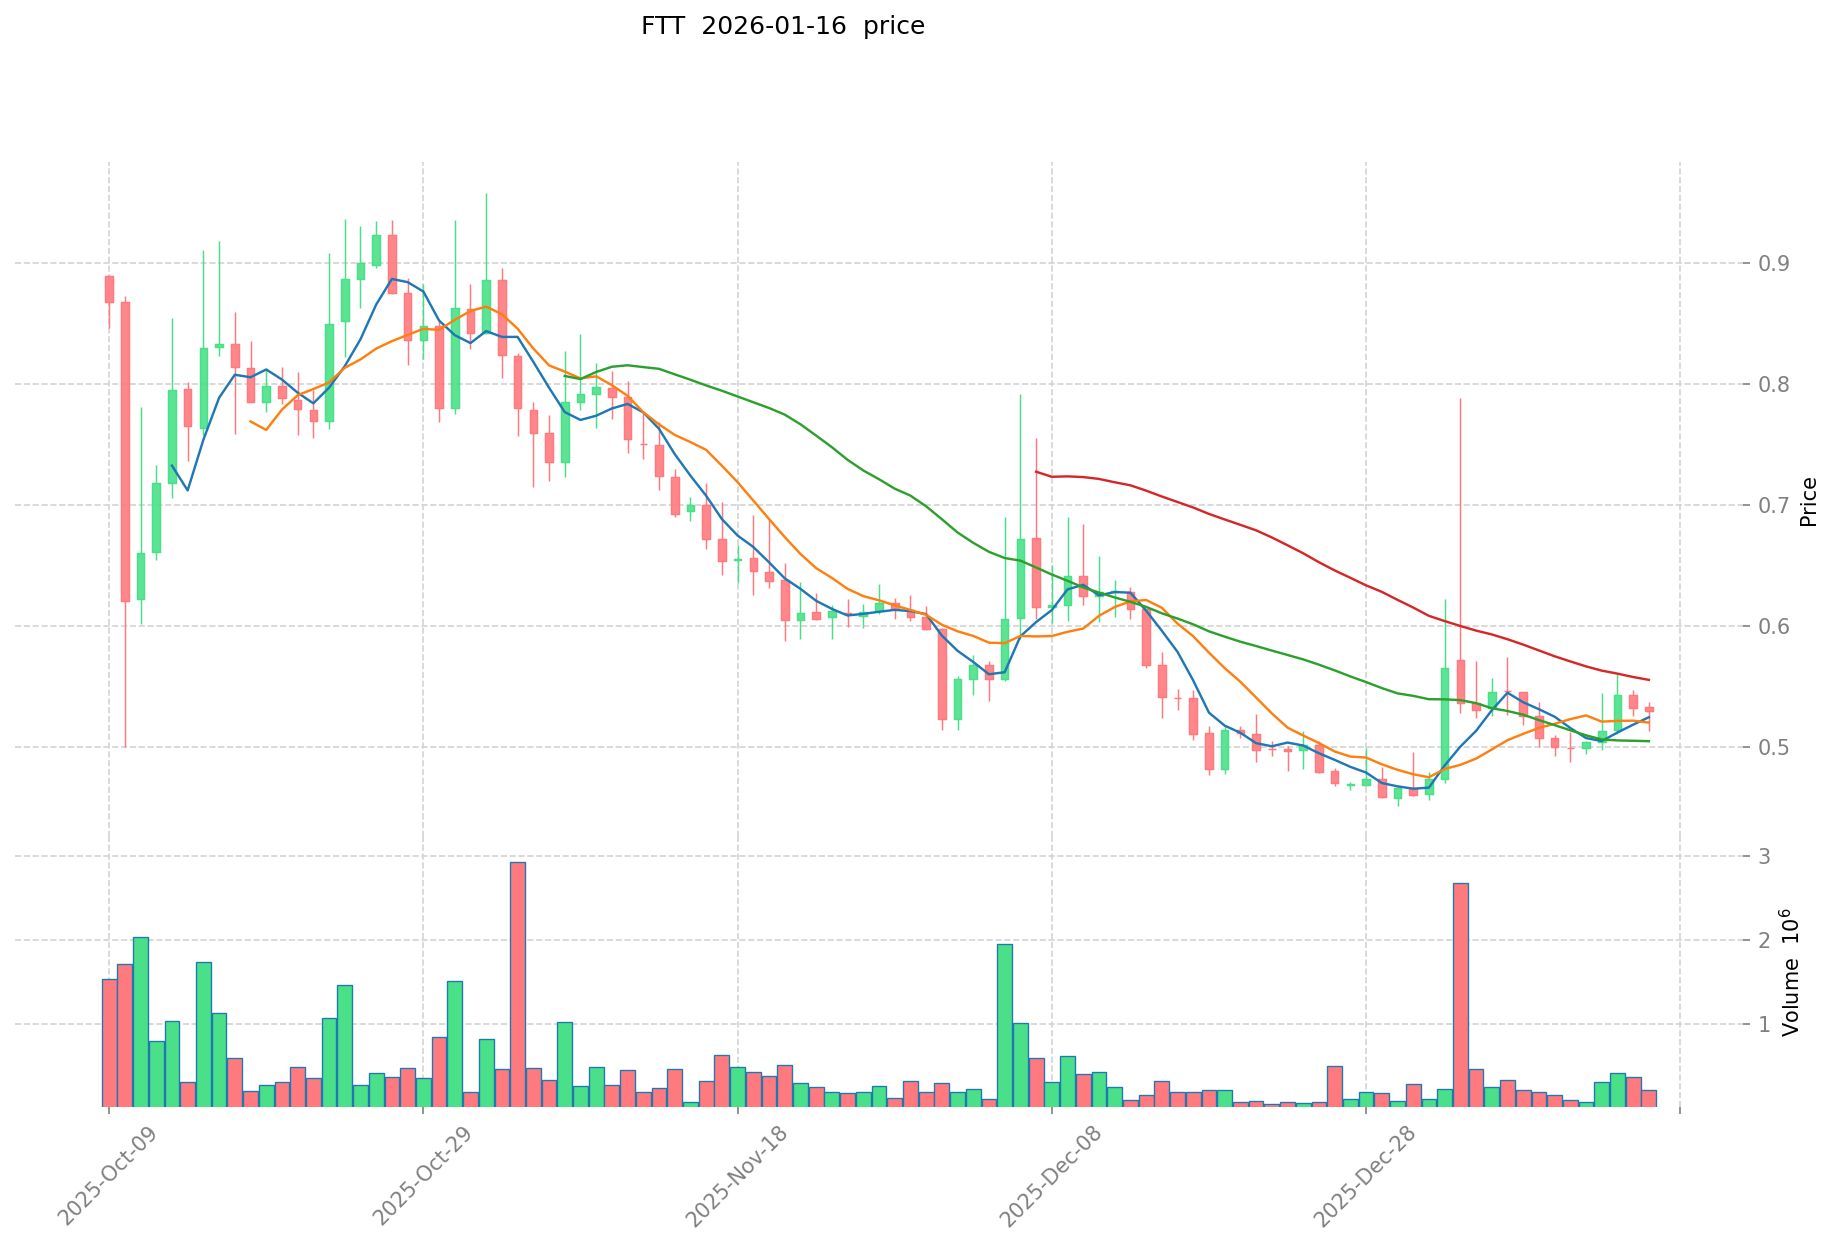
As of January 16, 2026, FTT is trading at $0.5234, showing a modest recovery from its recent low. The token has demonstrated mixed short-term performance, with a 1-hour change of -0.11% and a 24-hour decline of -0.51%. However, the 7-day performance shows a positive trend of +3.57%, suggesting some recent price momentum.
The token's market capitalization stands at approximately $172.14 million, with a circulating supply of 328.90 million FTT tokens, representing 100% of the maximum supply. The 24-hour trading volume is recorded at $109,144.74. FTT currently ranks #264 in the cryptocurrency market, accounting for 0.0050% of the total market share.
The token's market cap to fully diluted valuation ratio is at 100%, indicating that all tokens are currently in circulation. FTT is listed on 23 exchanges and has approximately 30,994 holders. The current price represents a decline of -78.99% over the past year, reflecting the challenging market conditions the token has faced.
The market sentiment indicator shows a neutral reading of 49 on the volatility index, suggesting balanced trading conditions without extreme fear or greed in the market.
Click to view current FTT market price
FTT Market Sentiment Indicator
2026-01-16 Fear and Greed Index: 49 (Neutral)
Click to view the current Fear & Greed Index
Today's cryptocurrency market is showing a neutral sentiment with a Fear and Greed Index reading of 49. This balanced state suggests that market participants are neither excessively fearful nor overly greedy, indicating a relatively stable market environment. Investors should maintain a measured approach, carefully evaluating opportunities without rushing into positions driven by emotions. This neutral zone often presents strategic opportunities for thoughtful portfolio management and risk assessment on Gate.com.

FTT Holding Distribution
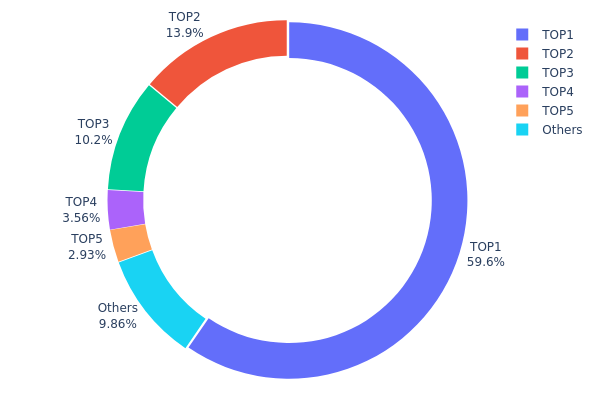
The holding distribution chart reflects the concentration of token holdings across different wallet addresses, serving as a key indicator of market decentralization and potential price manipulation risks. According to the latest on-chain data, FTT demonstrates an extremely high concentration pattern. The top holder controls 195.87 million tokens, accounting for 59.55% of the total supply, while the top five addresses collectively hold 296.48 million tokens, representing 90.13% of total circulation. This leaves only 9.87% of tokens distributed among other addresses, indicating a severely centralized market structure.
Such extreme concentration poses significant concerns for market stability and fairness. When a single entity controls nearly 60% of the circulating supply, it creates substantial asymmetric power in price discovery mechanisms. Large holders can exert disproportionate influence over market movements through coordinated buying or selling activities, potentially triggering sharp price volatility. Additionally, the limited distribution among smaller holders suggests weak retail participation and restricted liquidity depth, which could amplify price swings during periods of market stress. The minimal percentage held by addresses outside the top five (less than 10%) further indicates that the token lacks a robust and diversified holder base typically associated with mature digital assets.
From a risk assessment perspective, FTT's current distribution pattern reflects poor decentralization and heightened vulnerability to single-point control. This structure contradicts the fundamental principles of distributed ledger technology and raises concerns about long-term sustainability. Investors should remain vigilant regarding potential liquidity risks and the possibility of price manipulation by dominant holders. The concentration metrics suggest that FTT's market structure remains fragile, with limited on-chain resilience against coordinated actions by major stakeholders.
Click to view current FTT Holding Distribution
| Top |
Address |
Holding Qty |
Holding (%) |
| 1 |
0x5c9d...0fb36b |
195869.35K |
59.55% |
| 2 |
0x97f9...a71e5c |
45850.88K |
13.94% |
| 3 |
0xf977...41acec |
33422.68K |
10.16% |
| 4 |
0x77f3...8774ff |
11695.85K |
3.55% |
| 5 |
0xf02e...fe0713 |
9640.50K |
2.93% |
| - |
Others |
32415.83K |
9.87% |
II. Core Factors Affecting FTT's Future Price
Supply Mechanism
- Token Concentration Risk: FTT tokens were highly concentrated among key stakeholders, creating significant supply-side vulnerabilities. Historical data shows that when major holders liquidated positions, the token experienced severe price volatility.
- Historical Pattern: During the FTX collapse in November 2022, FTT's price dropped 80% within 24 hours to approximately $4, following announcements of major sell-offs. The token demonstrated extreme sensitivity to supply shocks from large holders.
- Current Impact: The supply mechanism remains influenced by ongoing bankruptcy proceedings and asset redistributions, creating uncertainty around future token circulation patterns.
Institutional and Major Holder Dynamics
- Institutional Holdings: Major institutional investors suffered significant losses during the FTX collapse, including Sequoia Capital ($210 million), SoftBank ($100 million), Temasek ($275 million), and Ontario Teachers' Pension Plan ($95 million). These losses have fundamentally altered institutional sentiment toward FTT.
- Regulatory Consequences: The CFTC imposed a $12.7 billion penalty, and SBF received a 25-year prison sentence, significantly impacting market perception and institutional willingness to engage with FTT-related assets.
- Market Confidence Impact: The collapse led to broader cryptocurrency market capitalization declines and created lasting concerns about centralized exchange governance, affecting institutional adoption patterns.
Macroeconomic Environment
- Monetary Policy Impact: Global economic conditions, inflation rates, and monetary policy shifts continue to influence investor behavior in cryptocurrency markets. The Federal Reserve's interest rate policies and inflation data releases serve as key market drivers.
- Inflation Hedge Characteristics: Cryptocurrency market movements, including FTT, correlate with broader digital asset trends influenced by macroeconomic factors such as inflation expectations and global monetary policy shifts.
- Geopolitical Factors: International regulatory developments and compliance challenges increasingly shape the cryptocurrency landscape, with enhanced scrutiny following major industry events affecting market sentiment and price dynamics.
Technical Development and Ecosystem Building
- Regulatory Environment Evolution: The blockchain industry faces increasing compliance challenges. Enhanced regulatory frameworks may improve mainstream market acceptance of crypto assets and attract traditional investors, though this remains uncertain for FTT given its historical context.
- Market Sentiment Dynamics: FTT's price movements remain closely tied to narrative changes rather than fundamental developments. The token's trajectory depends heavily on bankruptcy proceedings outcomes and potential restructuring scenarios.
- Industry-Wide Impact: The FTX collapse triggered approximately 50% funding difficulties for blockchain projects and fundamentally reshaped investor confidence in centralized exchange tokens, creating lasting ecosystem challenges.
III. 2026-2031 FTT Price Forecast
2026 Outlook
- Conservative Prediction: $0.29-$0.52
- Neutral Prediction: $0.52 (average market scenario)
- Optimistic Prediction: $0.78 (requires favorable market conditions and sustained trading volume)
2027-2029 Mid-term Outlook
- Market Stage Expectation: Potential gradual recovery phase with moderate volatility
- Price Range Predictions:
- 2027: $0.55-$0.68 (24% increase from 2026 baseline)
- 2028: $0.59-$0.75 (27% increase from 2026 baseline)
- 2029: $0.44-$0.79 (35% increase from 2026 baseline)
- Key Catalysts: Market sentiment shifts, regulatory developments, and broader crypto market trends
2030-2031 Long-term Outlook
- Baseline Scenario: $0.70-$0.80 (assuming stable market conditions and sustained interest)
- Optimistic Scenario: $0.75-$1.15 (contingent on positive ecosystem developments and increased adoption)
- Transformative Scenario: Up to $1.15 (requires exceptional market conditions and significant platform developments)
- 2026-01-16: FTT trading within predicted range of $0.29-$0.78 (early-stage market positioning)
| Year |
Predicted High Price |
Predicted Average Price |
Predicted Low Price |
Price Change |
| 2026 |
0.77793 |
0.5221 |
0.29238 |
0 |
| 2027 |
0.68252 |
0.65001 |
0.54601 |
24 |
| 2028 |
0.75288 |
0.66626 |
0.58631 |
27 |
| 2029 |
0.78763 |
0.70957 |
0.43993 |
35 |
| 2030 |
0.801 |
0.7486 |
0.70368 |
43 |
| 2031 |
1.15445 |
0.7748 |
0.48038 |
48 |
IV. FTT Professional Investment Strategies and Risk Management
FTT Investment Methodology
(I) Long-term Holding Strategy
- Target Investors: Investors with medium to long-term horizons seeking exposure to exchange tokens and those who believe in the potential recovery and restructuring of FTX ecosystem
- Operational Recommendations:
- Consider dollar-cost averaging to mitigate entry point risk given the token's significant historical volatility
- Monitor developments related to FTX bankruptcy proceedings and potential ecosystem restructuring announcements
- Utilize Gate Web3 Wallet for secure storage with multi-signature protection enabled
(II) Active Trading Strategy
- Technical Analysis Tools:
- Volume Analysis: Monitor the 24-hour trading volume of approximately $109,144 to identify liquidity patterns and potential breakout opportunities
- Support and Resistance Levels: Track key price levels between the current price of $0.5234 and recent 24-hour range ($0.5135-$0.53)
- Swing Trading Key Points:
- Capitalize on short-term price movements within the 7-day positive trend (+3.57%)
- Set stop-loss orders below key support levels to manage downside risk
FTT Risk Management Framework
(I) Asset Allocation Principles
- Conservative Investors: 0-2% of total crypto portfolio
- Aggressive Investors: 2-5% of total crypto portfolio
- Professional Investors: Up to 10% with active hedging strategies
(II) Risk Hedging Solutions
- Diversification Strategy: Balance FTT holdings with stablecoins and major cryptocurrencies to reduce concentration risk
- Position Sizing: Limit individual position size based on the token's high volatility profile and historical drawdown
(III) Secure Storage Solutions
- Hot Wallet Solution: Gate Web3 Wallet for active trading positions with two-factor authentication enabled
- Cold Storage Approach: Transfer long-term holdings to hardware wallets disconnected from the internet
- Security Considerations: Never share private keys, enable all available security features, and regularly update wallet software
V. FTT Potential Risks and Challenges
FTT Market Risks
- Extreme Volatility: The token has experienced a -78.99% decline over the past year, indicating substantial price instability
- Liquidity Concerns: While currently trading on 23 exchanges, market depth may be limited during periods of high volatility
- Market Sentiment: Negative sentiment surrounding the FTX collapse continues to impact trading dynamics
FTT Regulatory Risks
- Legal Proceedings: Ongoing bankruptcy proceedings and regulatory investigations related to FTX may impact token value
- Jurisdictional Uncertainty: Evolving regulatory frameworks for exchange tokens across different jurisdictions
- Compliance Requirements: Potential changes in token classification or trading restrictions
FTT Technical Risks
- Smart Contract Risks: Potential vulnerabilities in the token's ERC-20 implementation on Ethereum (contract address: 0x50d1c9771902476076ecfc8b2a83ad6b9355a4c9)
- Network Dependency: Reliance on Ethereum network security and performance
- Token Utility Concerns: Limited current utility following FTX platform operational changes
VI. Conclusion and Action Recommendations
FTT Investment Value Assessment
FTT presents a high-risk, speculative investment opportunity with significant uncertainty. While the token maintains a circulating supply of 328,895,103 tokens and trades at $0.5234 (representing a substantial decline from its all-time high of $84.18 in September 2021), investors should carefully consider the token's association with FTX's bankruptcy proceedings and limited current utility. The recent 7-day positive momentum (+3.57%) should be weighed against the 30-day (-3.81%) and 1-year (-78.99%) negative trends. Any investment should be approached with extreme caution and only with capital one can afford to lose entirely.
FTT Investment Recommendations
✅ Beginners: Avoid FTT investment until gaining substantial experience with less volatile assets and thoroughly understanding the risks associated with exchange tokens
✅ Experienced Investors: Consider only minimal allocation (under 2% of portfolio) with clear exit strategies and strict stop-loss parameters
✅ Institutional Investors: Conduct comprehensive due diligence on FTX restructuring proceedings before considering any position, implement robust risk management protocols
FTT Trading Participation Methods
- Spot Trading: Direct purchase and sale of FTT tokens on Gate.com and other supporting exchanges with appropriate order types
- Portfolio Allocation: Include FTT as a small speculative component within a diversified cryptocurrency portfolio
- Active Monitoring: Continuously track developments related to FTX proceedings and ecosystem announcements that may impact token value
Cryptocurrency investments carry extremely high risks. This article does not constitute investment advice. Investors should make prudent decisions based on their own risk tolerance and are advised to consult professional financial advisors. Never invest more than you can afford to lose.
FAQ
What is FTT token? What are its main uses?
FTT is the platform token of FTX, primarily used to reduce trading fees on the FTX platform. With a total supply of 350 million tokens, FTT holders enjoy fee discounts and various platform benefits.
What are the main factors affecting FTT price?
FTT price is primarily influenced by FTX 2.0 resurrection rumors and official statements from FTX. Market sentiment, trading volume, and community confidence also significantly impact FTT valuation and price movements.
How to analyze and predict FTT's future price trends?
Analyze FTT price trends using technical indicators, chart patterns, and key support/resistance levels. Monitor trading volume, market sentiment, and FTX ecosystem developments. Current predictions suggest FTT could reach $24.50 by 2030, though market conditions vary.
What are the advantages and disadvantages of FTT compared to other exchange tokens?
FTT offers trading fee discounts, staking rewards, and a deflationary mechanism that attracts investors. Compared to other exchange tokens, FTT provides more incentive measures. However, its value depends on platform development and market conditions, with potential volatility risks.
What risks should I be aware of when investing in FTT for price prediction?
FTT price prediction involves high volatility and market risk. Conduct thorough research, understand market conditions, and consider consulting financial advisors before investing. Price fluctuations can be significant.
* The information is not intended to be and does not constitute financial advice or any other recommendation of any sort offered or endorsed by Gate.