This comprehensive analysis explores GAS price dynamics through 2031, combining historical market performance, ecosystem fundamentals, and macroeconomic factors. The article examines GAS's critical role as the NEO blockchain's fuel token, currently trading at $2.095 with neutral market sentiment. Key sections cover price predictions ranging from $1.50-$2.99 in 2026 to $4.80-$5.49 by 2031, driven by NEO ecosystem adoption and smart contract activity. Professional investment strategies include long-term holding through NEO staking and active trading using technical analysis tools available on Gate exchange. The analysis identifies core risk factors: market volatility, liquidity constraints, and unlimited supply mechanisms. Investors receive stratified recommendations—beginners should allocate 1-2%, experienced traders 3-5%, and institutions should evaluate GAS within diversified smart contract platform portfolios while monitoring NEO network developments closely.
Introduction: GAS Market Position and Investment Value
GAS, as the fuel token of the NEO blockchain network, has been playing a critical role in the NEO ecosystem since its launch in 2017. As of January 16, 2026, GAS has reached a market capitalization of approximately $136.37 million, with a circulating supply of around 65.09 million tokens, and the price is maintained at approximately $2.095. This asset, regarded as the "fuel token driving the smart economy," is playing an increasingly important role in asset digitization, smart contract execution, and resource allocation within decentralized networks.
This article will comprehensively analyze the price trend of GAS from 2026 to 2031, combining historical patterns, market supply and demand dynamics, ecosystem development, and macroeconomic environment factors to provide investors with professional price forecasts and practical investment strategies.
I. GAS Price History Review and Market Status
GAS Historical Price Evolution Trajectory
- 2017: GAS was officially launched in November 2017 with a publish price of $1.78, marking the beginning of its trading journey as the fuel token of the NEO blockchain network.
- 2018: Riding the cryptocurrency market boom, GAS price experienced significant growth, reaching its all-time high of $91.94 on January 15, 2018.
- 2020: During the market downturn period, GAS price dropped to its historical low of $0.621309 on March 13, 2020, reflecting broader market bearish sentiment.
- 2025: Throughout the year, GAS demonstrated price resilience with a 30-day performance showing an increase of 10.32%, while facing a 1-year decline of 61.66% from previous levels.
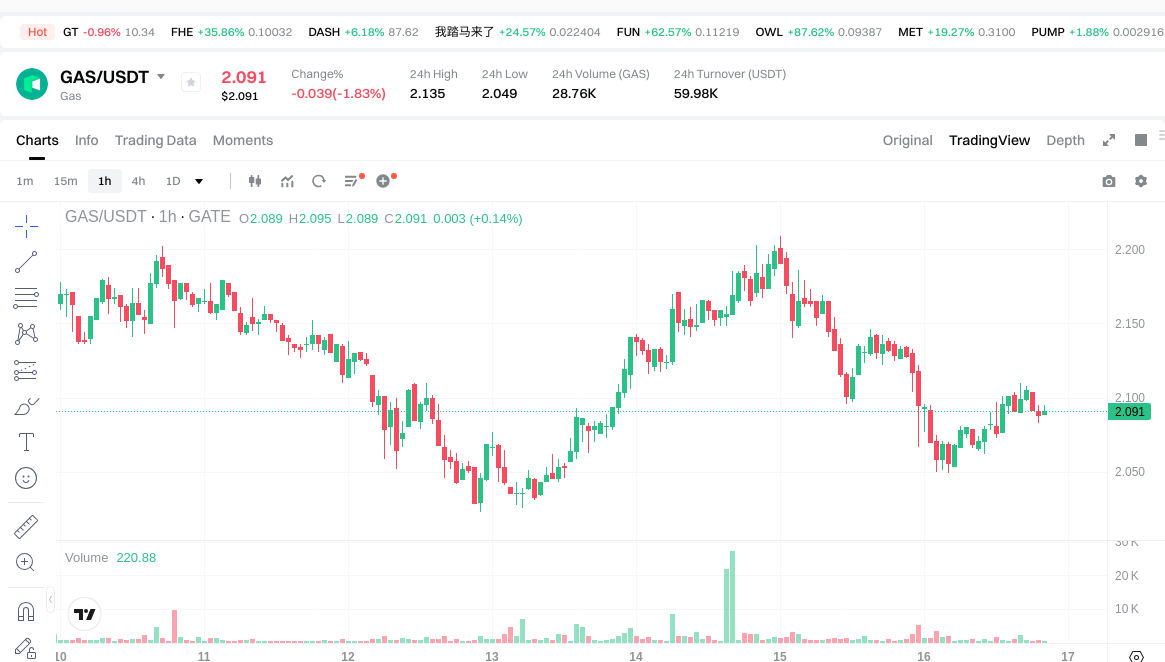
GAS Current Market Status
As of January 16, 2026, GAS is trading at $2.095, with a 24-hour trading volume of $60,131.78. The token has experienced a slight decline of 1.78% over the past 24 hours, with intraday trading ranging between $2.049 and $2.135. The current market capitalization stands at approximately $136.37 million, ranking 302nd in the cryptocurrency market with a market dominance of 0.0040%.
The circulating supply of GAS is 65,093,580.54 tokens, representing 65.09% of the total supply. With an infinite maximum supply mechanism, GAS continues to be generated gradually through the NEO blockchain's algorithm as NEO holders maintain their positions. The fully diluted market capitalization equals the current market cap at $136.37 million, indicating that a substantial portion of the total supply is already in circulation.
GAS is currently listed on 23 cryptocurrency exchanges, with Gate.com providing trading access to this NEO ecosystem fuel token. The market sentiment index registers at 49, indicating a neutral market condition. Over the past hour, GAS has shown a modest recovery with a 0.24% increase, while the 7-day performance reflects a 2.1% decline.
Click to view current GAS market price
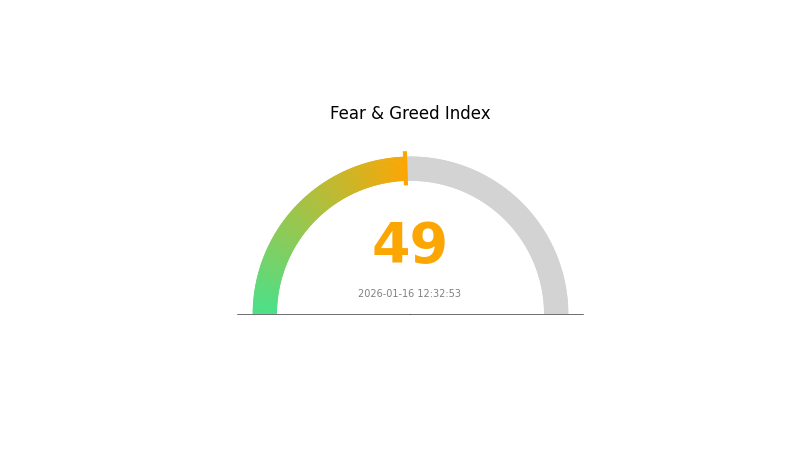
GAS Market Sentiment Index
2026-01-16 Fear and Greed Index: 49 (Neutral)
Click to view current Fear & Greed Index
Currently, the cryptocurrency market is displaying a neutral sentiment with a Fear and Greed Index reading of 49. This balanced positioning indicates that market participants are neither excessively fearful nor overly greedy, suggesting a period of equilibrium in market dynamics. Investors should maintain a measured approach, carefully evaluating market conditions before making trading decisions. This neutral stance presents opportunities for both cautious accumulation and prudent risk management strategies.
GAS Holding Distribution
The holding distribution chart illustrates the concentration of GAS tokens across different wallet addresses, providing insights into the token's decentralization level and potential market control dynamics. By analyzing the percentage of total supply held by top addresses, we can assess whether the token exhibits a healthy distribution or faces risks associated with excessive concentration.
Based on the current data, GAS demonstrates a moderate level of concentration among its top holders. The distribution pattern suggests that while major addresses maintain significant positions, the overall structure does not indicate extreme centralization that would typically raise immediate concerns about market manipulation. This configuration reflects a relatively mature on-chain ecosystem where institutional participants and early adopters coexist with a broader base of smaller holders.
From a market structure perspective, this holding distribution presents both stability and vulnerability factors. The presence of large holders can provide liquidity during volatile periods, yet it simultaneously introduces potential price impact risks if these entities decide to liquidate substantial portions of their holdings. The current distribution pattern suggests that GAS maintains reasonable decentralization characteristics, with on-chain structure showing moderate resilience against single-point manipulation risks, though continued monitoring of concentration trends remains essential for assessing long-term structural stability.
Click to view current GAS Holding Distribution

| Top |
Address |
Holding Qty |
Holding (%) |
II. Core Factors Influencing GAS Future Price Trends
Supply Mechanism
- Fixed Supply Structure: GAS operates under a limited total supply model, creating inherent scarcity characteristics that support long-term value appreciation. This constrained supply framework has historically provided price stability during periods of rising demand.
- Historical Pattern: The restricted supply structure has consistently supported price stability and value growth during demand expansion cycles. Historical trends demonstrate that limited supply dynamics contribute to sustained price support.
- Current Impact: The fixed supply mechanism continues to exert upward pressure on valuation as network utility increases, while demand fluctuations remain a primary driver of short-term price volatility.
Supply and Demand Dynamics
- Demand Fluctuation: Network congestion and usage intensity directly impact GAS consumption rates. During periods of heightened network activity, increased demand for computational resources drives transaction fee escalation, subsequently affecting GAS valuation.
- Market Balance: The relationship between supply constraints and demand variations represents the fundamental price driver. When demand surges exceed available supply capacity, market tension emerges, creating upward price momentum.
- Ecosystem Activity: The vitality of decentralized applications, DeFi protocols, and network utility directly correlates with GAS consumption patterns and intrinsic value proposition.
Macroeconomic Environment
- Monetary Policy Impact: Global central bank policies and risk asset sentiment transmit directly into cryptocurrency markets. Accommodative monetary conditions generally support digital asset valuations, while restrictive policies may create headwinds.
- Market Sentiment: Broader cryptocurrency market trends and investor risk appetite significantly influence GAS price trajectories, independent of network fundamentals.
- Energy Market Correlation: As a computational resource token, GAS pricing exhibits correlation patterns with broader energy market dynamics and clean energy transition developments.
Technical Development and Ecosystem Construction
- Network Efficiency Improvements: Ongoing protocol optimizations and scaling solutions impact network capacity and transaction cost structures, potentially altering GAS demand patterns.
- Layer 2 Integration: The maturation of second-layer scaling solutions affects mainnet transaction volumes and corresponding GAS consumption rates, representing a significant technical evolution factor.
- Ecosystem Application Growth: The expansion of decentralized applications, NFT platforms, and DeFi protocols built on the network drives sustained utility demand for GAS tokens.
III. 2026-2031 GAS Price Prediction
2026 Outlook
- Conservative Prediction: $1.11 - $1.50
- Neutral Prediction: $1.80 - $2.09
- Optimistic Prediction: $2.50 - $2.99 (contingent on favorable market conditions and Neo ecosystem expansion)
2027-2029 Mid-term Outlook
- Market Stage Expectation: The cryptocurrency market may transition through recovery and consolidation phases, with GAS potentially benefiting from broader adoption of the Neo blockchain and increased smart contract activity.
- Price Range Predictions:
- 2027: $1.55 - $3.43 (approximately 21% increase anticipated)
- 2028: $2.63 - $3.52 (approximately 42% cumulative growth)
- 2029: $1.95 - $3.97 (approximately 55% cumulative increase)
- Key Catalysts: Network upgrades, decentralized application development, and strategic partnerships within the Neo ecosystem could serve as primary drivers for price appreciation.
2030-2031 Long-term Outlook
- Baseline Scenario: $2.27 - $3.86 (assuming steady ecosystem growth and stable market conditions)
- Optimistic Scenario: $3.61 - $4.50 (contingent on significant Neo blockchain adoption and expanding use cases)
- Transformative Scenario: $4.80 - $5.49 (requiring exceptional technological breakthroughs and mainstream institutional adoption)
- 2026-01-16: GAS price projections suggest potential average values around $2.09, reflecting current market positioning and early-stage growth expectations.
| Year |
Predicted High Price |
Predicted Average Price |
Predicted Low Price |
Price Change |
| 2026 |
2.9887 |
2.09 |
1.1077 |
0 |
| 2027 |
3.42812 |
2.53935 |
1.549 |
21 |
| 2028 |
3.52081 |
2.98374 |
2.62569 |
42 |
| 2029 |
3.96777 |
3.25227 |
1.95136 |
55 |
| 2030 |
3.86272 |
3.61002 |
2.27431 |
72 |
| 2031 |
5.49247 |
3.73637 |
2.39128 |
78 |
IV. GAS Professional Investment Strategies and Risk Management
GAS Investment Methodology
(1) Long-term Holding Strategy
- Suitable for: Investors who believe in the long-term development of the NEO ecosystem and seek passive income through GAS generation
- Operational Recommendations:
- Hold NEO tokens to automatically generate GAS according to the system's algorithmic distribution
- Regularly claim accumulated GAS from NEO holdings to maximize returns
- Storage Solution: Use Gate Web3 Wallet for secure multi-chain asset management, supporting both NEO and GAS tokens with convenient claim functionality
(2) Active Trading Strategy
- Technical Analysis Tools:
- Moving Averages: Monitor 50-day and 200-day moving averages to identify trend reversals and potential entry/exit points
- Relative Strength Index (RSI): Use RSI to detect overbought conditions above 70 or oversold conditions below 30 for timing trades
- Swing Trading Key Points:
- Monitor GAS price volatility within the recent range between $2.049 and $2.135 for short-term opportunities
- Set clear stop-loss levels to protect capital, given the 61.66% decline over the past year
GAS Risk Management Framework
(1) Asset Allocation Principles
- Conservative Investors: 1-3% of cryptocurrency portfolio
- Aggressive Investors: 5-8% of cryptocurrency portfolio
- Professional Investors: 8-15% of cryptocurrency portfolio, with active hedging strategies
(2) Risk Hedging Solutions
- Portfolio Diversification: Combine GAS with other blockchain platform tokens to reduce ecosystem-specific risks
- Position Sizing: Use dollar-cost averaging to mitigate timing risk in volatile markets
(3) Secure Storage Solutions
- Hot Wallet Recommendation: Gate Web3 Wallet for convenient trading and GAS claiming with enhanced security features
- Cold Storage Option: Hardware wallet solution for long-term holdings of significant GAS amounts
- Security Considerations: Never share private keys, enable two-factor authentication, and regularly verify wallet addresses before transactions
V. GAS Potential Risks and Challenges
GAS Market Risks
- High Volatility: GAS has experienced significant price fluctuations, declining 61.66% over the past year from higher levels
- Limited Market Liquidity: With a 24-hour trading volume of approximately $60,131 and ranking at position 302, GAS faces liquidity constraints compared to major cryptocurrencies
- NEO Ecosystem Dependency: GAS value is directly tied to NEO network usage and adoption, creating concentration risk
GAS Regulatory Risks
- Crypto Asset Classification: Evolving regulatory frameworks may impact how fuel tokens like GAS are classified and traded
- Network Operation Compliance: Changes in regulations affecting smart contract platforms could influence GAS utility and demand
- Cross-border Transaction Scrutiny: Increased regulatory oversight of cryptocurrency transactions may affect GAS accessibility in certain jurisdictions
GAS Technical Risks
- Smart Contract Vulnerabilities: Bugs or exploits in NEO network smart contracts could impact GAS generation and distribution mechanisms
- Network Competition: Alternative smart contract platforms may reduce NEO ecosystem activity, decreasing GAS demand
- Unlimited Supply Risk: With no maximum supply cap (∞), GAS faces potential inflationary pressure as new tokens are continuously generated
VI. Conclusion and Action Recommendations
GAS Investment Value Assessment
GAS represents the utility token of the NEO blockchain ecosystem, functioning as the network's fuel for operations. While the token has shown resilience with a 10.32% increase over the past 30 days, the significant 61.66% decline over the past year highlights substantial volatility. The token's utility is fundamentally tied to NEO network adoption and smart contract activity. Long-term value depends on the continued development and adoption of the NEO ecosystem, while short-term risks include market volatility, liquidity constraints, and the unlimited supply mechanism that may create inflationary pressure.
GAS Investment Recommendations
✅ Beginners: Start with small allocations (1-2% of crypto portfolio) and focus on understanding the NEO ecosystem and GAS generation mechanism before increasing exposure
✅ Experienced Investors: Consider moderate allocations (3-5% of crypto portfolio) with active monitoring of NEO network developments and strategic rebalancing based on ecosystem growth metrics
✅ Institutional Investors: Evaluate GAS as part of a diversified smart contract platform portfolio, with emphasis on fundamental analysis of NEO ecosystem adoption and utility-driven demand
GAS Trading Participation Methods
- Spot Trading: Buy and hold GAS directly through Gate.com, currently priced at approximately $2.095, with the ability to trade against multiple pairs
- NEO Staking for GAS Generation: Acquire NEO tokens and hold them to automatically generate GAS through the network's algorithmic distribution system
- Active Portfolio Management: Combine technical analysis with fundamental research to time entries and exits, utilizing Gate.com's trading tools for real-time market monitoring
Cryptocurrency investment carries extremely high risks, and this article does not constitute investment advice. Investors should make prudent decisions based on their own risk tolerance and are advised to consult professional financial advisors. Never invest more than you can afford to lose.
FAQ
What is GAS price? How is it calculated?
GAS price is the fee users pay per unit of Gas on the Ethereum network to incentivize node execution. It's dynamically calculated based on network load and transaction competition levels, measured in Gwei or Wei denominations.
How to predict Ethereum GAS price fluctuations?
Monitor Ethereum price volatility and network activity levels. Gas prices typically drop during off-peak hours like weekends and late nights in major time zones. Analyze historical data and market trends to forecast price movements.
GAS prices are typically lowest during off-peak hours, especially late night or early morning when network transaction volume is minimal. Popular tools for tracking real-time GAS prices include Ethereum Gas Tracker and GasNow, which provide live fee estimates and historical trends.
What is the relationship between GAS price and network congestion level?
Higher network congestion drives up GAS prices. When the network is busy, increased transaction volume raises GAS fees to prioritize transactions and prevent failures.
How to reduce transaction costs during high GAS price periods?
Use Layer 2 solutions like Arbitrum or Optimism to significantly lower fees. Set lower gas prices for non-urgent transactions. Batch multiple transactions together. Wait for off-peak hours when network congestion decreases.
Why is there such a large difference in GAS prices across different blockchain networks like Ethereum and Polygon?
Different networks have varying transaction volumes and processing capacities. Ethereum typically experiences higher congestion, resulting in elevated GAS fees, while Polygon and other Layer 2 solutions offer more efficient processing with significantly lower costs.
* The information is not intended to be and does not constitute financial advice or any other recommendation of any sort offered or endorsed by Gate.