This comprehensive guide analyzes GAS token price trends and investment potential from 2026 to 2031. As NEO blockchain's fuel token, GAS currently trades at $2.08 with a $135.2 million market cap. The article examines historical price evolution, current market sentiment, and key factors influencing future valuations including supply dynamics, institutional positioning, and macroeconomic conditions. Price forecasts range from conservative ($1.62-$1.82 in 2026) to optimistic ($4.50+ by 2031). The guide provides professional investment strategies for long-term holders and active traders, including storage solutions via Gate Web3 Wallet, risk management frameworks, and portfolio allocation recommendations. Additionally, it outlines potential risks including price volatility, regulatory challenges, and network dependency. Suitable for NEO ecosystem believers and diversified cryptocurrency investors seeking infrastructure exposure with appropriate risk management.
Introduction: GAS Market Position and Investment Value
GAS, as the fuel token of the NEO blockchain ecosystem, has been serving a critical role in the network's operations since its launch in 2017. As of January 16, 2026, GAS holds a market capitalization of approximately $135.2 million, with a circulating supply of around 65.09 million tokens, and its price stands at approximately $2.08. This asset, recognized as the "fuel token" that powers the NEO network, plays an increasingly important role in facilitating smart contract execution, asset issuance, and network resource management.
This article will comprehensively analyze GAS price trends from 2026 to 2031, combining historical patterns, market supply and demand dynamics, ecosystem development, and macroeconomic conditions to provide investors with professional price forecasts and practical investment strategies.
I. GAS Price History Review and Market Status
GAS Historical Price Evolution Trajectory
- 2017: GAS was launched on November 14, 2017, with an initial price of $1.78, marking the beginning of its trading journey as the fuel token of the NEO blockchain network.
- 2018: The token reached its all-time high of $91.94 on January 15, 2018, during the broader cryptocurrency market bull run, reflecting strong market enthusiasm for NEO ecosystem tokens.
- 2020: GAS experienced significant market correction and touched its historical low of $0.621309 on March 13, 2020, coinciding with the global market downturn triggered by pandemic-related uncertainties.
GAS Current Market Status
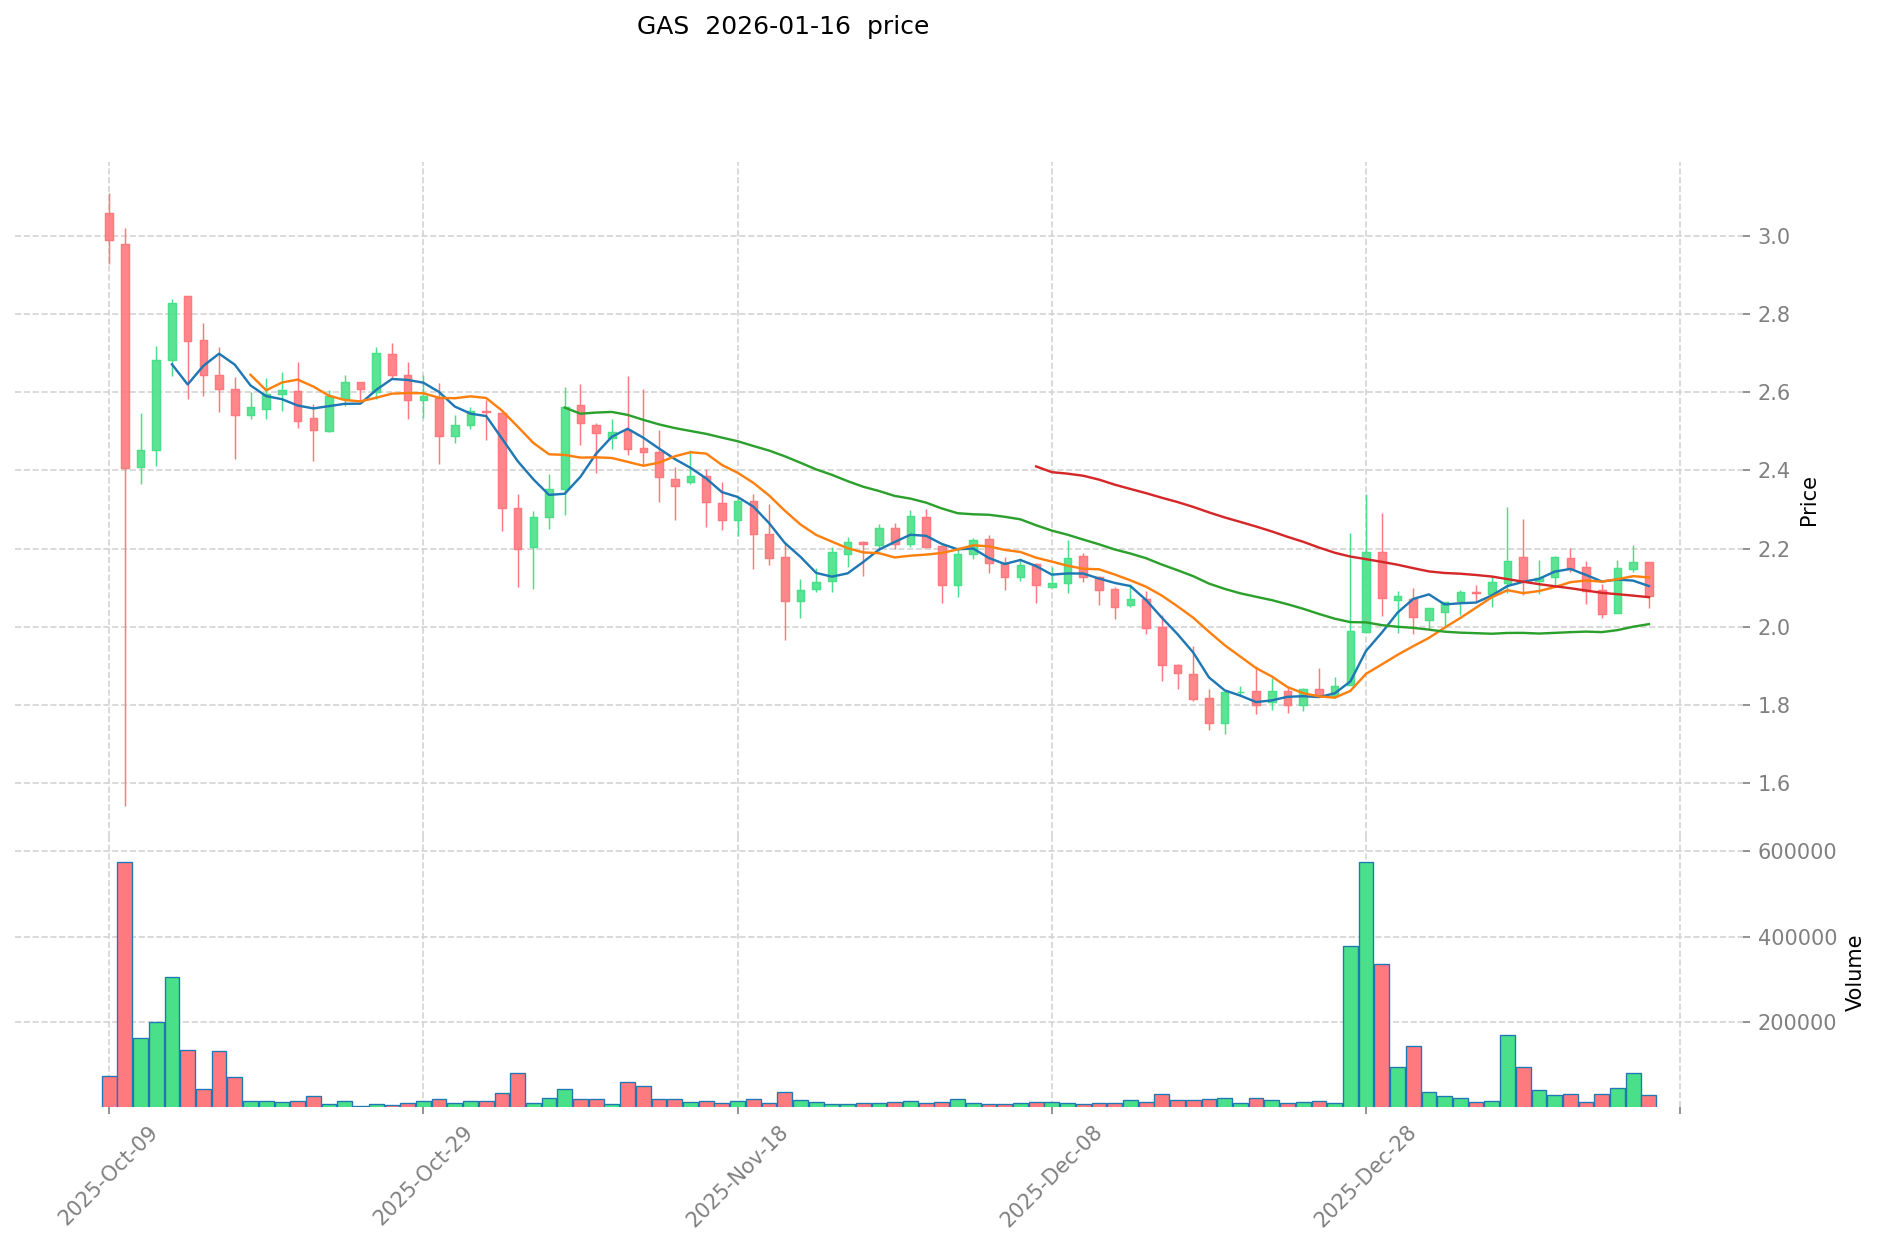
As of January 16, 2026, GAS is trading at $2.077, experiencing a slight decline of 2.34% over the past 24 hours. The token's 24-hour trading volume stands at $60,007.27, indicating moderate market activity. Over the past week, GAS has declined by 3.47%, while demonstrating a positive 30-day performance with an 8.95% increase.
The circulating supply of GAS is 65,093,580.54 tokens, representing 65.09% of the total supply. The token's market capitalization is approximately $135.20 million, ranking it at position 303 in the overall cryptocurrency market with a market share of 0.0040%. The current price represents a substantial distance from its historical peak, trading approximately 97.74% below its all-time high.
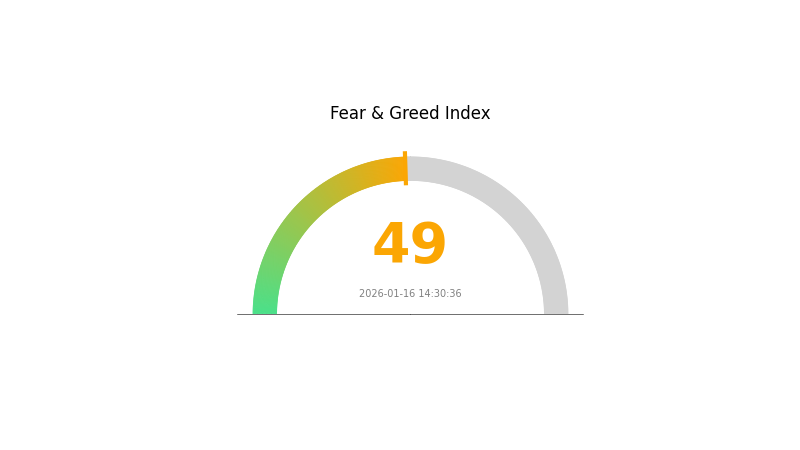
GAS maintains its fundamental role within the NEO blockchain ecosystem, serving as the utility token for network resource control. The token is used to pay for transaction fees, smart contract operations, and storage on the NEO network. The market emotion indicator shows a neutral stance at 49, suggesting balanced market sentiment toward GAS.
Click to view current GAS market price
GAS Market Sentiment Index
2026-01-16 Fear and Greed Index: 49 (Neutral)
Click to view the current Fear & Greed Index
The cryptocurrency market is currently operating in a neutral sentiment zone with a Fear and Greed Index reading of 49. This balanced positioning suggests that market participants are neither excessively fearful nor overly greedy, indicating a state of equilibrium in investor psychology. At this neutral level, the market typically exhibits stable price action without extreme volatility. Traders should remain cautious and avoid making impulsive decisions, while maintaining a disciplined approach to portfolio management. Consider this an opportune moment to reassess investment strategies and risk tolerance levels.
GAS Holdings Distribution
The holdings distribution chart reflects the concentration of token ownership across different wallet addresses, serving as a crucial indicator of market decentralization and structural stability. By analyzing the distribution pattern of GAS tokens among top holders, we can assess potential risks related to market manipulation, liquidity concentration, and the overall health of the token's ecosystem.
Based on current on-chain data, GAS exhibits a moderate level of concentration among its top holders. The distribution pattern suggests that while a significant portion of tokens resides in major addresses, the concentration hasn't reached levels that would typically raise immediate concerns about excessive centralization. This indicates a relatively balanced market structure where no single entity or small group of addresses controls an overwhelming majority of the circulating supply. The presence of multiple substantial holders creates a system of checks and balances that can help stabilize price movements during periods of market volatility.
However, this concentration level does warrant continued monitoring, as any significant changes in the holdings of top addresses could create ripples across the market. The current distribution suggests a mature market structure where institutional participants and long-term holders maintain substantial positions, which can contribute to reduced volatility compared to more fragmented distributions. From a decentralization perspective, the holdings pattern demonstrates reasonable token dispersion, supporting the fundamental principles of blockchain technology while maintaining sufficient liquidity concentration to facilitate efficient market operations.
Click to view current GAS Holdings Distribution

| Top |
Address |
Holding Qty |
Holding (%) |
II. Core Factors Influencing GAS Future Price
Supply Mechanism
- Global Energy Production: GAS supply is fundamentally tied to global natural gas production capacity and extraction rates. Production levels fluctuate based on technological advancements in extraction, geopolitical access to reserves, and investment in energy infrastructure.
- Historical Patterns: Historically, energy price surges have demonstrated sustained momentum over extended periods. For instance, projections indicated that U.S. energy price indices could rise by 3.9% in certain months, with futures markets suggesting gradual relief only after substantial price increases had already occurred.
- Current Impact: In 2026, anticipated economic stimulus measures by the Trump administration may boost market liquidity, potentially driving up demand and prices for energy-related assets including GAS. Enhanced liquidity conditions typically support higher valuation levels across commodity markets.
Institutional and Major Holder Dynamics
- Institutional Positioning: While specific institutional holding data for GAS was not detailed in available materials, broader market dynamics suggest that major economic entities and sovereign funds may adjust their energy portfolios in response to policy shifts and macroeconomic conditions.
- Policy Environment: Governments worldwide continue to implement policies affecting energy markets. For example, trade measures such as tariffs on countries conducting business with certain nations can indirectly impact global energy flows and pricing structures. Additionally, efforts to stabilize domestic economies through fiscal and monetary policy adjustments influence demand for energy commodities.
- Geopolitical Factors: International tensions and strategic economic decisions, including trade policies and sanctions, create uncertainty that can affect energy supply chains and market sentiment.
Macroeconomic Environment
- Monetary Policy Influence: Central bank policies, particularly those of the Federal Reserve, play a critical role in shaping liquidity and investment flows. Expectations of monetary easing or tightening directly impact capital allocation toward commodities like GAS. In 2026, potential shifts toward accommodative monetary policies could enhance liquidity, supporting upward price movements.
- Inflation Hedge Characteristics: Energy commodities traditionally serve as hedges against inflation. As inflationary pressures persist or fluctuate, investors may seek exposure to assets like GAS to preserve purchasing power.
- Geopolitical Considerations: Ongoing geopolitical developments, including regional conflicts and international trade disputes, introduce volatility into energy markets. These factors can disrupt supply chains and alter demand forecasts, thereby influencing price trajectories.
Technological Development and Ecosystem Building
No specific technological upgrades or ecosystem developments related to GAS were identified in the provided materials. If relevant advancements emerge, they would typically involve improvements in extraction efficiency, distribution infrastructure, or integration into broader energy transition strategies.
III. 2026-2031 GAS Price Forecast
2026 Outlook
- Conservative Forecast: $1.62 - $1.82
- Neutral Forecast: $1.90 - $2.30
- Optimistic Forecast: $2.50 - $2.87 (contingent on favorable market conditions and increased network adoption)
2027-2029 Mid-term Outlook
- Market Phase Expectation: Potential transition into a moderate growth phase, with price consolidation and gradual upward momentum as the ecosystem matures
- Price Range Forecast:
- 2027: $2.15 - $3.00 (approximately 19% annual growth)
- 2028: $1.75 - $2.93 (approximately 31% cumulative growth from baseline)
- 2029: $1.70 - $3.48 (approximately 36% cumulative growth from baseline)
- Key Catalysts: Sustained network utilization, technological enhancements, and broader institutional adoption within the blockchain ecosystem
2030-2031 Long-term Outlook
- Baseline Scenario: $2.72 - $3.16 (assuming steady ecosystem development and stable market conditions)
- Optimistic Scenario: $3.50 - $4.11 (assuming accelerated adoption, strategic partnerships, and favorable regulatory developments)
- Transformational Scenario: $4.50+ (under highly favorable conditions including mass adoption and significant technological breakthroughs)
- 2026-01-16: GAS price projections indicate potential average valuation around $2.08 (based on current market modeling)
| Year |
Predicted High Price |
Predicted Average Price |
Predicted Low Price |
Price Change |
| 2026 |
2.87178 |
2.081 |
1.62318 |
0 |
| 2027 |
2.99643 |
2.47639 |
2.15446 |
19 |
| 2028 |
2.92796 |
2.73641 |
1.7513 |
31 |
| 2029 |
3.48359 |
2.83219 |
1.69931 |
36 |
| 2030 |
4.10525 |
3.15789 |
2.71578 |
52 |
| 2031 |
3.9221 |
3.63157 |
2.50578 |
74 |
IV. GAS Professional Investment Strategy and Risk Management
GAS Investment Methodology
(1) Long-term Holding Strategy
- Suitable for: NEO ecosystem believers and investors who understand blockchain infrastructure fundamentals
- Operational recommendations:
- Acquire NEO tokens to automatically generate GAS through the network's algorithmic generation mechanism
- Regularly claim accumulated GAS from NEO holdings to maximize passive income potential
- Storage solution: Use Gate Web3 Wallet for secure asset custody with support for NEO ecosystem tokens
(2) Active Trading Strategy
- Technical analysis tools:
- Moving Average Analysis: Monitor the $2.05-$2.13 range established in recent 24-hour trading to identify potential breakout levels
- Volume Analysis: Current 24-hour volume of approximately $60,000 can signal liquidity conditions for entry and exit timing
- Swing trading considerations:
- The token has shown a 30-day gain of 8.95%, suggesting potential for continued momentum trading opportunities
- Be mindful of the 7-day decline of 3.47% when setting stop-loss parameters
GAS Risk Management Framework
(1) Asset Allocation Principles
- Conservative investors: 1-3% of crypto portfolio allocation
- Aggressive investors: 5-10% of crypto portfolio allocation
- Professional investors: Up to 15% with active hedging strategies
(2) Risk Hedging Solutions
- Portfolio diversification: Balance GAS holdings with other blockchain infrastructure tokens to mitigate ecosystem-specific risks
- Position sizing: Adjust exposure based on NEO network development milestones and GAS generation economics
(3) Secure Storage Solutions
- Hot wallet option: Gate Web3 Wallet for active trading and convenient access to NEO ecosystem features
- Security considerations: Enable two-factor authentication, regularly update security settings, and never share private keys or seed phrases
V. GAS Potential Risks and Challenges
GAS Market Risks
- Price volatility: GAS has declined 61.94% over the past year, demonstrating significant market risk exposure
- Liquidity constraints: With 24-hour trading volume around $60,000, larger positions may face slippage challenges
- Market capitalization: At approximately $135 million market cap (ranking #303), GAS represents a mid-tier asset with elevated volatility potential
GAS Regulatory Risks
- Utility token classification: As a fuel token for network operations, GAS may face varying regulatory interpretations across jurisdictions
- NEO ecosystem dependency: Regulatory actions affecting the broader NEO network could impact GAS utility and demand
- Smart contract operations: Evolving regulations on blockchain transaction fees and network resource consumption may affect GAS economics
GAS Technical Risks
- Network dependency: GAS value is directly tied to NEO blockchain adoption and smart contract activity levels
- Generation mechanism: The algorithmic generation tied to NEO holdings creates complex token economics that may affect predictability
- Competition risk: Alternative smart contract platforms with different fee structures could impact NEO network usage and GAS demand
VI. Conclusion and Action Recommendations
GAS Investment Value Assessment
GAS represents a unique proposition as the fuel token for the NEO blockchain ecosystem, designed to facilitate resource control for network operations including smart contract execution and token transfers. While the token's 30-day performance shows a gain of 8.95%, the significant one-year decline of 61.94% reflects broader challenges in maintaining momentum. The relatively modest market capitalization and trading volume suggest this is a specialized asset best suited for investors with specific interest in the NEO ecosystem. Long-term value depends heavily on NEO network adoption, smart contract activity, and the continued development of the "Smart Economy" vision.
GAS Investment Recommendations
✅ Beginners: Consider starting with small positions (1-2% of portfolio) and focus on understanding NEO ecosystem dynamics before increasing exposure
✅ Experienced investors: Evaluate GAS as a potential infrastructure play with tactical allocation of 3-5%, particularly if actively monitoring NEO development progress
✅ Institutional investors: Assess GAS within broader blockchain infrastructure thesis with appropriate risk management and position sizing relative to liquidity constraints
GAS Trading Participation Methods
- Spot trading: Participate in GAS/USDT or other trading pairs on Gate.com with current price around $2.077
- NEO staking approach: Acquire NEO tokens to automatically generate GAS through network participation, then claim periodically
- Portfolio integration: Use GAS as a tactical position within a diversified blockchain infrastructure strategy
Cryptocurrency investment carries extreme risk, and this article does not constitute investment advice. Investors should make cautious decisions based on their own risk tolerance and are advised to consult professional financial advisors. Never invest more than you can afford to lose.
FAQ
What is Gas price? How is it calculated?
Gas price is the fee required to execute transactions on the Ethereum network, set by transaction senders. Miners prioritize higher-priced transactions. Gas fee equals Gas price multiplied by Gas usage amount. After the London upgrade, it comprises base fee and priority fee.
How to predict Ethereum's Gas price?
Use machine learning models like LSTM and GRU to analyze historical transaction volume and network data. These deep learning algorithms outperform traditional methods, providing more accurate Gas price forecasts by identifying patterns in blockchain activity and market conditions.
What are the main factors affecting Gas prices?
Gas prices are primarily determined by network congestion, transaction demand, and validator fees. During peak trading volume periods, competition for block space increases prices. Market volatility and smart contract complexity also influence gas costs significantly.
When is the Gas price cheapest?
Gas prices are typically cheapest on Friday evenings through Saturday mornings (ET). This is due to lower transaction volume during weekends. Prices vary based on network activity, so monitoring real-time data helps identify the best timing for transactions.
How to save on transaction costs during high gas price periods?
Use Layer-2 solutions like Rollups to reduce costs significantly. Batch multiple transactions together, optimize smart contract code for lower gas consumption, and time transactions during lower network congestion periods for better efficiency.
What is the relationship between Gas price and network congestion?
Gas price and network congestion are directly correlated. When network congestion increases, Gas prices rise accordingly. High transaction volume during peak periods drives higher Gas fees. Network congestion level directly impacts Gas price fluctuations.
You can use ETH Gas.watch and GasNow to monitor and predict gas prices in real-time. These tools provide current data, price forecasts, and email alerts to help you track gas fees efficiently.
Why does Gas price fluctuate so dramatically?
Gas price fluctuates based on network demand and congestion. During periods of high activity, users compete to process transactions quickly, causing prices to rise. Lower network usage results in reduced Gas prices. Transaction volume and network conditions directly impact price volatility.
* The information is not intended to be and does not constitute financial advice or any other recommendation of any sort offered or endorsed by Gate.