This comprehensive guide analyzes The Graph (GRT) token's price trajectory from 2026 to 2031, providing investors with data-driven predictions and actionable strategies. Currently trading at $0.04284 with a market cap of $457.3 million, GRT serves as critical infrastructure for decentralized data indexing. The article examines key price drivers including supply dynamics, institutional holdings, macroeconomic factors, and ecosystem development. Price forecasts range from conservative estimates of $0.04066-$0.0428 in 2026 to optimistic projections approaching $0.10692 by 2031, contingent upon increased Web3 adoption and protocol innovation. Investment methodologies span long-term holding strategies and active trading approaches, complemented by comprehensive risk management frameworks. The guide addresses regulatory uncertainties, technical vulnerabilities, and competitive pressures while recommending appropriate allocation percentages for different investor profiles. Essential security guidance covers using Ga
Introduction: GRT's Market Position and Investment Value
The Graph (GRT), as a decentralized protocol for indexing and querying blockchain data, has been serving the Ethereum ecosystem since its launch in 2020. As of 2026, GRT has achieved a market capitalization of approximately $457.3 million, with a circulating supply of around 10.67 billion tokens, and the price is maintained at approximately $0.04284. This asset, recognized as a foundational infrastructure for Web3 data access, is playing an increasingly critical role in blockchain data querying and decentralized application development.
This article will comprehensively analyze GRT's price trends from 2026 to 2031, combining historical patterns, market supply and demand dynamics, ecosystem development, and macroeconomic environment factors to provide investors with professional price predictions and practical investment strategies.
I. GRT Price History Review and Market Status
GRT Historical Price Evolution Trajectory
- 2021: GRT reached a significant milestone on February 12, 2021, when it achieved a notable price level of $2.84 during the early cryptocurrency market cycle.
- 2026: On January 1, 2026, GRT experienced a price level of $0.03272768, reflecting market volatility and broader industry dynamics.
GRT Current Market Situation
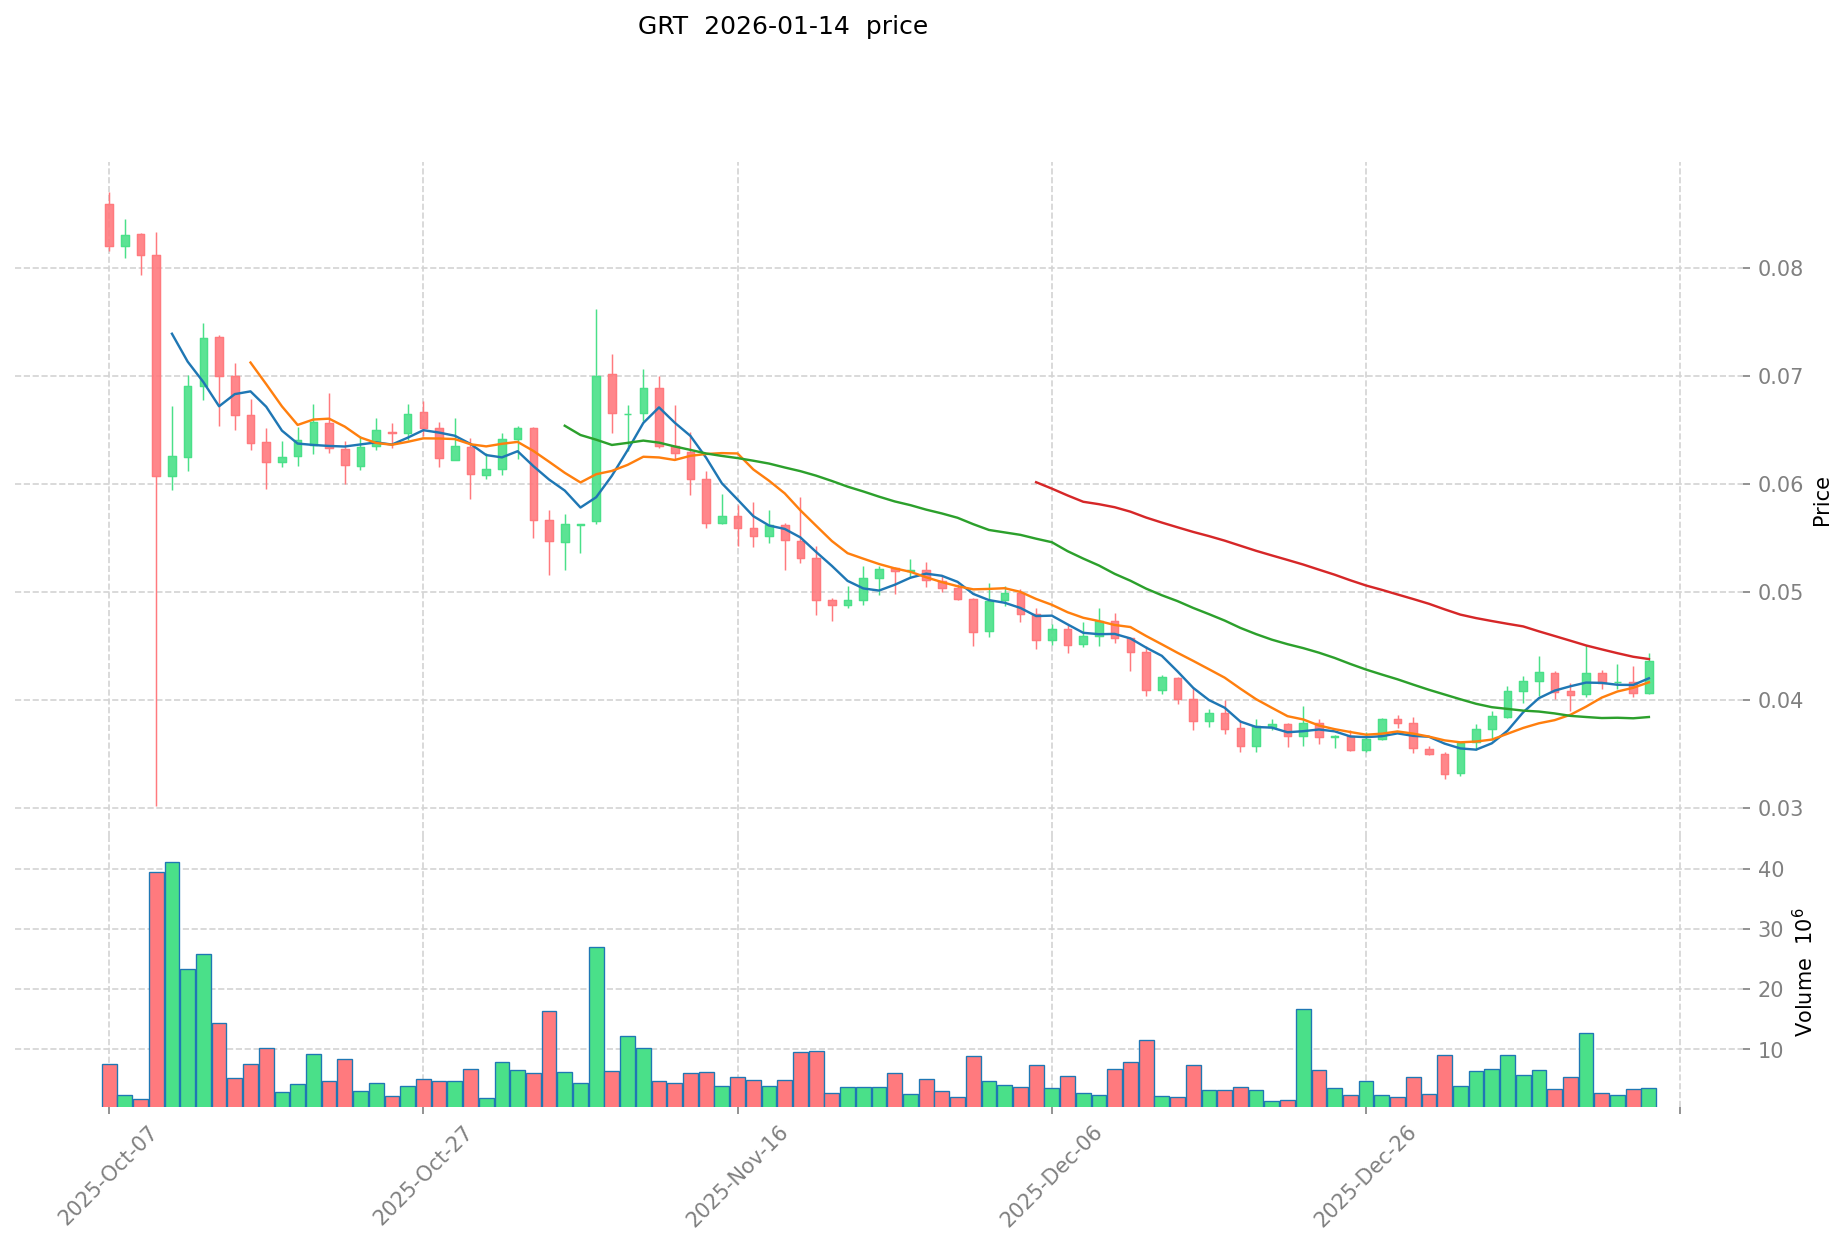
As of January 15, 2026, The Graph (GRT) is trading at $0.04284, showing a slight decrease of 0.09% over the past 24 hours. The token has demonstrated mixed short-term performance, with a 0.88% decline in the past hour, while showing positive momentum over the 7-day period with a gain of 5.62%. The 30-day performance indicates an increase of 13.55%.
The Graph maintains a market capitalization of approximately $457.30 million, with a circulating supply of 10.67 billion GRT tokens. The token's 24-hour trading volume stands at $274,527.38. With a total supply of 10.80 billion tokens, GRT has achieved a circulation ratio of 98.84%, indicating that most of its tokens are already in circulation. The fully diluted market capitalization closely aligns with the current market cap at approximately $462.68 million.
The token's 24-hour price range has fluctuated between $0.04261 and $0.04439. The Graph holds a market dominance of 0.013% in the cryptocurrency ecosystem. The current market sentiment indicator shows a neutral reading of 48 on the volatility index.
The Graph protocol continues to serve its function as a decentralized protocol for indexing and querying blockchain data, primarily applied to Ethereum. The protocol utilizes GRT tokens for two primary purposes: indexers stake GRT tokens to participate in the query market and provide economic security, while curators stake tokens to signal which subgraphs provide value to the network.
Click to view the current GRT market price
GRT Market Sentiment Indicator
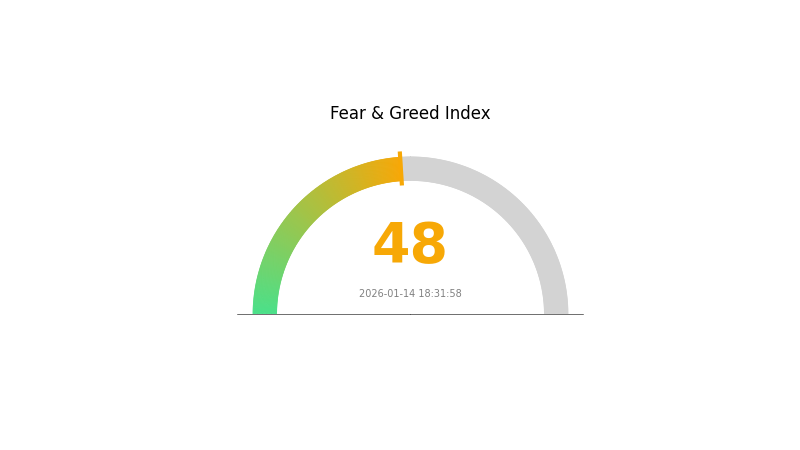
2026-01-14 Fear and Greed Index: 48 (Neutral)
Click to view the current Fear & Greed Index
The cryptocurrency market is currently maintaining a neutral sentiment with a Fear and Greed Index reading of 48. This balanced state suggests that market participants are neither excessively fearful nor overly greedy, indicating a relatively stable market condition. Investors should remain cautious and conduct thorough analysis before making trading decisions, as neutral sentiment often precedes significant market movements in either direction.
GRT Holding Distribution
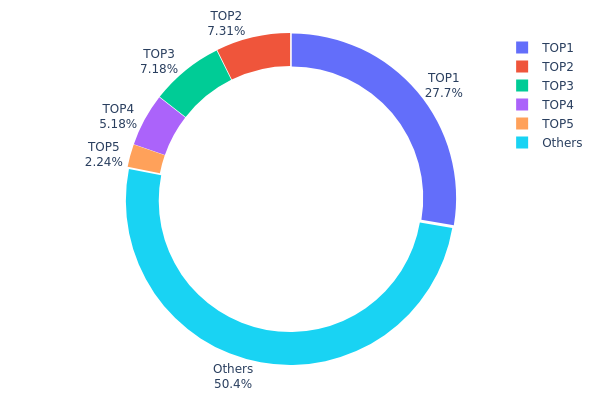
The holding distribution chart reflects the concentration of a token's circulating supply across different wallet addresses, serving as a key indicator to evaluate market structure and decentralization. For GRT, the current on-chain data reveals a moderate to high concentration pattern. The top address holds approximately 2.99 million tokens (27.65% of total supply), while the second and third largest addresses control 7.30% and 7.17% respectively. Combined, the top five addresses account for nearly 49.53% of the total supply, with the remaining 50.47% distributed among other market participants.
This concentration level suggests a relatively centralized holding structure, which may introduce certain structural vulnerabilities to the market. The dominant position of the largest holder could potentially exert significant influence on price movements, particularly during periods of low liquidity. Large-scale transfers or liquidations from these major addresses could trigger substantial price volatility, increasing uncertainty for retail investors. Additionally, such concentration may heighten concerns about potential market manipulation, as coordinated actions by a small number of major holders could disproportionately impact trading dynamics.
From a decentralization perspective, while GRT's holding distribution does not exhibit extreme monopolization, the substantial control by top addresses indicates room for improvement in achieving a more balanced on-chain ecosystem. The current structure reflects a market still in the process of maturation, where institutional investors and early participants maintain significant influence. Monitoring changes in this distribution pattern over time will be crucial for assessing the network's evolution toward broader participation and enhanced stability.
Click to view current GRT Holding Distribution
| Top |
Address |
Holding Qty |
Holding (%) |
| 1 |
0x36af...77f090 |
2987277.42K |
27.65% |
| 2 |
0x823f...27396c |
789408.61K |
7.30% |
| 3 |
0x32ec...7f2ca1 |
775000.00K |
7.17% |
| 4 |
0xfcb4...13d96d |
559234.84K |
5.17% |
| 5 |
0x5b0a...05b4e1 |
242442.35K |
2.24% |
| - |
Others |
5446899.61K |
50.47% |
II. Core Factors Influencing GRT's Future Price
Supply Mechanism
- Token Supply Dynamics: The Graph (GRT) has a circulating supply of approximately 10.67 billion tokens out of a total supply of 11.45 billion tokens as of January 2026. The token serves as an incentive mechanism within The Graph network, rewarding developers and operators who maintain and build APIs (subgraphs).
- Historical Patterns: Supply and demand dynamics have consistently played a significant role in GRT's price movements. As more tokens enter circulation, the relationship between increasing supply and market demand becomes crucial for price stability.
- Current Impact: With over 93% of total supply already in circulation, the remaining token releases may have limited dilution effects. However, the actual price impact depends heavily on the growth rate of network usage and developer adoption.
Institutional and Major Holder Dynamics
- Holder Distribution: Analysis of holder statistics reveals that concentration among major holders and whale activity significantly impacts price volatility. An increase in the number of holders typically signals growing confidence, while large-scale selling by whales can trigger price declines.
- Enterprise Adoption: As a decentralized query protocol for blockchain data, The Graph's value proposition strengthens with the growth of decentralized applications (dApps). Increased adoption by dApp developers for accessing on-chain data could drive demand for GRT tokens.
- Regulatory Environment: The broader cryptocurrency regulatory landscape remains uncertain, with varying policies across jurisdictions potentially affecting market sentiment and institutional participation in GRT trading.
Macroeconomic Environment
- Market Sentiment Impact: General cryptocurrency market conditions and public attitudes toward digital assets significantly influence GRT's price trajectory. During periods of optimistic market sentiment, GRT tends to experience upward price pressure, while pessimistic conditions typically result in downward movements.
- Macroeconomic Trends: Broader economic factors, including inflation trends and monetary policy shifts, indirectly affect cryptocurrency markets and GRT's valuation through their impact on risk appetite and capital flows.
- Competition Dynamics: The competitive landscape within the Web3 data infrastructure space affects GRT's market position and pricing power. The Graph must continuously innovate and optimize its protocol to maintain competitiveness against alternative solutions.
Technical Development and Ecosystem Building
- Protocol Innovation: Technical advancements within The Graph protocol directly impact GRT's value proposition. Successful upgrades and improvements that enhance query efficiency and network performance can drive positive price sentiment.
- DeFi and NFT Integration: The Graph's potential in the Web3 data sector grows alongside the expansion of DeFi and NFT ecosystems. As these sectors develop, demand for The Graph's query services may increase, potentially supporting GRT price appreciation.
- Developer Activity: Community engagement and developer activity serve as key indicators of ecosystem health. Active development of subgraphs and increased API usage demonstrate real-world utility, which can translate into sustained token demand and price support.
III. 2026-2031 GRT Price Forecast
2026 Outlook
- Conservative Prediction: $0.04066 - $0.0428
- Neutral Prediction: Around $0.0428
- Optimistic Prediction: Up to $0.04922 (requires favorable market conditions and increased adoption)
2027-2029 Outlook
- Market Stage Expectation: Gradual growth phase with potential moderate volatility as The Graph ecosystem continues to mature
- Price Range Forecast:
- 2027: $0.02623 - $0.06579
- 2028: $0.04528 - $0.0777
- 2029: $0.06146 - $0.0795
- Key Catalysts: Expansion of decentralized data indexing services, broader Web3 adoption, and enhanced protocol functionalities
2030-2031 Long-term Outlook
- Base Scenario: $0.07022 - $0.09656 (assuming steady ecosystem development and stable market conditions)
- Optimistic Scenario: $0.07213 - $0.10692 (assuming accelerated Web3 infrastructure demand and increased GRT utility)
- Transformative Scenario: Potential to approach $0.10692 by 2031 (requires significant breakthroughs in decentralized indexing technology and widespread enterprise adoption)
- 2026-01-15: GRT trading within the predicted range of $0.04066 - $0.04922 (early-stage growth period)
| Year |
Predicted High Price |
Predicted Average Price |
Predicted Low Price |
Price Change |
| 2026 |
0.04922 |
0.0428 |
0.04066 |
0 |
| 2027 |
0.06579 |
0.04601 |
0.02623 |
7 |
| 2028 |
0.0777 |
0.0559 |
0.04528 |
30 |
| 2029 |
0.0795 |
0.0668 |
0.06146 |
55 |
| 2030 |
0.09656 |
0.07315 |
0.07022 |
70 |
| 2031 |
0.10692 |
0.08485 |
0.07213 |
97 |
IV. GRT Professional Investment Strategy and Risk Management
GRT Investment Methodology
(I) Long-term Holding Strategy
- Suitable for: Investors seeking exposure to decentralized data infrastructure with a multi-year investment horizon
- Operational recommendations:
- Accumulate positions during market corrections when GRT trades below its 30-day moving average
- Consider dollar-cost averaging to mitigate entry timing risk
- Storage solution: Utilize Gate Web3 Wallet for secure self-custody with multi-signature capabilities
(II) Active Trading Strategy
- Technical analysis tools:
- Moving Averages: Monitor 7-day and 30-day MAs to identify trend reversals; current 5.62% weekly gain suggests short-term momentum
- Volume analysis: Track the $274,527 daily trading volume for liquidity assessment and breakout confirmation
- Swing trading considerations:
- Establish position limits based on the 24-hour trading range ($0.04261-$0.04439)
- Set stop-loss orders 3-5% below entry points to manage downside risk
GRT Risk Management Framework
(I) Asset Allocation Principles
- Conservative investors: 1-3% of crypto portfolio allocation
- Aggressive investors: 5-10% of crypto portfolio allocation
- Professional investors: May allocate up to 15% with appropriate hedging strategies
(II) Risk Hedging Solutions
- Portfolio diversification: Combine GRT with stablecoins and established layer-1 assets to reduce concentration risk
- Position sizing: Limit single-trade exposure to 2-5% of total portfolio value
(III) Secure Storage Solutions
- Software wallet recommendation: Gate Web3 Wallet supports both Ethereum and Arbitrum networks for GRT storage
- Hardware wallet option: Consider cold storage solutions for holdings exceeding $10,000 equivalent
- Security precautions: Enable two-factor authentication, verify contract addresses (ETH: 0xc944e90c64b2c07662a292be6244bdf05cda44a7), and avoid sharing private keys
V. GRT Potential Risks and Challenges
GRT Market Risks
- Volatility exposure: GRT has declined 77.81% over the past year, demonstrating significant price instability
- Liquidity concerns: With a market cap of approximately $457.3 million and 0.013% market dominance, GRT may experience wider spreads during market stress
- Competition risk: The decentralized data indexing sector faces growing competition from alternative protocols
GRT Regulatory Risks
- Token classification uncertainty: Evolving regulatory frameworks may impact GRT's operational model and token utility
- Compliance requirements: Potential increased disclosure obligations for indexers and curators within The Graph protocol
- Cross-border restrictions: Geographic limitations may affect protocol participation and token accessibility
GRT Technical Risks
- Smart contract vulnerabilities: Protocol dependencies on multiple contract addresses across Ethereum and Arbitrum networks
- Network congestion: High gas fees on Ethereum mainnet may impact query settlement economics
- Protocol upgrade risks: Technical changes to The Graph network could temporarily disrupt indexing services or token mechanics
VI. Conclusion and Action Recommendations
GRT Investment Value Assessment
The Graph protocol addresses a fundamental infrastructure need in decentralized data access, with GRT serving dual utility functions for indexers and curators. The current circulating supply of 10.67 billion tokens (98.84% of max supply) suggests limited inflation pressure. However, the token's 77.81% annual decline and recent proximity to all-time lows (recorded January 1, 2026 at $0.03272768) indicate substantial downside volatility. Short-term momentum shows modest recovery with a 5.62% weekly and 13.55% monthly gain, though the 24-hour performance remains near-flat at -0.09%.
GRT Investment Recommendations
✅ Beginners: Allocate no more than 1-2% of crypto holdings; prioritize education on The Graph's indexing mechanism before investment
✅ Experienced investors: Consider GRT as a speculative infrastructure play with 3-5% allocation; monitor protocol adoption metrics and subgraph growth
✅ Institutional investors: Conduct thorough due diligence on protocol economics and competitive positioning; potential for strategic positions at 5-8% with active risk management
GRT Trading Participation Methods
- Spot trading: Purchase GRT directly on Gate.com with support for ETH and ARBEVM networks
- Staking participation: Engage with The Graph protocol as an indexer or curator using GRT tokens for yield generation
- Portfolio integration: Include GRT within a diversified Web3 infrastructure basket alongside complementary assets
Cryptocurrency investments carry extreme risk. This content does not constitute investment advice. Investors should make prudent decisions based on their individual risk tolerance and are encouraged to consult professional financial advisors. Never invest more than you can afford to lose.
FAQ
What is GRT (The Graph) token and what is its purpose?
GRT is the native token of The Graph protocol, used for indexer staking to ensure economic security and discoverability, and for curator signaling to identify quality subgraphs and optimize network resource allocation.
What is the price prediction for GRT in 2024?
Based on market analysis, GRT is expected to experience moderate growth in 2024, with price estimates ranging between $0.20 and $1.00. This prediction reflects current market conditions and analyst consensus.
What are the main factors affecting GRT price?
GRT price is influenced by market demand, network adoption, trading volume, investor sentiment, competition from similar projects, and news events. Technical developments and broader crypto market trends also impact its valuation.
How does GRT compare to other Layer 2 or data indexing projects?
GRT excels with superior decentralization and efficient data indexing through its unique query protocol. It offers lower transaction costs, faster query speeds, and a robust validator network compared to competing solutions, making it ideal for Web3 infrastructure.
What is GRT's historical price trend and technical analysis?
GRT exhibits significant price volatility with key technical indicators including moving averages, MACD, and RSI showing cyclical patterns. Historical analysis through candlestick charts reveals multiple bull and bear phases, with support and resistance levels guiding trend identification and potential future price movements.
What are the risks of investing in GRT tokens?
GRT token investment carries high volatility risks with potential for significant price fluctuations. Market uncertainty, regulatory changes, and liquidity variations may impact returns. Investors should conduct thorough due diligence before participating.
What are GRT's future prospects and roadmap?
The Graph will expand cross-chain functionality, integrate AI technology, and develop enterprise-grade data tools. Key milestones include achieving cross-chain staking in 2026 via CCIP, supporting Arbitrum, Base, and Solana networks for enhanced interoperability and scalability.
How to buy and store GRT tokens?
Purchase GRT on a trading platform by selecting the GRT trading pair, entering your desired amount, and confirming the order. Store GRT securely in a personal crypto wallet for enhanced safety, or keep it on the platform for convenience.
* The information is not intended to be and does not constitute financial advice or any other recommendation of any sort offered or endorsed by Gate.