This comprehensive analysis examines GateToken (GT) market dynamics and provides professional price forecasts through 2031. GT, the native token of Gate.com ecosystem with current market capitalization of $1.03 billion, is thoroughly analyzed across historical performance, current market sentiment, and future outlook. The article combines technical analysis, supply mechanism evaluation, and macroeconomic factors to project GT price ranges from conservative estimates of $9.682-$10.3 in 2026 to optimistic scenarios reaching $27.20783 by 2031. Key content includes detailed holding distribution analysis, risk assessment frameworks, and actionable investment strategies for different investor profiles on Gate.com. Readers gain practical guidance on spot trading, dollar-cost averaging, and secure storage solutions using Gate Web3 Wallet, while understanding regulatory risks and market volatility considerations essential for informed cryptocurrency investment decisions.
Introduction: GT's Market Position and Investment Value
GateToken (GT), as the native token of the GateChain ecosystem dedicated to user asset security and decentralized trading, has been evolving since its launch in 2019. As of 2026, GT has achieved a market capitalization of approximately $1.03 billion, with a circulating supply of around 100.36 million tokens, maintaining a price level near $10.31. This asset, recognized for its innovative on-chain hot insurance account mechanism, plays an increasingly significant role in blockchain security and decentralized exchange solutions.
This article provides a comprehensive analysis of GT's price trends from 2026 to 2031, combining historical patterns, market supply and demand dynamics, ecosystem development progress, and macroeconomic conditions to offer professional price forecasts and practical investment strategies for investors.
I. GT Price History Review and Current Market Status
GT Historical Price Evolution Trajectory
- 2018: GT was launched with an initial offering price of $0.43, establishing its presence in the cryptocurrency market
- 2020: The token reached its historical low point at $0.25754 on March 13, 2020, during a period of market-wide downturn
- 2025: GT achieved a significant milestone by reaching $25.94 on January 25, 2025, marking a notable price appreciation from its historical baseline
GT Current Market Situation
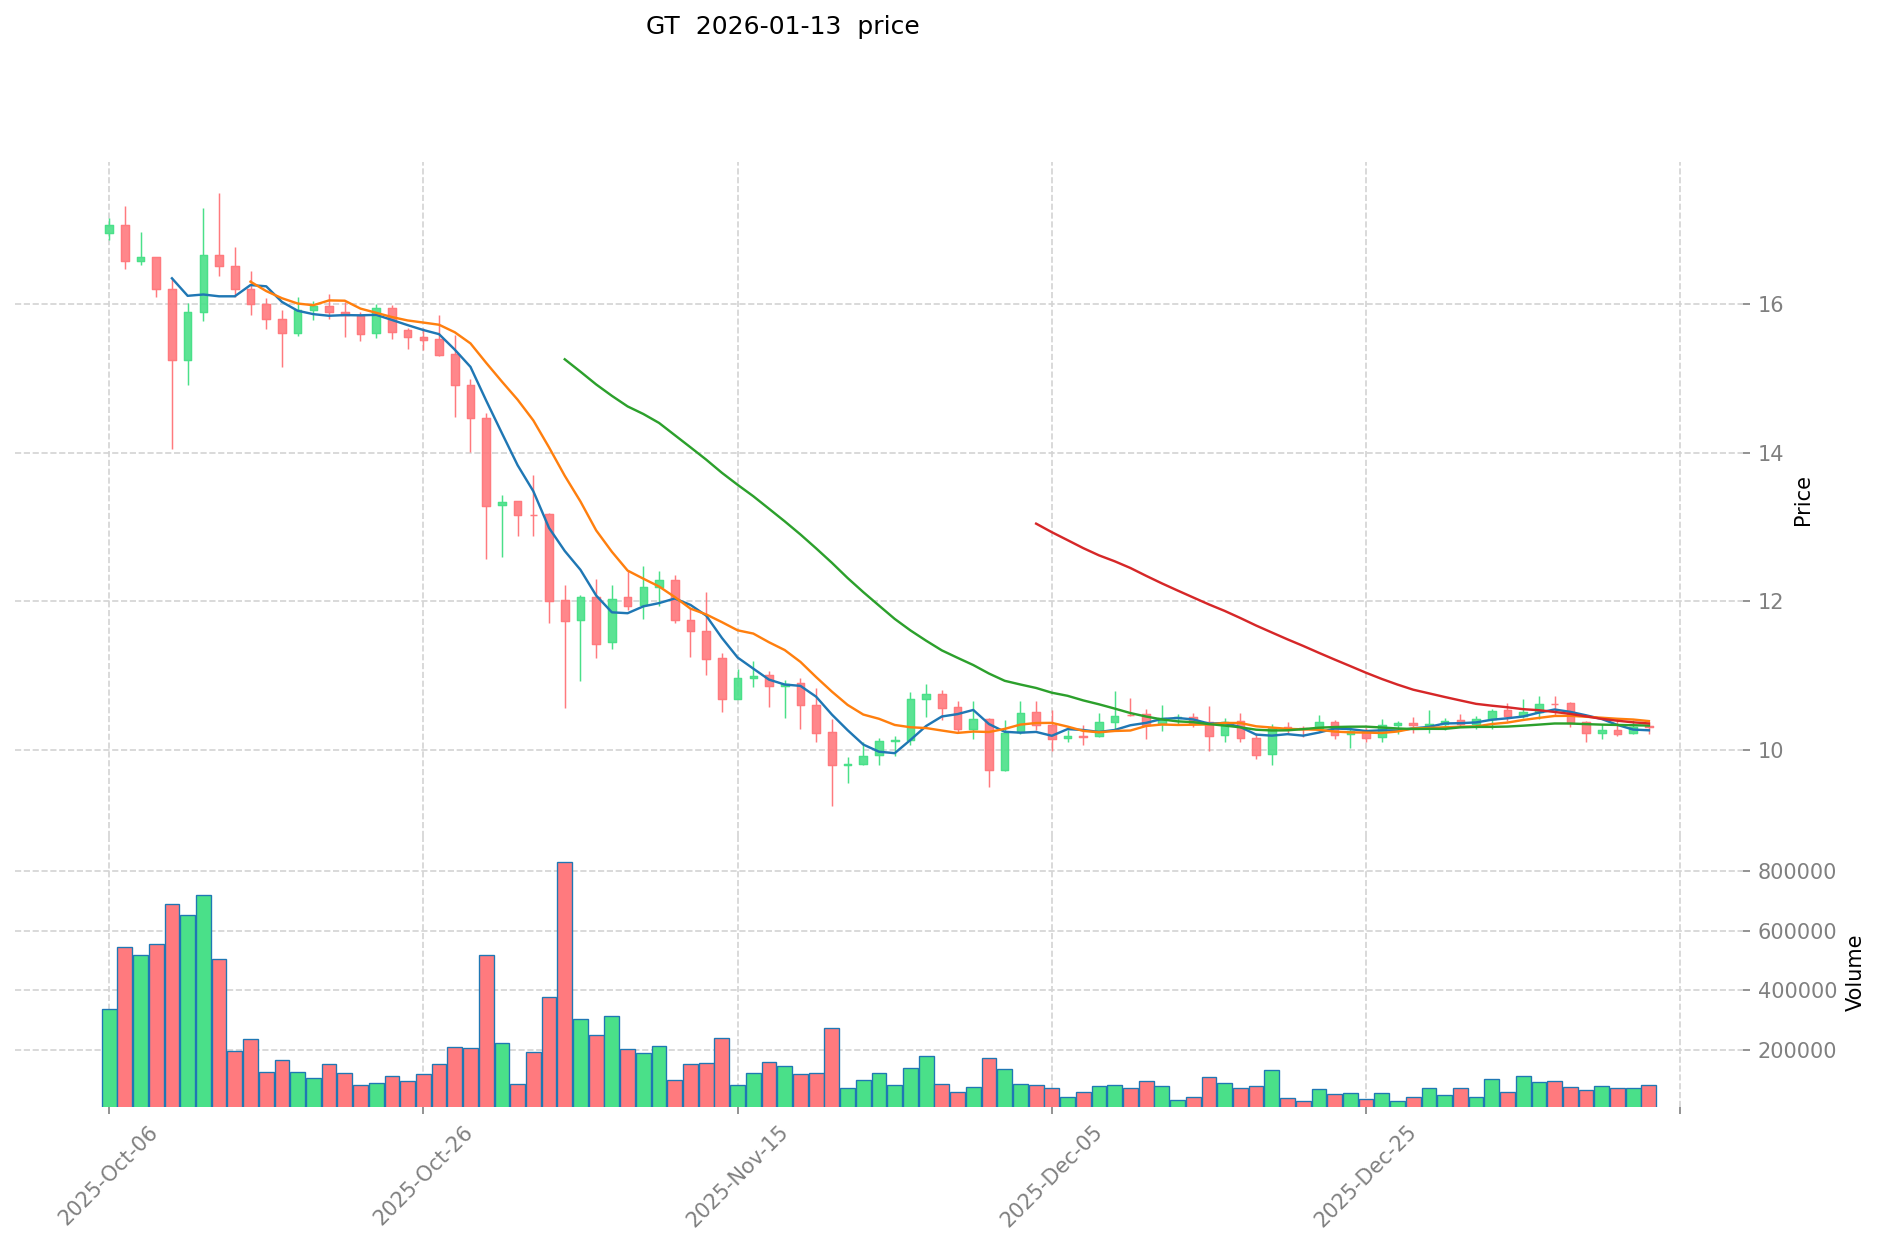
As of January 13, 2026, GT is trading at $10.31, showing a slight decline of 0.38% over the past 24 hours. The token has experienced varying performance across different timeframes, with a 0.1% increase in the past hour, a 3.38% decrease over the past week, and a 1.61% decline over the past 30 days. Over the year, GT has shown a 44.04% decrease from its previous levels.
The current market capitalization stands at approximately $1.03 billion, with a 24-hour trading volume of $788,037.81. GT ranks 85th in the overall cryptocurrency market and holds a market dominance of 0.095%. The circulating supply is 100,359,279 GT tokens, representing 33.45% of the maximum supply of 300 million tokens. The fully diluted market capitalization is valued at $3.09 billion.
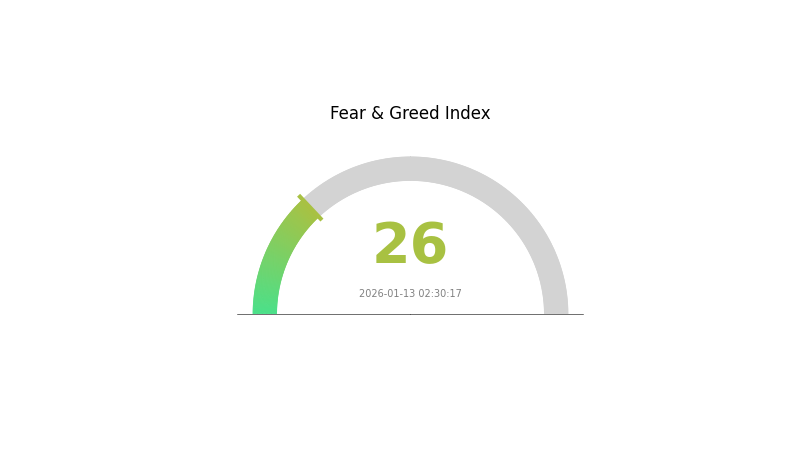
The 24-hour price range has fluctuated between $10.21 and $10.37. The current market sentiment index registers at 26, indicating a "Fear" level in the crypto market environment. GT is actively traded on 6 exchanges and has a holder base of 3,121 addresses.
Click to view the current GT market price
GT Market Sentiment Indicator
2026-01-13 Fear and Greed Index: 26 (Fear)
Click to view the current Fear & Greed Index
The cryptocurrency market is currently experiencing a fear sentiment, with the Fear and Greed Index standing at 26. This reading indicates heightened market anxiety and conservative investor behavior. During periods of fear, risk-averse trading patterns typically dominate, with market participants adopting cautious positions. Such conditions often present contrarian opportunities for long-term investors, as fear-driven selloffs may create attractive entry points. Monitor market developments closely to identify potential turning points and strategic investment opportunities.
GT Holding Distribution
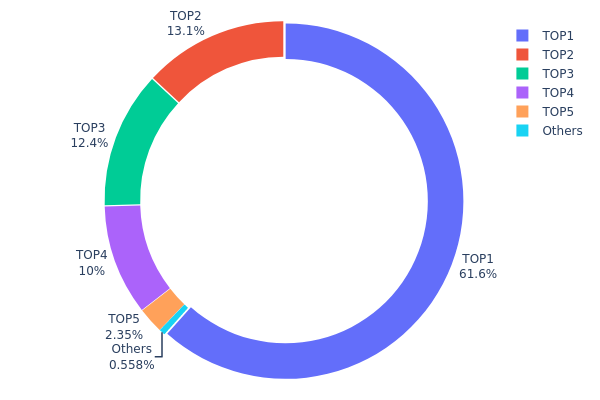
The holding distribution chart reveals the concentration of token ownership across different wallet addresses, serving as a crucial indicator for assessing market structure and decentralization levels. By examining the proportion of GT tokens held by top addresses, we can evaluate potential risks associated with centralized holdings and their implications for market stability.
Current data shows a highly concentrated holding pattern for GT. The top address (0x2b8f...95f308) controls 184,819.43K GT tokens, representing 61.60% of the total supply. The top five addresses collectively hold approximately 97.42% of all GT tokens, with only 0.58% distributed among other addresses. This extreme concentration indicates that GT's ownership structure is predominantly centralized, with a small number of entities controlling the vast majority of tokens.
Such concentrated holding distribution presents significant implications for market dynamics. The dominance of a single address holding over 60% of the supply creates potential vulnerabilities, including heightened price volatility risks and susceptibility to large-scale sell pressure. While this concentration may reflect strategic holdings by the project team or institutional investors, it also means that market liquidity and price discovery mechanisms could be significantly influenced by the actions of a few major holders. From a decentralization perspective, the current distribution suggests limited token dispersion across the broader community, which may impact governance participation and network resilience.
Click to view current GT Holding Distribution
| Top |
Address |
Holding Qty |
Holding (%) |
| 1 |
0x2b8f...95f308 |
184819.43K |
61.60% |
| 2 |
0x1c4b...bb558c |
39296.03K |
13.09% |
| 3 |
0xc882...84f071 |
37170.19K |
12.39% |
| 4 |
0x9bbe...252b19 |
30000.00K |
10.00% |
| 5 |
0xaaac...3dca17 |
7038.97K |
2.34% |
| - |
Others |
1675.38K |
0.58% |
II. Core Factors Influencing GT's Future Price
Supply Mechanism
- Dynamic Destruction Mechanism: GT implements a dynamic destruction mechanism that adjusts based on market conditions and platform development. The core logic involves continuous destruction strategies to reduce circulation supply, thereby enhancing GT's scarcity and value.
- Historical Pattern: The destruction mechanism has historically contributed to reducing token supply in the market, which may support value appreciation over time through increased scarcity.
- Current Impact: The ongoing dynamic adjustments to the destruction mechanism continue to influence GT's supply dynamics, potentially affecting its market valuation as circulation decreases.
Macroeconomic Environment
- Monetary Policy Impact: Global monetary policies and central bank decisions influence the broader cryptocurrency market sentiment and capital flows, which can affect GT's price movements.
- Geopolitical Factors: International political and economic developments create volatility in financial markets, including cryptocurrency markets, impacting investor sentiment and trading behaviors.
Market Dynamics
- Investor Sentiment: Market sentiment and investor confidence play significant roles in GT's price movements, influenced by broader cryptocurrency market trends and platform-specific developments.
- Market Conditions: Overall cryptocurrency market conditions, including liquidity levels and trading volumes, affect GT's price discovery and valuation in the marketplace.
III. GT Price Prediction for 2026-2031
2026 Outlook
- Conservative prediction: $9.682 - $10.3
- Neutral prediction: Around $10.3
- Optimistic prediction: Up to $14.523 (requires favorable market conditions and strong platform performance)
2027-2029 Mid-term Outlook
- Market stage expectation: Potential consolidation phase with gradual recovery momentum, marked by increasing average price levels and expanding trading ranges
- Price range predictions:
- 2027: $9.9292 - $13.52854, with an average around $12.4115
- 2028: $8.04141 - $18.28772, with an average around $12.97002
- 2029: $9.37732 - $16.72289, with an average around $15.62887
- Key catalysts: Gate.com platform ecosystem expansion, increasing utility of GT token, broader crypto market recovery trends, and enhanced token use cases within the exchange infrastructure
2030-2031 Long-term Outlook
- Baseline scenario: $8.41146 - $16.17588 (assuming stable market conditions and continued platform growth)
- Optimistic scenario: $16.17588 - $21.35216 (with accelerated adoption and favorable regulatory environment)
- Transformational scenario: $18.2011 - $27.20783 (under conditions of exceptional market growth and significant Gate.com ecosystem breakthroughs)
- 2026-01-13: GT demonstrates baseline positioning at approximately $9.682 - $14.523 range, establishing foundation for potential multi-year growth trajectory
| Year |
Predicted High Price |
Predicted Average Price |
Predicted Low Price |
Price Change |
| 2026 |
14.523 |
10.3 |
9.682 |
0 |
| 2027 |
13.52854 |
12.4115 |
9.9292 |
20 |
| 2028 |
18.28772 |
12.97002 |
8.04141 |
25 |
| 2029 |
16.72289 |
15.62887 |
9.37732 |
51 |
| 2030 |
21.35216 |
16.17588 |
8.41146 |
56 |
| 2031 |
27.20783 |
18.76402 |
18.2011 |
81 |
IV. GT Professional Investment Strategy and Risk Management
GT Investment Methodology
(I) Long-term Holding Strategy
- Suitable for: Investors seeking exposure to exchange ecosystem tokens with moderate to high risk tolerance
- Operational Recommendations:
- Consider accumulating positions during market corrections when GT trades below key support levels
- Monitor GateChain ecosystem developments and GT utility expansion as fundamental indicators
- Storage Solution: Utilize Gate Web3 Wallet for secure asset custody with multi-signature protection and recovery mechanisms
(II) Active Trading Strategy
- Technical Analysis Tools:
- Moving Averages: Track 50-day and 200-day moving averages to identify trend reversals and momentum shifts
- Volume Analysis: Monitor 24-hour trading volume (currently $788,037) relative to historical averages to gauge market participation
- Swing Trading Considerations:
- Establish clear entry and exit points based on GT's recent trading range between $10.21 and $10.37
- Implement stop-loss orders to limit downside exposure during volatile market conditions
GT Risk Management Framework
(I) Asset Allocation Principles
- Conservative Investors: 2-5% of crypto portfolio allocation
- Aggressive Investors: 8-15% of crypto portfolio allocation
- Professional Investors: Up to 20% with active hedging strategies
(II) Risk Hedging Solutions
- Portfolio Diversification: Balance GT holdings with major cryptocurrencies and stablecoins to reduce concentration risk
- Position Sizing: Adjust exposure based on market volatility and GT's correlation with broader crypto market trends
(III) Secure Storage Solutions
- Hot Wallet Recommendation: Gate Web3 Wallet for convenient trading and DeFi participation with enhanced security features
- Cold Storage Option: Hardware wallet solutions for long-term holdings exceeding immediate trading needs
- Security Precautions: Enable two-factor authentication, maintain private key backups in secure offline locations, and regularly review wallet security settings
V. GT Potential Risks and Challenges
GT Market Risks
- Price Volatility: GT has declined 44.04% over the past year, demonstrating significant price fluctuation characteristic of exchange tokens
- Market Correlation: Performance may be closely tied to Gate.com's trading volume and overall crypto market sentiment
- Liquidity Considerations: With daily trading volume of $788,037 across 6 exchanges, liquidity may be limited compared to major cryptocurrencies
GT Regulatory Risks
- Exchange Token Classification: Evolving regulatory frameworks may impact how exchange tokens are classified and traded in different jurisdictions
- Compliance Requirements: Increased regulatory scrutiny of crypto exchanges may affect GT's utility and adoption
- Geographic Restrictions: Regulatory developments in key markets could limit GT's accessibility or use cases
GT Technical Risks
- Smart Contract Vulnerabilities: As GateChain develops its ecosystem, potential smart contract bugs or exploits could impact GT value
- Network Security: Blockchain infrastructure dependencies require ongoing security maintenance and upgrades
- Competitive Technology: Emerging blockchain solutions may offer superior features compared to GateChain's current architecture
VI. Conclusion and Action Recommendations
GT Investment Value Assessment
GT presents a mixed value proposition. With a circulating supply of 100.36 million tokens (33.45% of max supply) and market capitalization of $1.03 billion, GT maintains a position among established exchange tokens. The token's recent performance shows a 3.38% decline over 7 days and 1.61% decline over 30 days, reflecting broader market headwinds. Long-term value depends on GateChain ecosystem expansion, GT utility enhancement, and Gate.com's competitive positioning. Short-term risks include market volatility, regulatory uncertainty, and competitive pressure from other exchange ecosystems.
GT Investment Recommendations
✅ Beginners: Start with minimal allocation (1-3% of crypto portfolio), focus on understanding GT's utility within the Gate.com ecosystem before increasing exposure
✅ Experienced Investors: Consider GT as part of a diversified exchange token portfolio, actively monitor GateChain development milestones and market trends
✅ Institutional Investors: Evaluate GT within broader exchange token sector analysis, implement structured entry strategies with clear risk parameters
GT Trading Participation Methods
- Spot Trading: Direct GT purchases on Gate.com and supported exchanges for immediate ownership
- Dollar-Cost Averaging: Systematic periodic purchases to mitigate timing risk and reduce average acquisition cost
- Yield Opportunities: Explore GT staking or liquidity provision programs within the Gate.com ecosystem for potential passive income
Cryptocurrency investment carries extremely high risk, and this article does not constitute investment advice. Investors should make prudent decisions based on their own risk tolerance and are advised to consult professional financial advisors. Never invest more than you can afford to lose.
FAQ
What is the current price of GT, and what are its historical high and low prices?
GT's historical all-time high is $25.94 and all-time low is $0.25754. For the current real-time price as of January 13, 2026, please check live market data on major exchanges for the most up-to-date information.
What are the main factors affecting GT price?
GT price is primarily influenced by market demand, trading volume, network development, community sentiment, macroeconomic conditions, and competitive dynamics within the crypto ecosystem.
How to conduct GT price prediction? What are the analysis methods?
GT price prediction employs technical analysis, global capital flow analysis, and market comparison methods. Based on 2026 forecasts, GT is expected to fluctuate between $3.68 and $10.78. Multiple analytical frameworks help assess potential price movements in the crypto market.
What are the risks of GT price prediction and how should I avoid them?
GT price prediction risks include market volatility and technological changes. Monitor market trends closely, stay updated on project developments, and diversify your strategy regularly to mitigate potential losses effectively.
What are the differences in price trends of GT compared to similar tokens?
GT's price movements are influenced by its platform features and market positioning. Unlike similar tokens, GT demonstrates distinct volatility patterns driven by trading volume, governance participation, and platform-specific utility, reflecting unique market dynamics.
What are professional analysts' expectations for GT's future price?
Professional analysts predict GT could reach as high as 15.90 USD, indicating significant upside potential. Current prediction data remains limited, but the forecast suggests strong growth prospects for the token.
How are GT's technical and fundamental aspects, and what impact do they have on price?
GT shows strong technical support with potential rebound prospects and solid fundamentals driving positive price momentum. Breaking through resistance levels could push prices higher, while failing to hold support may trigger declines.
* The information is not intended to be and does not constitute financial advice or any other recommendation of any sort offered or endorsed by Gate.