This comprehensive analysis examines Humanity (H) token's market position and price trajectory from 2026 to 2031. Currently trading at $0.18 with a $330 million market cap, H serves as a Sybil-resistant blockchain protocol for decentralized identity verification. The article reviews H's historical price evolution, market dynamics including the 81.5% concentration among top five holders, and core factors influencing future trends such as supply mechanisms and macroeconomic conditions. Professional forecasts project H reaching $0.39458 by 2031 under favorable scenarios. The guide provides actionable investment strategies for different investor profiles, including long-term holding and active trading approaches via Gate exchange, alongside comprehensive risk management frameworks and security recommendations. Key risks include high volatility, regulatory uncertainty, and technical challenges requiring careful investor consideration.
Introduction: H's Market Position and Investment Value
Humanity (H), positioned as a Sybil-resistant blockchain designed for secure, private, and decentralized identity verification, has achieved notable market presence since its launch in 2025. As of 2026, Humanity's market capitalization has reached approximately $330 million, with a circulating supply of around 1.825 billion tokens, and the price maintains at approximately $0.18. This asset, recognized as an innovative identity verification protocol, is playing an increasingly vital role in addressing digital identity challenges within the blockchain ecosystem.
This article will comprehensively analyze H's price trends from 2026 to 2031, combining historical patterns, market supply and demand dynamics, ecosystem development, and macroeconomic conditions, to provide investors with professional price forecasts and practical investment strategies.
I. H Price History Review and Market Status
H Historical Price Evolution Trajectory
- 2025: The token experienced notable volatility throughout the year, with price movements reflecting market dynamics and protocol development milestones.
- June 2025: The token reached its historical low point at $0.01781 on June 27, representing a period of market consolidation.
- October 2025: Price peaked at $0.40023 on October 25, marking a period of increased market attention and trading activity.
H Current Market Status
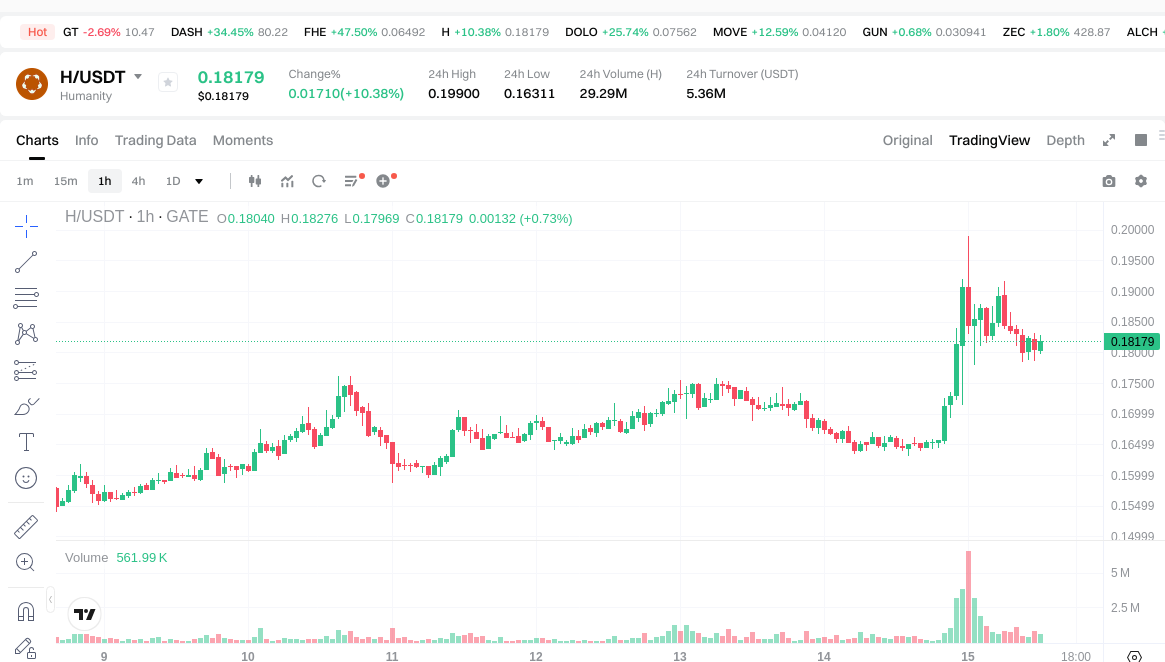
As of January 15, 2026, Humanity (H) is trading at $0.18091, demonstrating a 10.01% increase over the past 24 hours. The token has shown positive momentum across multiple timeframes, with a 15.53% gain over the past week and a 165.43% increase over the 30-day period.
The 24-hour trading range has been established between $0.16311 and $0.199, with total trading volume reaching $5,361,302. The token currently ranks 179th by market capitalization, which stands at approximately $330.16 million based on a circulating supply of 1.825 billion tokens.
With 18.25% of the maximum supply of 10 billion tokens currently in circulation, the fully diluted market capitalization is calculated at approximately $1.81 billion. The token maintains a market dominance of 0.053% and is listed on 26 exchanges, with Gate.com among the trading platforms supporting H.
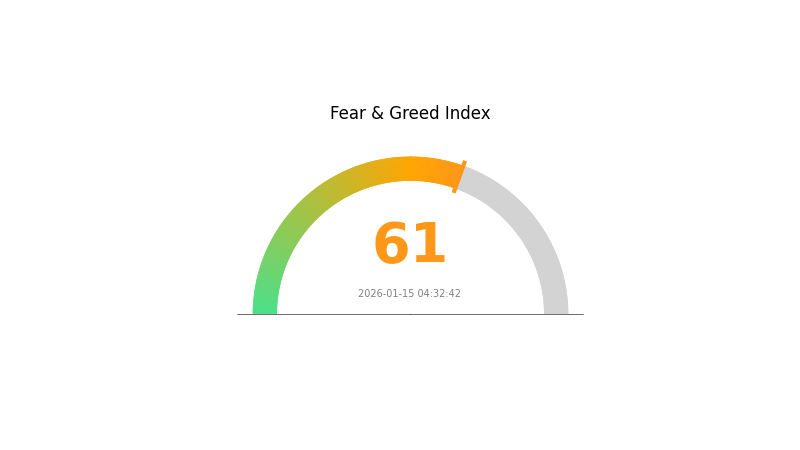
The market sentiment index currently indicates a reading of 61, suggesting a "Greed" environment in the broader market context. The token has approximately 4,614 holders, reflecting a growing community of participants in the Humanity Protocol ecosystem.
Click to view current H market price
Market Sentiment Index
2026-01-15 Fear and Greed Index: 61 (Greed)
Click to view current Fear & Greed Index
The cryptocurrency market is currently showing a strong greed sentiment with an index reading of 61. This elevated level indicates that investors are demonstrating increased risk appetite and optimistic market positioning. During periods of high greed, market participants tend to be more aggressive in their trading activities and investment decisions. Traders should remain vigilant as extreme sentiment readings often precede market corrections. It is advisable to maintain a balanced portfolio strategy and avoid making impulsive decisions based solely on market euphoria.
H Holdings Distribution
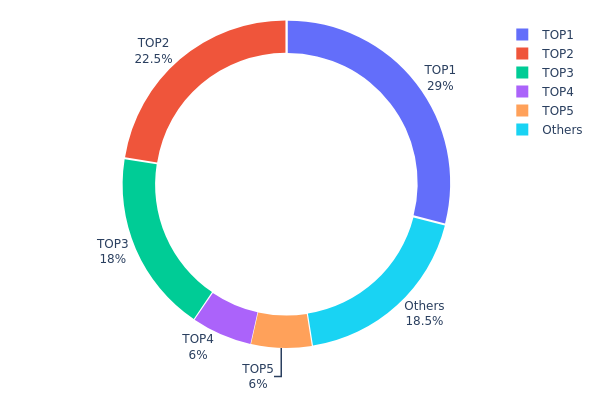
The holdings distribution chart reveals the concentration of token ownership across different wallet addresses, serving as a critical indicator of market structure and decentralization. This metric provides insights into whether a cryptocurrency's supply is controlled by a small group of holders or distributed more evenly across the ecosystem.
Based on the current data, H exhibits significant concentration among top holders. The top five addresses collectively control 81.5% of the total supply, with the largest single address holding 29% (2.9 billion tokens). The second-largest holder possesses 22.5% (2.25 billion tokens), followed by 18% (1.8 billion tokens) in the third position. The remaining addresses outside the top five collectively hold only 18.5%, indicating a highly centralized distribution pattern.
This concentration level presents notable implications for market dynamics. High centralization increases vulnerability to large-scale sell pressure if major holders decide to liquidate positions, potentially triggering significant price volatility. The substantial holdings controlled by few addresses also create conditions where price manipulation becomes theoretically feasible, as coordinated actions by top holders could disproportionately influence market movements. Such distribution patterns typically reduce liquidity depth and may discourage broader retail participation due to concerns about unequal market power dynamics.
Click to view the current H Holdings Distribution
| Top |
Address |
Holding Qty |
Holding (%) |
| 1 |
0x79ca...2c15b6 |
2900000.00K |
29.00% |
| 2 |
0xf35f...470b0f |
2250052.49K |
22.50% |
| 3 |
0x7d0e...7dd78c |
1800000.00K |
18.00% |
| 4 |
0x5242...cf0af8 |
600000.00K |
6.00% |
| 5 |
0x1419...8ecf0b |
600000.00K |
6.00% |
| - |
Others |
1849947.51K |
18.5% |
II. Core Factors Influencing Future H Price Trends
Supply Mechanisms
-
A-Share and H-Share Cross-listing Premium Dynamics: The A-share and H-share premium reflects pricing differences between mainland and Hong Kong markets for dual-listed companies. Historical patterns show A-share premiums averaging 120-128 over H-shares, influenced by investor structure differences, trading costs, and market accessibility. The premium index has exhibited significant volatility, particularly during periods of market stress.
-
Historical Patterns: From 2007-2009, the AH premium experienced extreme fluctuations exceeding 200 during financial crisis periods, dropping below 110 at its lowest. Between 2010-2014, premiums remained relatively stable within the 95-115 range. Following the Shanghai-Hong Kong Stock Connect launch in mid-2014, premiums rose above 120 and stabilized around 128.
-
Current Impact: Recent trends indicate potential structural changes in the traditional 125% premium floor. Insurance capital increasingly allocating to H-shares, mainland technology and pharmaceutical companies listing in Hong Kong, and potential tax policy adjustments may compress AH premiums toward 100% over the coming decade.
Institutional and Major Player Dynamics
-
Institutional Holdings: Insurance institutions have significantly increased Hong Kong market exposure, with Hong Kong market allocation reaching 51% of overseas investments by 2024. Qualified institutional investors holding H-shares for over 12 months receive corporate income tax exemptions, creating incentives for long-term positioning.
-
Corporate Adoption: High-end manufacturing, technology, and innovative pharmaceutical companies are increasingly choosing Hong Kong listings. This trend provides foreign investors streamlined access to quality Chinese assets without foreign exchange restrictions.
-
National Policy Framework: The Shanghai-Hong Kong Stock Connect and Shenzhen-Hong Kong Stock Connect mechanisms enable cross-border investment with daily quotas of RMB 52 billion northbound and RMB 42 billion southbound. Policy support continues emphasizing financial market connectivity while maintaining capital account management.
Macroeconomic Environment
-
Monetary Policy Impact: Dual loose monetary and fiscal policy stances provide important support for market performance. Interest rate trends and liquidity conditions significantly influence valuation levels, particularly for growth-oriented sectors. The U.S. Federal Reserve's monetary policy adjustments create spillover effects on global financial markets.
-
Inflation Hedge Attributes: During periods of economic uncertainty, assets demonstrating stable ROE and dividend characteristics attract increased attention. High dividend-yielding stocks show reduced premium rates in cross-market comparisons, suggesting different pricing dynamics for value versus growth stocks.
-
Geopolitical Factors: Trade policy developments, counter-cyclical adjustment measures, and international relations significantly affect market sentiment and capital flows. Export uncertainties and deglobalization trends create headwinds for certain sectors while potentially benefiting domestic-focused industries.
Technical Development and Ecosystem Building
-
Market Connectivity Enhancement: Technical infrastructure improvements through Stock Connect mechanisms enable more efficient cross-border trading with reduced transaction costs around 0.7% of transaction value. Net settlement and cost-sharing mechanisms minimize overall currency exchange expenses.
-
Investor Structure Evolution: Mainland markets feature approximately 85% individual investor participation by trading volume, while Hong Kong markets show over 50% institutional investor participation. This structural difference influences price discovery efficiency, with institutional investors typically focusing on fundamentals and long-term value.
-
Ecosystem Applications: The gradual shift of high-quality Chinese companies to Hong Kong listings creates a more comprehensive investment ecosystem. Sectors including AI applications, innovative pharmaceuticals, new consumption, and advanced manufacturing are expanding Hong Kong market depth and attractiveness to international capital.
III. 2026-2031 H Price Forecast
2026 Outlook
- Conservative prediction: $0.13792 - $0.18147
- Neutral prediction: $0.18147
- Optimistic prediction: $0.21051 (subject to favorable market conditions)
2027-2029 Outlook
- Market stage expectation: The token is anticipated to enter a gradual growth phase, with potential price volatility as the market matures and adoption increases.
- Price range forecast:
- 2027: $0.10975 - $0.25282
- 2028: $0.14138 - $0.24011
- 2029: $0.21368 - $0.31355
- Key catalysts: Broader market recovery, increased institutional interest, technological upgrades, and enhanced ecosystem development could serve as primary drivers for price appreciation during this period.
2030-2031 Long-term Outlook
- Baseline scenario: $0.20195 - $0.39025 (assuming steady market growth and continued project development)
- Optimistic scenario: $0.27291 - $0.39458 (contingent upon widespread adoption and favorable regulatory environment)
- Transformational scenario: Potential to reach upper ranges of $0.33158 - $0.39458 (requires significant breakthrough in utility, partnerships, or market capitalization expansion)
- 2026-01-15: H price forecast initiates from a base range, with projected cumulative growth reaching up to 83% by 2031 under favorable conditions
| Year |
Predicted High Price |
Predicted Average Price |
Predicted Low Price |
Price Change |
| 2026 |
0.21051 |
0.18147 |
0.13792 |
0 |
| 2027 |
0.25282 |
0.19599 |
0.10975 |
8 |
| 2028 |
0.24011 |
0.22441 |
0.14138 |
24 |
| 2029 |
0.31355 |
0.23226 |
0.21368 |
28 |
| 2030 |
0.39025 |
0.27291 |
0.20195 |
50 |
| 2031 |
0.39458 |
0.33158 |
0.2719 |
83 |
IV. H Professional Investment Strategies and Risk Management
H Investment Methodology
(1) Long-term Holding Strategy
- Suitable for: Investors who believe in decentralized identity verification and privacy-focused blockchain infrastructure
- Operational Recommendations:
- Accumulate positions gradually when price retraces to support levels around $0.16-$0.17
- Consider dollar-cost averaging to mitigate short-term volatility risks
- Secure storage solution: Use Gate Web3 Wallet for enhanced security and user-controlled private key management
(2) Active Trading Strategy
- Technical Analysis Tools:
- Moving Averages: Monitor 7-day and 30-day moving averages to identify trend reversals; current upward momentum suggests continued bullish sentiment
- Volume Analysis: Track 24-hour trading volume ($5.36M) for confirmation of price movements and potential breakout signals
- Swing Trading Key Points:
- Identify entry opportunities near the 24-hour low ($0.163) and set profit targets around recent resistance levels ($0.199)
- Implement stop-loss orders 5-8% below entry price to limit downside exposure
H Risk Management Framework
(1) Asset Allocation Principles
- Conservative Investors: 1-3% of crypto portfolio
- Aggressive Investors: 5-10% of crypto portfolio
- Professional Investors: Up to 15% with appropriate hedging strategies
(2) Risk Hedging Solutions
- Diversification: Balance H holdings with established assets to reduce concentration risk
- Position Sizing: Limit individual position size based on market capitalization volatility and circulating supply dynamics (18.25% currently circulating)
(3) Secure Storage Solutions
- Software Wallet Recommendation: Gate Web3 Wallet offers convenient access with multi-chain support and enhanced security features
- Hardware Wallet Solution: For larger holdings, consider cold storage methods to minimize exposure to online threats
- Security Precautions: Enable two-factor authentication, verify contract addresses (0xcf5104d094e3864cfcbda43b82e1cefd26a016eb on Ethereum), and never share private keys
V. H Potential Risks and Challenges
H Market Risks
- High Volatility: H has demonstrated significant price fluctuations, with 30-day gains exceeding 165%, indicating potential for sharp corrections
- Liquidity Concerns: With only 18.25% of total supply circulating, large token unlocks could create selling pressure
- Market Cap Dependency: Current market dominance of 0.053% suggests susceptibility to broader market sentiment shifts
H Regulatory Risks
- Identity Verification Scrutiny: Decentralized identity protocols may face evolving regulatory frameworks concerning data privacy and compliance standards
- Cross-border Compliance: Global operations require navigation of varying jurisdictional requirements for identity verification systems
- Token Classification Uncertainty: Regulatory clarity around utility tokens in identity verification contexts remains under development in major markets
H Technical Risks
- Smart Contract Vulnerabilities: ERC-20 token implementation requires ongoing security audits to prevent potential exploits
- Scalability Challenges: As adoption grows, the protocol must maintain performance while preserving privacy guarantees
- Competition Pressure: Emerging identity verification solutions could impact H's market positioning and adoption trajectory
VI. Conclusion and Action Recommendations
H Investment Value Assessment
Humanity Protocol presents an innovative approach to Sybil-resistant identity verification through zero-knowledge proof technology. The project's strong recent performance (165% in 30 days, 84% year-over-year) reflects growing interest in decentralized identity solutions. However, investors should recognize the early-stage nature of the protocol, with only 18.25% of tokens circulating and potential for increased supply pressure. Long-term value proposition centers on addressing critical needs for privacy-preserving identity verification in Web3, though execution risks and competitive dynamics warrant careful monitoring.
H Investment Recommendations
✅ Beginners: Start with small position sizes (1-2% of crypto portfolio) and utilize Gate Web3 Wallet for secure storage; focus on understanding the identity verification sector before scaling exposure
✅ Experienced Investors: Consider strategic accumulation during pullbacks, utilizing technical analysis tools to time entries; maintain disciplined risk management with defined exit strategies
✅ Institutional Investors: Conduct comprehensive due diligence on protocol technology, team credentials, and competitive landscape; implement phased allocation with regular portfolio rebalancing
H Trading Participation Methods
- Spot Trading: Purchase H directly on Gate.com with support for multiple trading pairs and competitive liquidity
- Wallet Storage: Transfer holdings to Gate Web3 Wallet for self-custody and enhanced security control
- Portfolio Monitoring: Track H performance metrics, including market cap changes and circulating supply dynamics, to inform position management decisions
Cryptocurrency investments carry extremely high risks, and this article does not constitute investment advice. Investors should make cautious decisions based on their own risk tolerance and are advised to consult professional financial advisors. Never invest more than you can afford to lose.
FAQ
H has shown stable performance over the past year with moderate fluctuations. Over five years, H experienced significant volatility with multiple adjustments between 2021-2025. Late 2025 showed slight upward momentum in trading volume.
What are the main factors affecting H price? How do market, policy, and technology aspects influence it?
H price is primarily influenced by market demand, macroeconomic policies, and technological innovation. Market trading volume fluctuations, regulatory policy changes, and blockchain technology advancements directly determine price trends.
What is the professional analysts' price prediction for H? What is the basis and methodology of the prediction?
Professional analysts typically employ DCF valuation methods to forecast H's future price, calculating present value based on projected cash flows and market fundamentals. Analysis incorporates on-chain metrics, trading volume trends, and tokenomics dynamics to project potential price movements.
What are the risks and limitations of H price predictions? How should I view price predictions rationally?
Price predictions face inherent risks due to market unpredictability, unexpected events, and complex variables. View predictions as reference points only, not certainties. Market sentiment and unforeseen circumstances can rapidly shift valuations, making precise forecasts unreliable for decision-making.
H demonstrates moderate price volatility with stable growth trends relative to comparable assets. Its performance reflects consistent market dynamics without extreme fluctuations, positioning it as a balanced option in its category.
What are the roles of technical analysis and fundamental analysis in H price prediction?
Technical analysis forecasts H price through historical price trends and chart patterns. Fundamental analysis predicts price movements via project economics, tokenomics, and market conditions. Together they provide comprehensive price insights.
* The information is not intended to be and does not constitute financial advice or any other recommendation of any sort offered or endorsed by Gate.