This article offers a detailed analysis of HANA's price trajectory from 2025 to 2030, highlighting its current market status and potential forecasts. It delves into HANA's market position as a crypto gateway and explores factors influencing its future price such as platform development, partnerships, and macroeconomic contexts. The article targets investors seeking insights into HANA's performance, providing professional investment strategies and risk management advice. With in-depth examination of market risks, regulatory challenges, and technological hurdles, it aids in informed decision-making, recommending trading practices on Gate for managing HANA investments.
Introduction: HANA's Market Position and Investment Value
Hana Network (HANA) positions itself as the TikTok of crypto, leveraging livestreaming, casual earning mechanisms, and seamless onboarding experiences to replace centralized exchanges as the dominant crypto gateway. Since its launch, Hana has demonstrated significant traction with 40 million cumulative transactions and 400,000 unique wallet holders, backed by a $9 million funding round. As of December 25, 2025, HANA's market capitalization stands at approximately $2.38 million with a circulating supply of 240 million tokens and a current price of $0.009922. This innovative platform is increasingly playing a crucial role in democratizing cryptocurrency access and adoption.
This article provides a comprehensive analysis of HANA's price trajectory from 2025 through 2030, integrating historical price patterns, market supply and demand dynamics, ecosystem development, and macroeconomic factors to deliver professional price forecasts and actionable investment strategies for investors seeking exposure to this emerging crypto gateway platform.
HANA Network (HANA) Market Analysis Report
I. HANA Price History Review and Current Market Status
HANA Historical Price Evolution
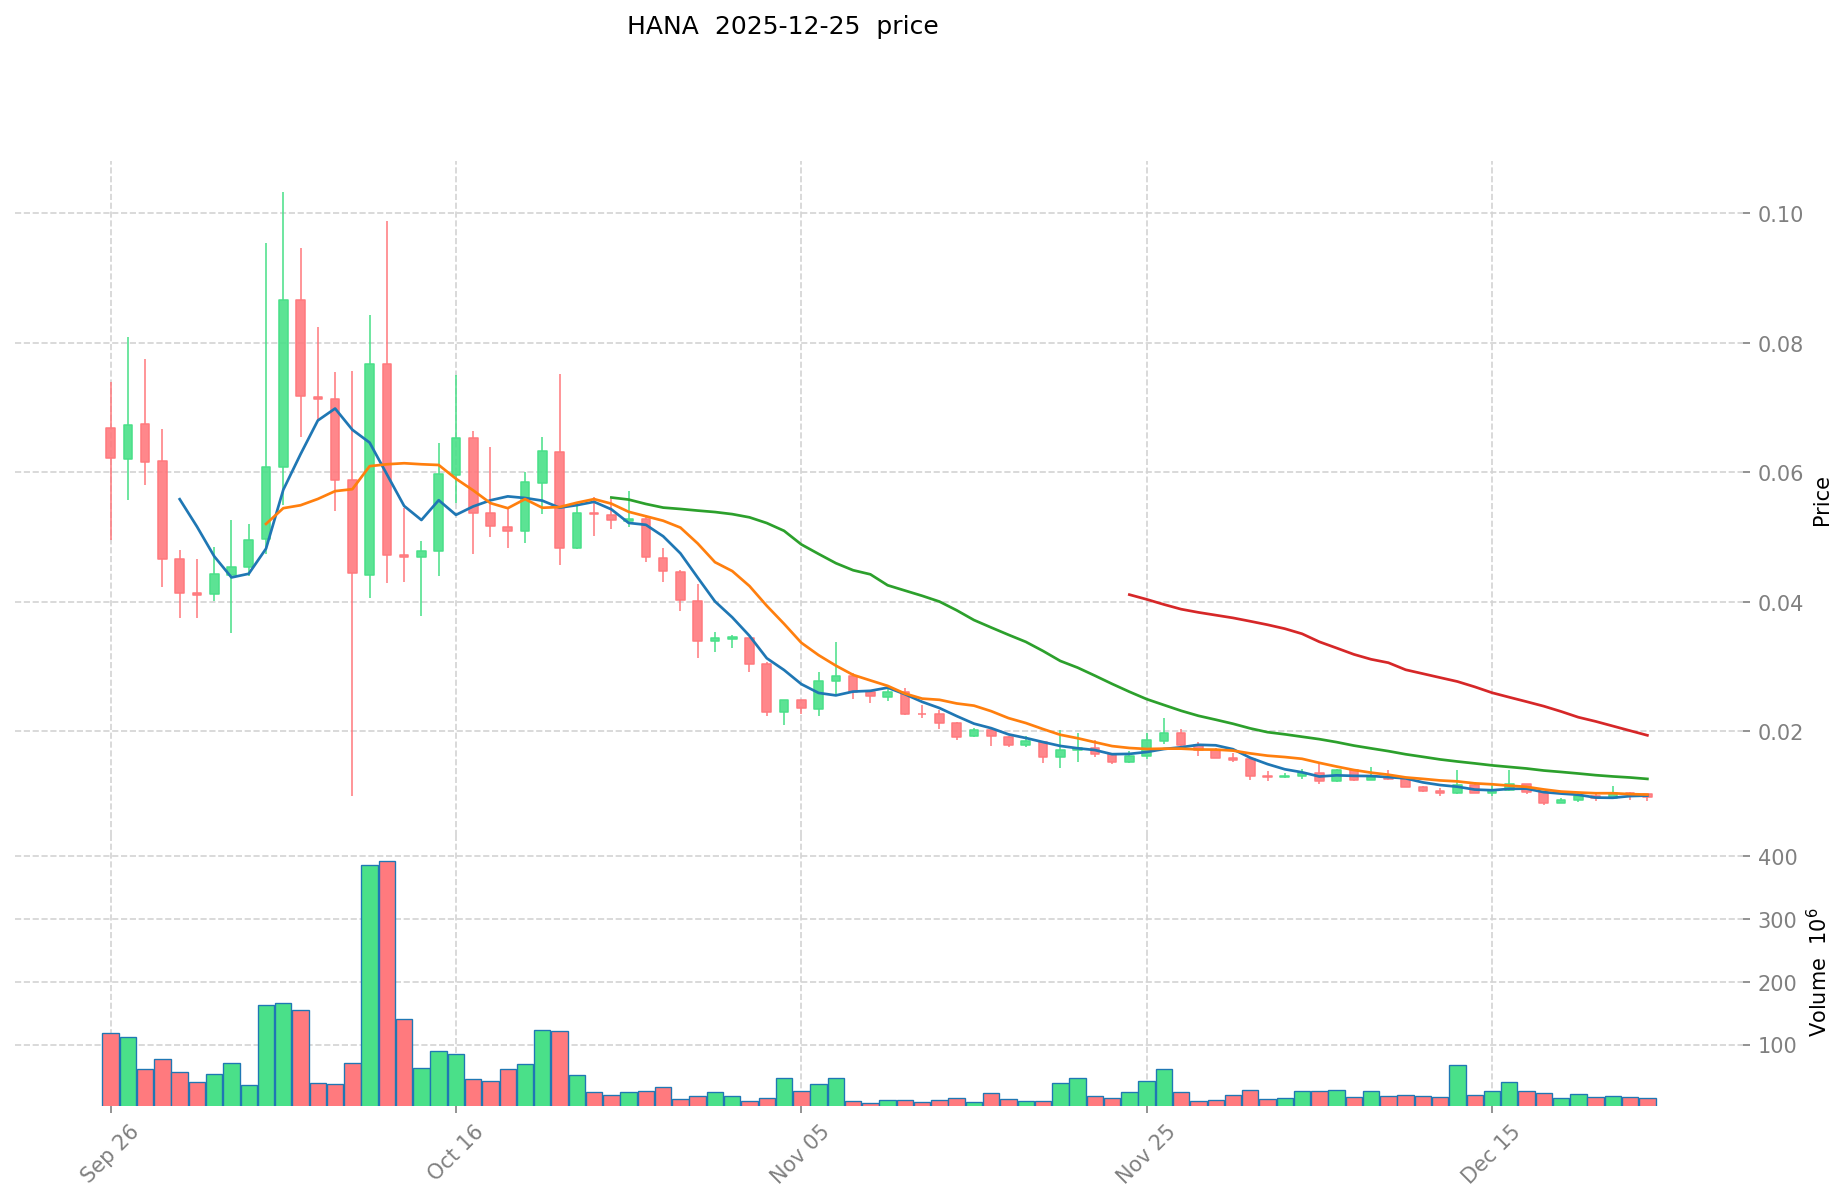
- 2025 (October): HANA reached its all-time high (ATH) of $0.10334 on October 6, 2025, marking a significant peak in the project's trading history.
- 2025 (December): Market correction phase, with HANA declining substantially from its peak levels. On December 18, 2025, HANA touched its all-time low (ATL) of $0.008549, reflecting increased market pressure and volatility.
HANA Current Market Posture
As of December 25, 2025, HANA is trading at $0.009922, representing a marginal decline of -0.46% over the past 24 hours. The token has experienced significant downward pressure over extended timeframes, with a -39.2% decline over the past 30 days and a substantial -90.56% decline over the past year, indicating sustained bearish momentum from its October peak.
Key Market Metrics:
- 24-hour Trading Range: $0.009286 - $0.010008
- 24-hour Volume: $138,144.63
- Market Capitalization: $2,381,280.00 (based on circulating supply)
- Fully Diluted Valuation: $9,922,000.00
- Circulating Supply: 240,000,000 HANA (24% of total supply)
- Total Supply: 1,000,000,000 HANA
- Market Ranking: #2029
Token Distribution:
- Total Holders: 6,410
- Unique Wallets: 400,000
- Cumulative Transactions: 40,000,000
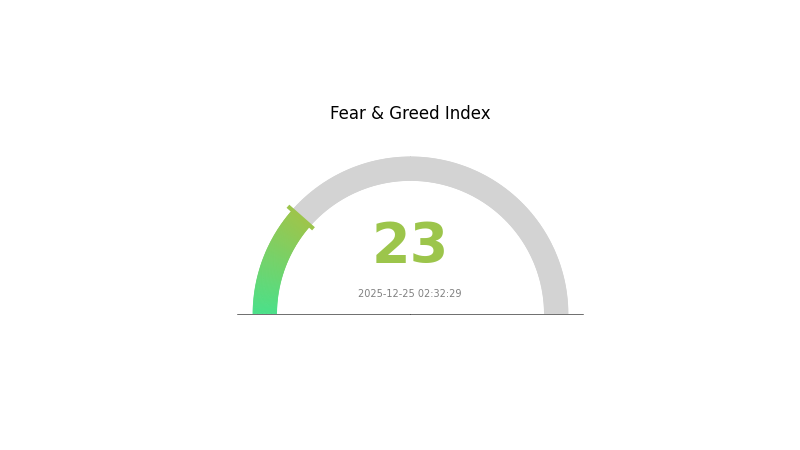
The market sentiment remains extremely fearful (VIX: 23 - Extreme Fear), reflecting broader risk aversion across the cryptocurrency sector on the current date.
View current HANA market price
HANA Market Sentiment Indicator
2025-12-25 Fear & Greed Index: 23 (Extreme Fear)
Click to view current Fear & Greed Index
The cryptocurrency market is currently experiencing extreme fear, with the Fear & Greed Index at 23. This indicates significant market pessimism and heightened risk aversion among investors. During such periods, volatility tends to increase as market participants adopt defensive positions. However, extreme fear often presents contrarian opportunities for long-term investors who maintain conviction in their investment thesis. Monitor market developments closely and consider your risk tolerance before making trading decisions on Gate.com.
HANA Holdings Distribution
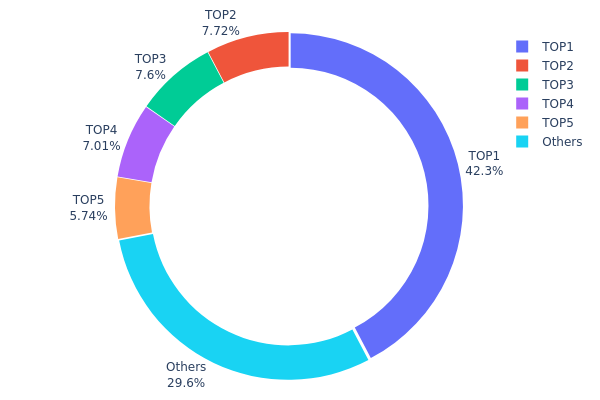
The address holdings distribution chart illustrates the concentration of HANA tokens across blockchain addresses, revealing the ownership structure and potential centralization risks within the network. This metric tracks the top wallet addresses and their respective token quantities, providing critical insights into whether token supply is concentrated among a few entities or distributed more equitably across the ecosystem.
HANA's current holdings distribution exhibits pronounced concentration characteristics. The top address controls 42.29% of the circulating supply, a significant majority that substantially exceeds conventional decentralization benchmarks. When combined, the top five addresses account for 69.33% of total holdings, indicating considerable centralization. This level of concentration raises concerns about potential market manipulation and governance risks, as a single or coordinated group of entities could theoretically exert substantial influence over price movements and protocol decisions. The remaining 29.67% distribution across other addresses suggests a long tail of smaller holders, though this fragmentation alone does not offset the dominance of the top tier.
The implications for market structure are noteworthy. Such concentrated holdings create vulnerability to coordinated sell-offs, which could trigger significant price volatility. Furthermore, the dominant position held by the leading address warrants scrutiny regarding its entity nature—whether it represents team allocation, treasury reserves, or institutional holdings fundamentally affects the protocol's governance legitimacy and market dynamics. From a decentralization perspective, HANA's current distribution reflects a relatively nascent or founder-weighted structure, typical of projects in early distribution phases. Monitoring whether these concentrations disperse over time through organic market activity or protocol releases will be essential to assessing the project's long-term sustainability and community trust.
Click to view current HANA holdings distribution
| Top |
Address |
Holding Qty |
Holding (%) |
| 1 |
0xfd30...a4654e |
422971.63K |
42.29% |
| 2 |
0xc882...84f071 |
77164.88K |
7.71% |
| 3 |
0x73d8...4946db |
76043.36K |
7.60% |
| 4 |
0xf287...4ebe26 |
70056.44K |
7.00% |
| 5 |
0x2e8f...725e64 |
57360.69K |
5.73% |
| - |
Others |
296402.99K |
29.67% |
II. Core Factors Influencing HANA's Future Price
-
Roadmap Development: HANA's future price trajectory will be significantly influenced by the platform's technological roadmap and strategic partnerships. The 2024 Hanafuda roadmap establishes the foundation for ecosystem growth and value proposition enhancement.
-
Partnership Success: The success of collaborative partnerships and integrations with other platforms and services directly impacts user adoption rates and network effects, which are critical drivers of token valuation.
Market Sentiment and Adoption Rate
-
Market Sentiment: The overall trend of the cryptocurrency market plays a crucial role in HANA's price movements. Positive or negative sentiment in the broader digital asset space can amplify or dampen price volatility.
-
User Adoption: The success of Hana Network's user-driven mechanisms and the integration achievements directly correlate with the token's adoption rate. Higher adoption translates to increased utility and demand for HANA tokens.
-
Ecosystem Integration: The extent to which HANA becomes integrated across various platforms and services determines its network value and long-term price sustainability.
Macroeconomic Context
Global macroeconomic conditions in 2026 are expected to shape cryptocurrency valuations. The dollar may experience volatility, and global narratives regarding monetary systems and industrial restructuring could influence investor sentiment toward alternative assets like cryptocurrencies.
III. HANA Price Forecast 2025-2030
2025 Outlook
- Conservative Forecast: $0.00763 - $0.00991
- Neutral Forecast: $0.00991
- Bullish Forecast: $0.01051 (requires sustained market stability and positive sentiment)
2026-2028 Medium-term Outlook
- Market Stage Expectation: Gradual recovery phase with consolidation patterns, characterized by modest appreciation and increasing market participation
- Price Range Forecast:
- 2026: $0.00827 - $0.01245 (estimated 2% gain)
- 2027: $0.01008 - $0.01212 (estimated 14% gain)
- 2028: $0.00786 - $0.01243 (estimated 18% gain)
- Key Catalysts: Ecosystem development initiatives, institutional adoption acceleration, and improved market liquidity through platforms like Gate.com
2029-2030 Long-term Outlook
- Base Case Scenario: $0.01123 - $0.01595 (assumes steady technological adoption and moderate market expansion by 2029)
- Bullish Scenario: $0.01401 - $0.02004 (assumes accelerated ecosystem growth and broader institutional support by 2030)
- Transformational Scenario: $0.02004+ (assumes breakthrough developments in underlying technology, significant partnership announcements, or major market catalyst events materializing by 2030)
- 2030-12-31: HANA targets $0.02004 (potential 41% cumulative appreciation from 2025 baseline, contingent on favorable market conditions and project execution)
| 年份 |
预测最高价 |
预测平均价格 |
预测最低价 |
涨跌幅 |
| 2025 |
0.01051 |
0.00991 |
0.00763 |
0 |
| 2026 |
0.01245 |
0.01021 |
0.00827 |
2 |
| 2027 |
0.01212 |
0.01133 |
0.01008 |
14 |
| 2028 |
0.01243 |
0.01173 |
0.00786 |
18 |
| 2029 |
0.01595 |
0.01208 |
0.01123 |
21 |
| 2030 |
0.02004 |
0.01401 |
0.00757 |
41 |
HANA Network (HANA) Professional Investment Strategy and Risk Management Report
IV. HANA Professional Investment Strategy and Risk Management
HANA Investment Methodology
(1) Long-Term Holding Strategy
-
Target Investors: Long-term believers in social crypto platforms, retail investors seeking exposure to emerging Web3 social networks, and those bullish on Hana's ecosystem growth.
-
Operational Recommendations:
- Dollar-cost averaging (DCA) approach: Invest fixed amounts at regular intervals to reduce timing risk, given HANA's current price volatility (-39.2% over 30 days).
- Establish a core position during market corrections and maintain discipline regardless of short-term price fluctuations.
- Utilize Gate.com's spot trading to accumulate HANA at competitive prices without excessive fees.
(2) Active Trading Strategy
HANA Risk Management Framework
(1) Asset Allocation Principles
- Conservative Investors: 1-3% of total crypto portfolio allocation.
- Active Investors: 3-8% of total crypto portfolio allocation.
- Professional Investors: 5-15% of specialized emerging token portfolios.
(2) Risk Hedging Approaches
- Position Sizing: Never allocate more capital than you can afford to lose, given HANA's extreme 1-year decline of -90.56%.
- Diversification Strategy: Balance HANA exposure with established cryptocurrencies and other asset classes to mitigate concentration risk.
(3) Secure Storage Options
- Hot Wallet Solution: Use Gate.com's native wallet for active trading and short-term holdings to maintain liquidity.
- Self-Custody Approach: For long-term holdings, utilize non-custodial wallet solutions that support BEP-20 tokens on the Binance Smart Chain (BSC).
- Security Best Practices: Enable two-factor authentication on all exchange accounts, never share private keys, use hardware security measures for significant holdings, and regularly audit wallet transactions.
V. HANA Potential Risks and Challenges
HANA Market Risk
- Extreme Price Volatility: HANA has experienced catastrophic losses over the past year (-90.56%), indicating severe market sentiment challenges and potential project execution issues.
- Low Market Liquidity: With 24-hour trading volume of only 138,144.63 HANA and a fully diluted market cap of 9.92 million USD, the token faces liquidity constraints that could amplify price movements.
- Limited Token Circulation: Only 24% of total supply (240 million of 1 billion tokens) is currently in circulation, creating significant dilution risk as additional tokens enter the market.
HANA Regulatory Risk
- Emerging Project Status: As a relatively new social crypto platform, Hana Network may face evolving regulatory scrutiny regarding user protections, content moderation, and financial services compliance.
- Jurisdictional Uncertainty: Social features combined with crypto incentives may trigger regulatory challenges in various jurisdictions regarding money transmission and securities laws.
- Compliance Evolution: Regulatory frameworks for crypto-native social platforms are still developing globally, creating uncertainty for long-term project viability.
HANA Technology Risk
- Platform Execution Risk: Hana's ambitious goal of replacing centralized exchanges as the primary crypto gateway requires flawless execution of livestreaming, earning mechanisms, and onboarding infrastructure.
- Smart Contract Vulnerability: As a BSC-based BEP-20 token, potential vulnerabilities in smart contracts could expose users to losses or protocol failures.
- Scalability Challenges: Supporting 400k unique wallets and 40 million cumulative transactions requires robust infrastructure that must scale seamlessly with user growth.
VI. Conclusion and Action Recommendations
HANA Investment Value Assessment
Hana Network presents an intriguing but highly speculative opportunity in the crypto social platform space. The project demonstrates traction with 40 million cumulative transactions and 400k unique wallets, supported by a 9 million USD funding round. However, the token's devastating 90.56% decline over one year, extreme volatility, and limited liquidity raise serious concerns about market confidence and project execution. The 24% circulation ratio also poses significant dilution risks. Investors should view HANA as a high-risk, potentially high-reward emerging token rather than a stable investment vehicle.
HANA Investment Recommendations
✅ Beginners: Consider HANA only after establishing a diversified crypto portfolio. Start with minimal allocation (0.5-1% of crypto holdings) through dollar-cost averaging on Gate.com. Do not risk capital you cannot afford to lose.
✅ Experienced Investors: Evaluate Hana's product-market fit, user growth metrics, and ecosystem development before making informed allocation decisions. Use technical analysis on Gate.com to identify optimal entry points during market pullbacks.
✅ Institutional Investors: Conduct comprehensive due diligence on Hana's team, technology infrastructure, regulatory compliance status, and competitive positioning within the social crypto landscape before considering portfolio inclusion.
HANA Trading Participation Methods
- Spot Trading on Gate.com: Purchase HANA directly using stablecoins or other cryptocurrencies with competitive trading pairs and reasonable fees.
- Limit Orders: Utilize Gate.com's order management tools to execute trades at predetermined price levels, reducing emotional decision-making during volatile market conditions.
- Portfolio Rebalancing: Periodically adjust HANA holdings relative to overall portfolio performance and market conditions through Gate.com's intuitive interface.
Cryptocurrency investments carry extreme risk. This report does not constitute investment advice. Investors must make decisions based on their individual risk tolerance and should consult qualified financial advisors. Never invest more than you can afford to lose completely.
FAQ
What is the prediction for the Hana token?
Based on technical analysis, HANA token is predicted to reach $0.057228 by January 22, 2026, representing a -25.20% change. Long-term forecasts extend through 2030 with varied market scenarios.
What factors influence HANA token price movements?
HANA token price is influenced by market sentiment, adoption rates, and supply-demand dynamics. Network activity, investor confidence, and broader cryptocurrency market trends also significantly impact price movements.
What is HANA token used for and what is its market cap?
HANA is a meme cryptocurrency on Ethereum launched in September 2024. It features zero buy or sell taxes and a circulating supply of 8.7 billion tokens. The current market cap is approximately $84,476, with recent 24-hour trading volume of $20.27.
What are the risks associated with HANA price predictions?
HANA price predictions carry significant risks due to high market volatility, lack of reliable fundamental indicators, and heavy influence from speculative trading and sentiment shifts. Technical factors rather than underlying developments drive price movements, making accurate predictions challenging.
* The information is not intended to be and does not constitute financial advice or any other recommendation of any sort offered or endorsed by Gate.