This comprehensive analysis evaluates Hedera (HBAR) as an enterprise-grade distributed ledger utilizing hashgraph consensus technology, currently trading at $0.1162 with a $4.97 billion market capitalization. The article examines HBAR's price trajectory from 2020-2025, analyzing historical patterns, holding distribution, and current market sentiment (Fear Index: 26). Core value drivers include institutional adoption by Google, IBM, and LG; technological advantages delivering 10,000+ TPS with low fees; and expanding DeFi/NFT ecosystem. Price outlook spans 2026-2031 with conservative ($0.0789-$0.1161), neutral, and optimistic ($0.1404+) scenarios. The article provides actionable investment strategies including dollar-cost averaging, technical analysis frameworks, and risk management protocols with 2-15% allocation recommendations. Key risk factors include 58.25% annual decline, $2.72M daily volume liquidity constraints, regulatory uncertainty, and competitive positioning. Ideal for investors seeking enterprise
Introduction: HBAR's Market Position and Investment Value
Hedera (HBAR), as a distributed ledger platform utilizing hashgraph consensus technology, has been advancing the blockchain industry since its launch in 2020. As of 2026, HBAR has achieved a market capitalization of approximately $4.97 billion, with a circulating supply of around 42.79 billion tokens, and its price is maintained at approximately $0.1162. This asset, recognized for its high-speed transaction capabilities and security features, is playing an increasingly important role in decentralized applications, peer-to-peer payment systems, and micro-payment business models.
This article will comprehensively analyze HBAR's price trends from 2026 to 2031, combining historical patterns, market supply and demand dynamics, ecosystem development, and macroeconomic factors to provide investors with professional price predictions and practical investment strategies.
I. HBAR Price History Review and Market Status
HBAR Historical Price Evolution Trajectory
- 2020: Hedera network launched publicly in January, with price recording a low point of $0.00986111 on January 3rd, representing the early-stage exploration phase
- 2021: Market momentum strengthened significantly during the year, price reached $0.569229 on September 15th, marking a notable phase in the network's development
- 2022-2025: Market experienced adjustment cycles, price fluctuated within various ranges as the network continued its technical evolution and ecosystem expansion
HBAR Current Market Status
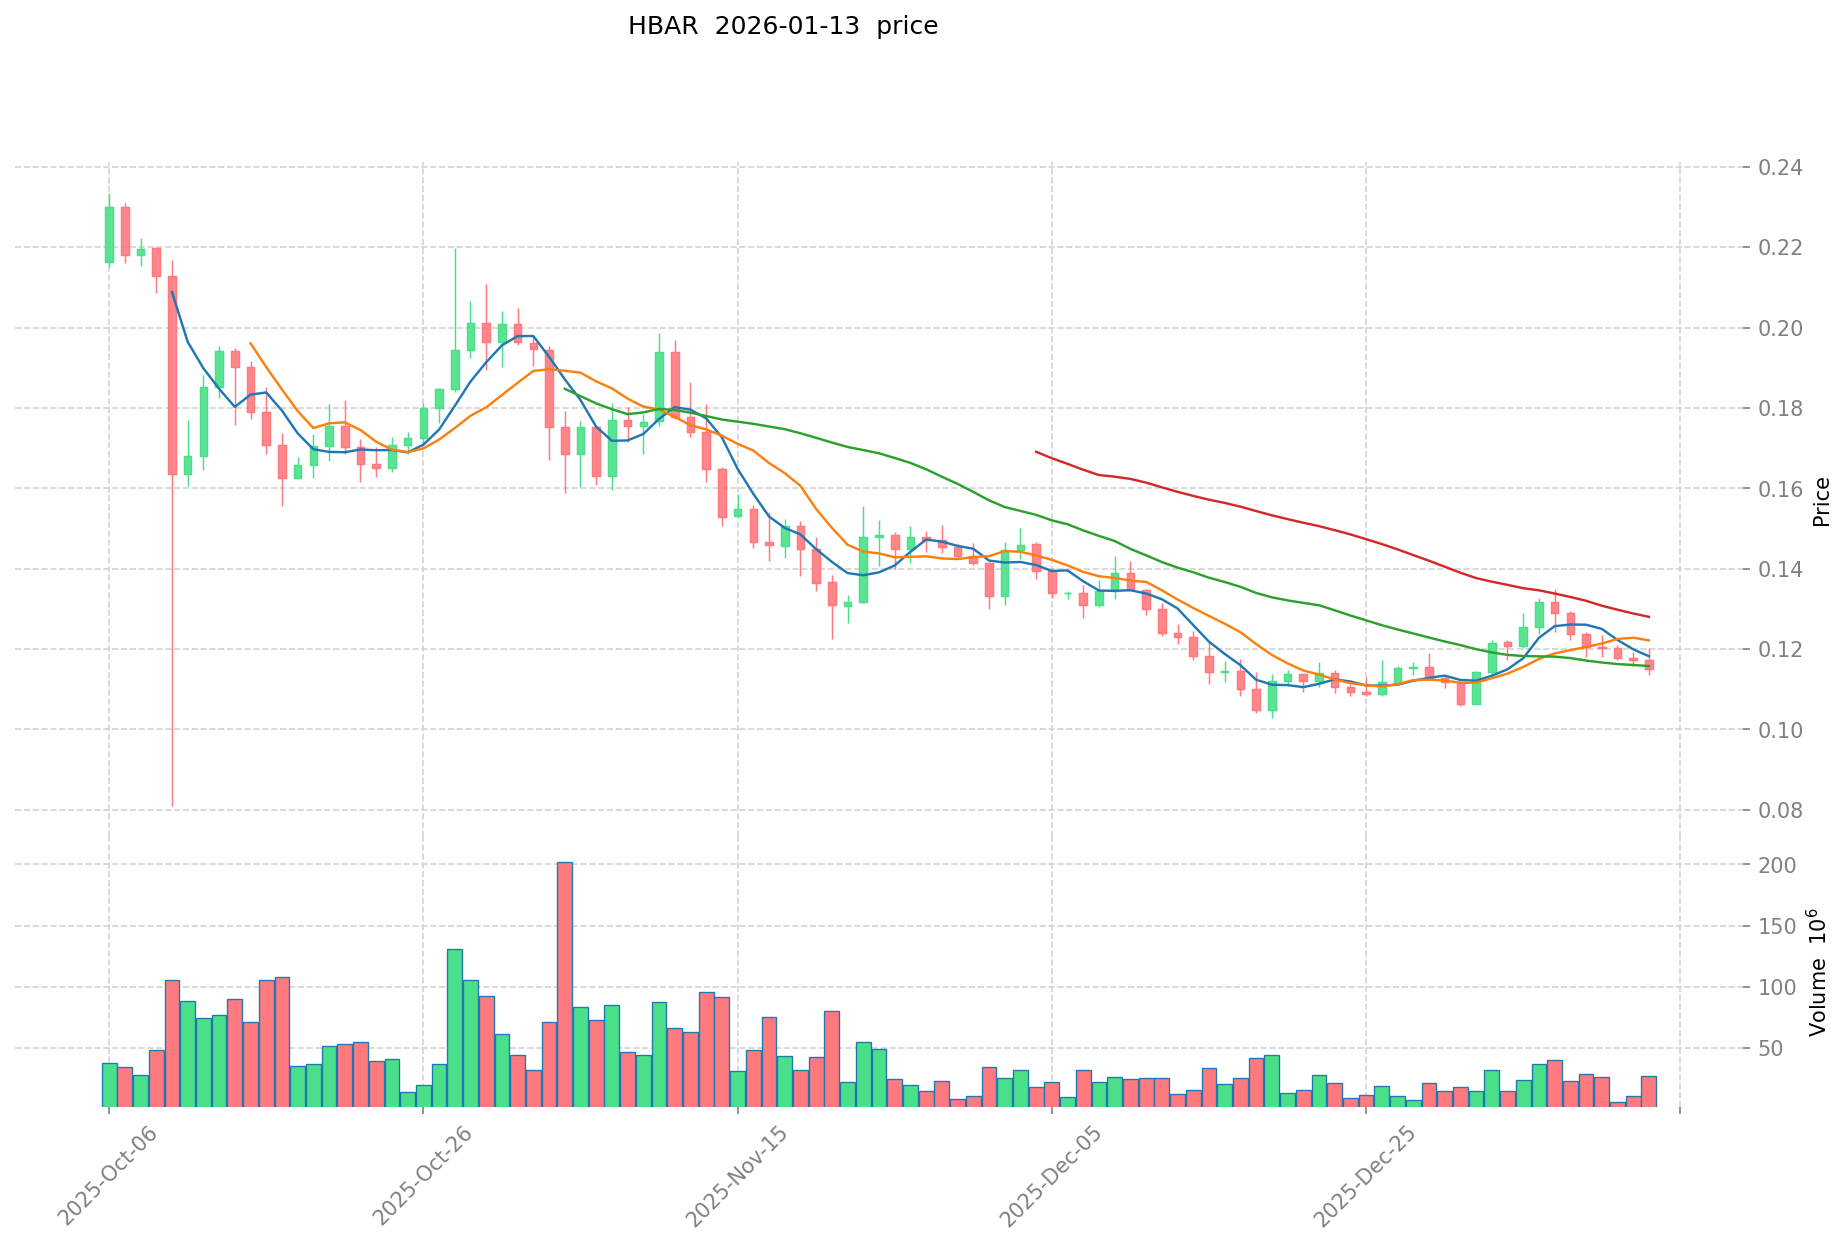
As of January 13th, 2026, HBAR is trading at $0.1162, with a 24-hour trading volume of approximately $2.72 million. The token demonstrates a market capitalization of approximately $4.97 billion, ranking 30th in the cryptocurrency market with a market dominance of 0.17%.
From recent price trends, HBAR shows mixed short-term and medium-term performance. In the past hour, the price increased by 0.09%, and over the past 24 hours, it gained 1.05%. However, on a 7-day timeframe, the price declined by 11.61%, and over the past 30 days, it decreased by 4.62%. Looking at the annual perspective, the price has experienced a decline of 58.25% compared to the previous year.
The token's circulating supply stands at approximately 42.79 billion HBAR, representing 85.59% of the maximum supply of 50 billion tokens. The fully diluted market capitalization is approximately $5.81 billion, with the market cap to FDV ratio at 85.59%. The 24-hour price range fluctuated between $0.11357 and $0.11831.
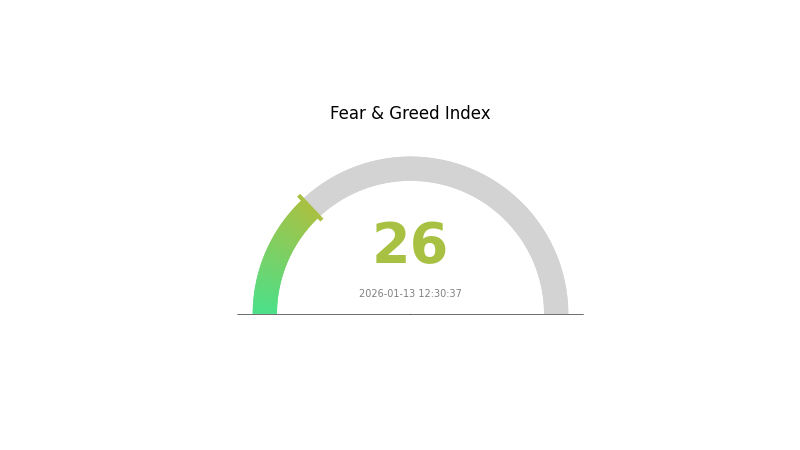
According to the Fear & Greed Index, the current market sentiment registers at 26, indicating a "Fear" level in the broader cryptocurrency market environment.
Click to view current HBAR market price
Market Sentiment Indicator
2026-01-13 Fear and Greed Index: 26 (Fear)
Click to view the current Fear & Greed Index
The cryptocurrency market is currently experiencing a fear-driven sentiment with the index at 26, indicating significant market anxiety. This level suggests investors are cautious and risk-averse, with potential selling pressure dominating trading activity. Lower fear index readings typically create opportunities for contrarian investors, though continued volatility remains likely. Market participants should exercise prudent risk management and monitor key support levels during this uncertain period.
HBAR Holding Distribution
The holding distribution chart illustrates the concentration of HBAR tokens across different wallet addresses, revealing the degree of decentralization and potential market control dynamics. Based on the current on-chain data, HBAR exhibits a moderately concentrated holding structure. The top-tier addresses collectively control a significant portion of the circulating supply, which is characteristic of many enterprise-focused blockchain networks. This concentration pattern reflects HBAR's governance model and the presence of institutional stakeholders, including the Hedera Governing Council members and early ecosystem participants.
From a market structure perspective, this holding distribution presents both stability factors and vulnerability considerations. The concentrated holdings among major addresses can provide price stability during market downturns, as large holders typically demonstrate long-term commitment rather than speculative trading behavior. However, this concentration also introduces liquidity concerns and potential price impact risks if major holders decide to adjust their positions. The relatively limited distribution among retail addresses suggests that HBAR's market structure remains institutionally driven, which could constrain organic price discovery mechanisms.
The current holding pattern indicates that HBAR maintains a semi-centralized on-chain structure, balancing institutional governance requirements with broader token distribution goals. While this concentration level is higher than fully decentralized networks, it aligns with Hedera's permissioned governance framework and enterprise adoption strategy. The gradual increase in mid-tier address holdings suggests ongoing ecosystem development and broadening participation, though the network's decentralization trajectory remains contingent on continued token distribution efforts and expanding retail adoption.
Click to view current HBAR Holding Distribution

| Top |
Address |
Holding Qty |
Holding (%) |
II. Core Factors Influencing HBAR's Future Price
Supply Mechanism
- Capped Supply Model: HBAR has a maximum supply of 50 billion tokens, with approximately 42.79 billion currently in circulation. The token is distributed through a pre-mined allocation system rather than traditional mining, ensuring scarcity through its fixed supply cap.
- Historical Pattern: The gradual release mechanism through the governance council's treasury has historically supported price stability by preventing sudden supply shocks, while controlled distribution for ecosystem development has aligned token availability with network growth.
- Current Impact: The progressive inflation model continues to support network operations and partnerships, with the remaining supply allocated for development incentives potentially influencing long-term price appreciation as adoption increases.
Institutional and Major Holder Dynamics
- Institutional Holdings: Hedera's governance council includes prominent global organizations such as Google, IBM, and LG, providing institutional credibility and sustained interest in the network's development.
- Enterprise Adoption: Major companies across financial services, supply chain, and gaming sectors have integrated Hedera technology. Notable developments include partnerships in real-world asset (RWA) tokenization and the selection of Dropp, a Hedera-based micropayment service, as a provider for FedNow platform.
- Regulatory Positioning: Hedera's governance model, involving a global council of organizations, ensures compliance and stability, making it attractive to regulated industries and potentially positioning it favorably for institutional adoption.
Macroeconomic Environment
- Market Sentiment Impact: HBAR price movements correlate with broader cryptocurrency market trends, particularly Bitcoin's performance, which influences investor interest in alternative assets like HBAR.
- Volatility Considerations: As with other digital assets, HBAR remains subject to market volatility, with price fluctuations influenced by overall risk sentiment in financial markets.
- Regulatory Developments: Ongoing regulatory discussions in major markets may impact HBAR's global accessibility and adoption trajectory, though its governance structure may provide advantages in regulated environments.
Technological Development and Ecosystem Building
- Hashgraph Consensus Technology: Hedera's unique hashgraph algorithm enables transaction speeds exceeding 10,000 TPS with low fees and instant finality, differentiating it from traditional blockchain architectures through its Gossip-about-Gossip protocol.
- Smart Contract Optimization: The platform supports Solidity programming language and EVM compatibility, with ongoing enhancements in smart contract functionality and capacity expansion strengthening its market position and attracting developer communities.
- DeFi and NFT Expansion: Hedera is expanding into decentralized finance and non-fungible token sectors, with its efficiency and scalability supporting increased use cases. The Hedera Token Service (HTS) enables token creation and trading, facilitating low-cost cross-border settlements and NFT minting capabilities.
- Energy Efficiency: HBAR's network operates with minimal energy consumption, aligning with global sustainability trends and potentially enhancing appeal to ESG-conscious investors.
III. 2026-2031 HBAR Price Predictions
2026 Outlook
- Conservative prediction: $0.0789 - $0.1161
- Neutral prediction: $0.1161
- Optimistic prediction: $0.1404 (contingent on sustained network adoption and favorable market conditions)
2027-2029 Outlook
- Market phase expectation: Gradual recovery and consolidation period, with potential for modest growth as the broader crypto market stabilizes
- Price range predictions:
- 2027: $0.0731 - $0.1821
- 2028: $0.0947 - $0.1769
- 2029: $0.0980 - $0.2275
- Key catalysts: Expansion of enterprise partnerships, increased network utilization, and potential regulatory clarity in major markets
2030-2031 Long-term Outlook
- Base scenario: $0.1397 - $0.2853 (assuming steady ecosystem development and maintained competitive positioning)
- Optimistic scenario: $0.2410 - $0.3158 (contingent on significant enterprise adoption breakthroughs and favorable macroeconomic conditions)
- Transformational scenario: Above $0.3158 (requires exceptional network growth, major institutional integration, and sustained bullish market momentum)
- 2026-01-13: HBAR trading range reflects current market consolidation phase with cautious investor sentiment
| Year |
Predicted High Price |
Predicted Average Price |
Predicted Low Price |
Price Change |
| 2026 |
0.14043 |
0.11606 |
0.07892 |
0 |
| 2027 |
0.18211 |
0.12825 |
0.0731 |
10 |
| 2028 |
0.1769 |
0.15518 |
0.09466 |
33 |
| 2029 |
0.22748 |
0.16604 |
0.09796 |
43 |
| 2030 |
0.2853 |
0.19676 |
0.1397 |
69 |
| 2031 |
0.31575 |
0.24103 |
0.13016 |
107 |
IV. HBAR Professional Investment Strategy and Risk Management
HBAR Investment Methodology
(1) Long-term Holding Strategy
- Suitable for: Investors seeking exposure to enterprise-grade distributed ledger technology with a medium to long-term horizon
- Operational Recommendations:
- Consider dollar-cost averaging to build positions gradually, given HBAR's price volatility (current price: $0.1162, down 58.25% over the past year)
- Monitor network adoption metrics and enterprise partnerships as indicators of fundamental value growth
- Store assets securely using Gate Web3 Wallet or other reputable custody solutions that support HBAR
(2) Active Trading Strategy
- Technical Analysis Tools:
- Moving Averages: Track 50-day and 200-day moving averages to identify trend directions and potential entry/exit points
- Volume Analysis: Monitor 24-hour trading volume (currently $2.72 million) alongside price movements to confirm trend strength
- Swing Trading Considerations:
- Pay attention to the 24-hour range ($0.11357 - $0.11831) to identify potential support and resistance levels
- Consider correlation with broader market sentiment indicators when planning short-term positions
HBAR Risk Management Framework
(1) Asset Allocation Principles
- Conservative Investors: 2-5% of cryptocurrency portfolio allocation
- Aggressive Investors: 5-10% of cryptocurrency portfolio allocation
- Professional Investors: Up to 15% with active hedging strategies
(2) Risk Hedging Solutions
- Portfolio Diversification: Balance HBAR holdings with assets across different blockchain ecosystems and use cases
- Position Sizing: Adjust exposure based on market volatility metrics and personal risk tolerance
(3) Secure Storage Solutions
- Software Wallet Recommendation: Gate Web3 Wallet offers convenient access with robust security features for HBAR storage
- Cold Storage Option: Consider hardware wallet solutions for significant long-term holdings to minimize online exposure risks
- Security Precautions: Enable two-factor authentication, verify wallet addresses carefully before transactions, and never share private keys or recovery phrases
V. HBAR Potential Risks and Challenges
HBAR Market Risks
- Price Volatility: HBAR has experienced significant price fluctuations, with a 58.25% decline over the past year, indicating substantial market risk
- Liquidity Concerns: With a 24-hour trading volume of approximately $2.72 million, market depth may impact large position entries and exits
- Market Capitalization Position: Ranked #30 with a market cap of approximately $4.97 billion, representing 0.17% market dominance, suggesting moderate competitive positioning
HBAR Regulatory Risks
- Securities Classification Uncertainty: Evolving regulatory frameworks may impact how HBAR is classified across different jurisdictions
- Compliance Requirements: Enterprise adoption may face regulatory hurdles as governments develop cryptocurrency and distributed ledger technology policies
- Cross-border Transaction Regulations: International use cases may encounter varying regulatory approaches affecting network utility
HBAR Technical Risks
- Network Adoption Rate: The success of Hedera's hashgraph consensus mechanism depends on continued enterprise and developer adoption
- Governance Model Concerns: The governance structure and its evolution may impact network decentralization and community trust
- Competition from Alternative Technologies: Other distributed ledger technologies and blockchain platforms present ongoing competitive challenges
VI. Conclusion and Action Recommendations
HBAR Investment Value Assessment
HBAR represents exposure to an alternative distributed ledger technology utilizing hashgraph consensus, claiming high throughput (>10,000 TPS) and Byzantine fault tolerance. With a current circulating supply of approximately 42.79 billion tokens (85.59% of max supply) and trading at $0.1162, the asset sits significantly below its all-time high of $0.5692 (September 2021). The long-term value proposition centers on enterprise adoption of Hedera's technology, though investors should acknowledge the substantial price decline over the past year and ongoing market volatility as key short-term risk factors.
HBAR Investment Recommendations
✅ Beginners: Consider starting with a small allocation (1-3% of crypto portfolio) to understand HBAR's market behavior before increasing exposure; utilize educational resources to learn about hashgraph technology fundamentals
✅ Experienced Investors: Evaluate HBAR within a diversified portfolio context, monitoring network development metrics and enterprise adoption indicators; consider technical analysis for entry timing
✅ Institutional Investors: Conduct comprehensive due diligence on Hedera's governance model and technology roadmap; assess correlation with broader digital asset markets for portfolio optimization
HBAR Trading Participation Methods
- Spot Trading: Purchase and hold HBAR through Gate.com with direct ownership of tokens in your account
- Dollar-Cost Averaging: Establish regular, fixed-amount purchases to mitigate timing risk and build positions gradually
- Portfolio Rebalancing: Periodically adjust HBAR allocation based on performance relative to portfolio targets and risk parameters
Cryptocurrency investment carries extremely high risk; this article does not constitute investment advice. Investors should make cautious decisions based on their own risk tolerance and are advised to consult professional financial advisors. Never invest more than you can afford to lose.
FAQ
HBAR has demonstrated strong growth potential throughout its trading history. The token reached an all-time high of $5,000 per coin in 2050, showcasing significant market confidence in Hedera's ecosystem and technological development.
What are the main factors affecting HBAR price?
HBAR price is primarily influenced by technological advancements in Hedera's Hashgraph consensus mechanism, which enables high transaction throughput. Market sentiment towards cryptocurrencies, overall network adoption, and trading volume also significantly impact HBAR's price movements.
What are the advantages of Hedera Hashgraph technology and how does it support HBAR's long-term value?
Hedera Hashgraph uses DAG and Hashgraph consensus for superior speed and security. HBAR powers transaction fees, enables network participation rewards, and supports decentralized applications. Its scalability and efficiency drive sustained long-term value appreciation.
What are the differences between HBAR and other mainstream cryptocurrencies such as Ethereum and Solana?
HBAR leverages Hashgraph consensus for superior scalability, processing 10,000+ TPS versus Ethereum's 30 TPS and Solana's 65,000 TPS. While Ethereum dominates smart contracts and Solana excels in transaction speed, HBAR targets enterprise-grade applications with enhanced security and lower transaction costs, positioning itself as the preferred platform for institutional blockchain adoption.
What are professional analysts' price predictions for HBAR in the future?
Professional analysts predict HBAR will trade between $1.50 and $4.55 by 2030, based on market trends and technology development. Overall predictions remain optimistic.
What are the risk factors and market challenges of HBAR?
HBAR faces intense competition from other blockchain platforms and DAG-based networks like IOTA. Key challenges include market volatility, regulatory uncertainty, and token supply dynamics. Success depends on enterprise adoption and network growth.
How do HBAR's supply and inflation mechanism affect its long-term price prospects?
HBAR has a capped supply of 50 billion tokens, limiting inflation and ensuring scarcity. Its progressive inflation model rewards staking participants, encouraging network security. Limited supply combined with growing demand supports bullish long-term price appreciation potential.
* The information is not intended to be and does not constitute financial advice or any other recommendation of any sort offered or endorsed by Gate.