The article offers a detailed analysis of the Humanscape Token (HUMA), focusing on its market position, price history, and future price projections from 2025 to 2030. It evaluates supply mechanisms, institutional backing, macroeconomic influences, and technological advancements to provide investment strategies and risk assessments for investors. The text primarily targets institutional and experienced crypto investors seeking insights into PayFi networks and decentralized finance innovations. Structured into sections on market status, influencing factors, forecasts, and investment strategies, the article facilitates a comprehensive understanding of HUMA's potential within the crypto market. Keywords such as "HUMA price prediction", "investment strategy", and "PayFi ecosystem" enhance scan-readability.
Introduction: HUMA's Market Position and Investment Value
Huma Finance (HUMA) operates as a PayFi network that supports global payment financing by providing instant access to liquidity. Since its launch in May 2025, the project has established itself on the Solana blockchain with a growing ecosystem of users and liquidity providers. As of December 18, 2025, HUMA has achieved a fully diluted market capitalization of $302.2 million, with a circulating supply of approximately 1.73 billion tokens trading at $0.03022 per unit. This innovative PayFi infrastructure is playing an increasingly critical role in revolutionizing decentralized payment financing solutions.
This article will comprehensively analyze HUMA's price trajectory through 2030, combining historical price patterns, market supply and demand dynamics, ecosystem development, and macroeconomic conditions to provide investors with professional price forecasts and actionable investment strategies. Whether you are evaluating HUMA as a long-term holding or analyzing short-term trading opportunities on platforms like Gate.com, this analysis will equip you with the insights needed to make informed investment decisions.
I. HUMA Price History Review and Current Market Status
HUMA Historical Price Movement Trajectory
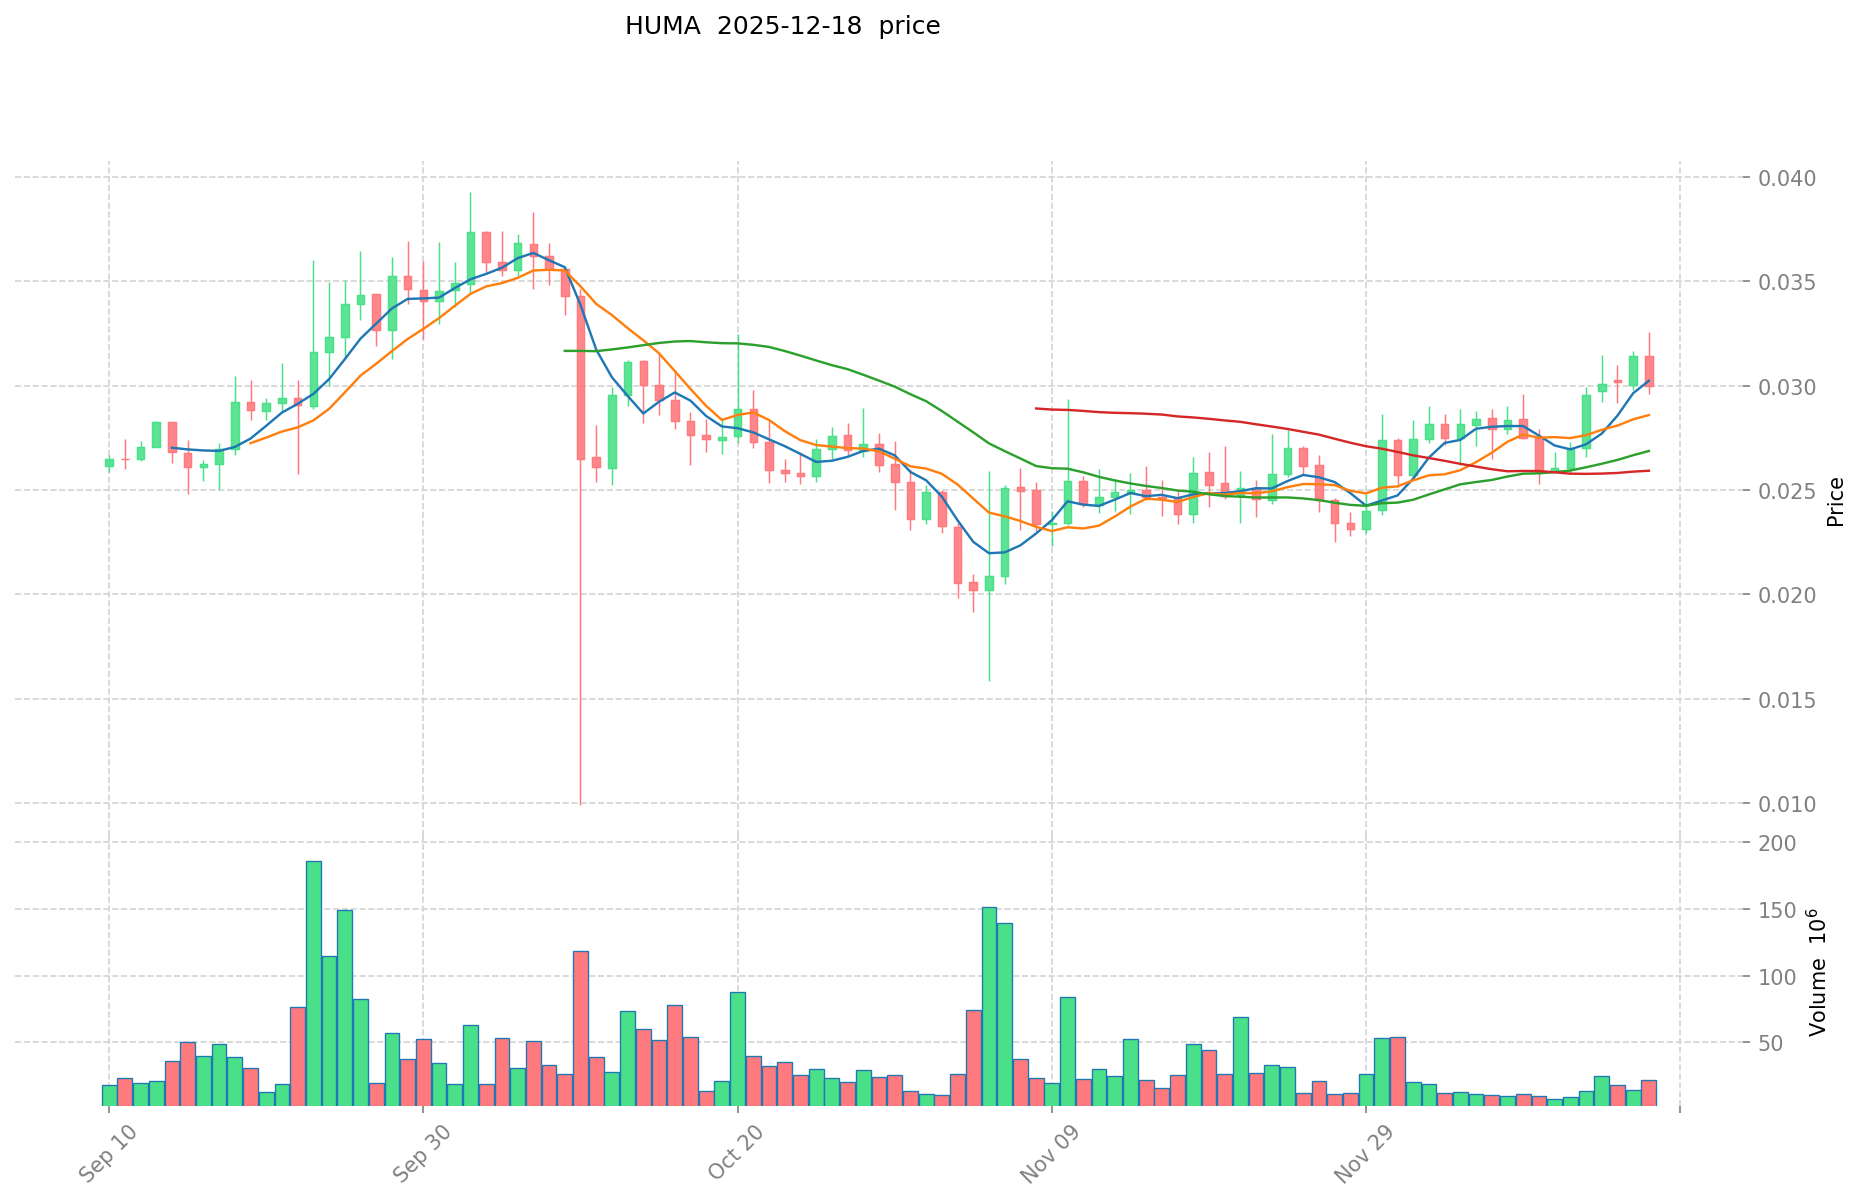
HUMA reached its all-time high of $0.112 on May 26, 2025, representing the peak valuation during its trading history. Subsequently, the token experienced a significant decline, hitting its all-time low of $0.00989 on October 10, 2025, marking a substantial correction from the peak levels.
As of December 18, 2025, HUMA is trading at $0.03022, reflecting a 24-hour price decline of -6.28%. The token experienced a minor 1-hour pullback of -0.13%, while demonstrating stronger medium-term performance with a 7-day gain of 14.42% and a 30-day appreciation of 25.50%.
The 24-hour trading volume stands at $510,474.46, with the token showing a daily range between $0.02962 (low) and $0.03221 (high). HUMA maintains a market capitalization of approximately $52.38 million against a fully diluted valuation of $302.2 million, indicating a circulating supply ratio of 17.33% relative to its total supply of 10 billion tokens.
Currently ranked #489 by market cap, HUMA commands a market dominance of 0.0097%, with 25,222 active token holders across 37 cryptocurrency exchanges. The token operates on the Solana blockchain, with its contract address HUMA1821qVDKta3u2ovmfDQeW2fSQouSKE8fkF44wvGw.
Visit HUMA Market Price on Gate.com for real-time updates.
HUMA Market Sentiment Indicator
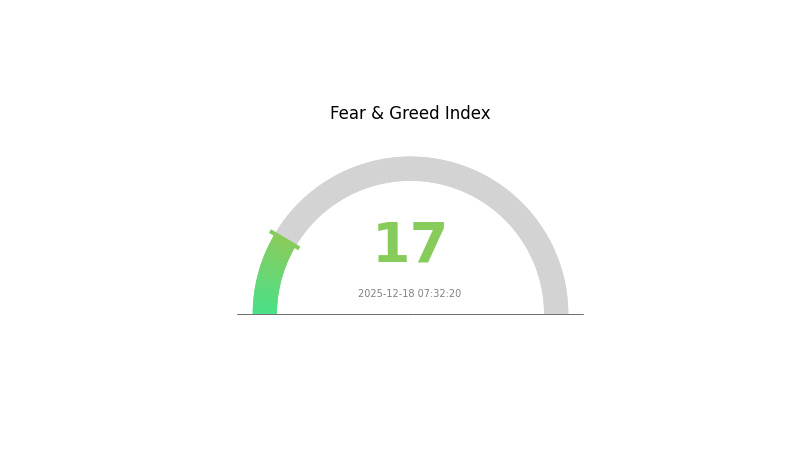
2025-12-18 Fear and Greed Index: 17 (Extreme Fear)
Click to view current Fear & Greed Index
The cryptocurrency market is currently experiencing extreme fear, with the Fear and Greed Index at 17. This indicates significant market pessimism and heightened risk aversion among investors. During periods of extreme fear, markets often present contrarian opportunities for long-term investors. However, caution remains essential as volatility may persist. Monitor key support levels and maintain disciplined risk management strategies. Consider dollar-cost averaging approaches to navigate this uncertain sentiment environment on Gate.com.
HUMA Holdings Distribution
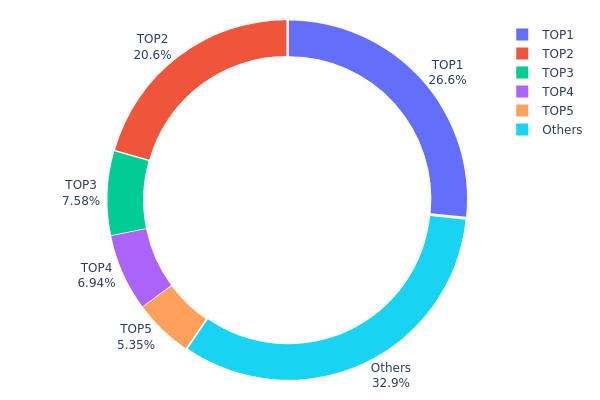
The address holdings distribution chart provides a visual representation of how HUMA tokens are concentrated across different wallet addresses on-chain. This metric serves as a critical indicator of token decentralization, market structure stability, and potential vulnerability to price manipulation. By analyzing the top holders and the proportion of tokens they control, we can assess the health of the token's distribution ecosystem and evaluate concentration risks.
HUMA currently exhibits moderate to high concentration characteristics. The top five addresses collectively control approximately 67.06% of the total token supply, with the largest holder commanding 26.61% and the second-largest holding 20.60%. This level of concentration raises considerations regarding market influence. However, the remaining addresses account for 32.94% of holdings, indicating that roughly one-third of tokens are distributed across a broader base of smaller holders. While the top two addresses individually represent significant stakes, the presence of a substantial "others" category suggests that HUMA has not reached extreme centralization levels comparable to projects where top holders control over 80-90% of the supply.
The current distribution pattern presents both structural implications and risk factors. The concentration among the top five addresses could potentially enable coordinated selling pressure or market movements if these holders act in concert, which may contribute to increased price volatility. Conversely, if these addresses represent institutional holdings, long-term stakes, or development team allocations, they may function as stabilizing anchors. The relatively balanced split between concentrated holdings and dispersed smaller addresses indicates a moderately decentralized on-chain structure, though continued monitoring of these top addresses remains essential for assessing whether concentration levels shift toward greater centralization or gradual distribution over time.
Click to view current HUMA holdings distribution
| Top |
Address |
Holding Qty |
Holding (%) |
| 1 |
7tsyeZ...BtLmZV |
2661366.68K |
26.61% |
| 2 |
DZaR8L...PRR44U |
2060000.00K |
20.60% |
| 3 |
ApNmbp...iApedh |
757500.00K |
7.57% |
| 4 |
2uH2dT...xwXwwP |
694119.94K |
6.94% |
| 5 |
9WzDXw...YtAWWM |
534856.54K |
5.34% |
| - |
Others |
3292153.13K |
32.94% |
II. Core Factors Influencing HUMA's Future Price
Supply Mechanism
-
Deflationary Token Model: HUMA implements a token burn mechanism designed to reduce circulating supply over time. Industry analysts suggest that if the annual burn rate stabilizes at 10%, the circulating supply could decrease to 860 million tokens by 2030, potentially driving per-token value higher at equivalent market capitalization levels.
-
Current Impact: The deflationary mechanics position HUMA as a potential "Bitcoin of PayFi," where supply constraints combined with growing protocol adoption could create upward price pressure as demand increases relative to available tokens.
Institutional and Major Holder Dynamics
-
Institutional Backing: Huma Finance's development team has secured over $46 million in funding from established cryptocurrency venture capital firms including ParaFi Capital and Fenbushi Capital, demonstrating strong institutional confidence in the project.
-
Enterprise Adoption: The protocol has achieved significant traction in real-world applications, processing over $4 billion in on-chain transaction volume as of Q1 2025. The ecosystem supports dual-chain integration on Solana and BSC, with strategic partnerships established with aggregators and market makers including Jupiter and Kamino to ensure trading depth and liquidity.
Macroeconomic Environment
-
Monetary Policy and Market Sentiment: The overall cryptocurrency market atmosphere significantly impacts HUMA's price. Bitcoin's breakthrough to $110,000 in 2025 triggered a 45% increase across the DeFi sector, with capital flowing into the RWA (Real World Assets) track, directly boosting HUMA demand. When mainstream cryptocurrencies lead bull market trends, rising investor risk appetite channels substantial capital into tokens like HUMA.
-
Regulatory Framework Impact: The U.S. GENIUS Act's stringent stablecoin reserve requirements may strengthen Huma Finance's compliance advantages, potentially attracting institutional capital inflows. Regulatory clarity at national levels represents a significant long-term tailwind for protocol expansion.
Technological Development and Ecosystem Construction
-
Zero-Knowledge Proof Privacy Module: The planned implementation of zero-knowledge proof privacy enhancements is projected to attract more institutional users. Following this upgrade, HUMA's market capitalization could advance toward $500 million, corresponding to a potential price level of $0.29 per token.
-
Real Asset Collateralization Innovation: Huma Finance's core technical advancement enables enterprises to upload invoices and accounts payable on-chain, obtaining stablecoin loans after fee deduction. This reduces settlement time from traditional finance's 2-5 day standard to near-instant execution, fundamentally improving capital efficiency for businesses.
-
Ecosystem Applications: The protocol operates through a dual-layer yield model where liquidity providers (LPs) can deposit stablecoins for baseline yields or sacrifice portion of stablecoin returns in exchange for increased HUMA token rewards. This mechanism incentivizes protocol participation and creates diverse value capture paths for ecosystem participants.
III. 2025-2030 HUMA Price Forecast
2025 Outlook
- Conservative Forecast: $0.0154 - $0.0332
- Base Case Forecast: $0.0302
- Bullish Forecast: $0.0332 (requires sustained platform adoption and ecosystem expansion)
2026-2027 Medium-term Outlook
- Market Stage Expectation: Consolidation with gradual recovery phase, marked by incremental ecosystem development and user base expansion
- Price Range Forecasts:
- 2026: $0.0197 - $0.0416 (5% gain potential)
- 2027: $0.0308 - $0.0389 (21% cumulative gain potential)
- Key Catalysts: Protocol upgrades, strategic partnerships, increased institutional interest in decentralized credit protocols, and expansion into new markets
2028-2030 Long-term Outlook
- Base Case: $0.0238 - $0.0472 (24% cumulative gain by 2028, assuming steady market conditions)
- Optimistic Scenario: $0.0365 - $0.0607 (40-70% cumulative gains by 2029-2030, contingent on mainstream adoption of decentralized lending solutions and broader crypto market recovery)
- Transformation Scenario: $0.0341 - $0.0547 (sustained 70% growth trajectory by 2030, driven by regulatory clarity, institutional adoption, and full integration into decentralized finance infrastructure)
- 2030-12-18: HUMA Average $0.0516 (Projected consolidated valuation reflecting matured market positioning)
| 年份 |
预测最高价 |
预测平均价格 |
预测最低价 |
涨跌幅 |
| 2025 |
0.03324 |
0.03022 |
0.01541 |
0 |
| 2026 |
0.04157 |
0.03173 |
0.01967 |
5 |
| 2027 |
0.03885 |
0.03665 |
0.03079 |
21 |
| 2028 |
0.04719 |
0.03775 |
0.02378 |
24 |
| 2029 |
0.06073 |
0.04247 |
0.03652 |
40 |
| 2030 |
0.05469 |
0.0516 |
0.03405 |
70 |
Huma Finance (HUMA) Professional Investment Strategy and Risk Management Report
IV. HUMA Professional Investment Strategy and Risk Management
HUMA Investment Methodology
(1) Long-term Holding Strategy
- Suitable Investors: Institutional investors, crypto fund managers, and long-term retail investors with high risk tolerance who believe in PayFi ecosystem growth
- Operation Recommendations:
- Accumulate HUMA during market downturns when prices dip below support levels, leveraging the 14.42% 7-day gain momentum
- Hold through market volatility, focusing on the project's PayFi network development and liquidity provision capabilities
- Quarterly portfolio rebalancing to maintain desired allocation percentage based on market conditions
(2) Active Trading Strategy
- Price Action Analysis:
- Current Price Level: $0.03022 with 24-hour trading volume of $510,474.46, providing moderate liquidity for position entry/exit
- Historical Range Reference: All-time high of $0.112 (May 26, 2025) and recent low of $0.00989 (October 10, 2025) establish trading boundaries
- Wave Trading Key Points:
- Monitor the recent 7-day uptrend of +14.42% for continuation signals or reversal patterns
- Identify support at $0.02962 (24-hour low) and resistance at $0.03221 (24-hour high) for tactical entries
HUMA Risk Management Framework
(1) Asset Allocation Principles
- Conservative Investors: 1-3% portfolio allocation
- Active Investors: 3-7% portfolio allocation
- Professional Investors: 7-12% portfolio allocation
(2) Risk Hedging Solutions
- Diversification Strategy: Balance HUMA allocation with other established crypto assets and traditional instruments to reduce single-asset concentration risk
- Position Sizing: Implement stop-loss orders at 15-20% below entry price to limit downside exposure
(3) Secure Storage Solutions
- Hot Wallet Option: Gate.com Web3 Wallet for frequent trading and liquidity management
- Cold Storage Approach: Transfer long-term holdings to air-gapped hardware solutions for enhanced security
- Security Precautions: Enable multi-signature authentication, use hardware security keys, and maintain regular security audits of private keys
V. HUMA Potential Risks and Challenges
HUMA Market Risks
- Liquidity Risk: With 37 exchange listings, HUMA maintains moderate market liquidity, but trading volume concentration may create slippage during large position movements
- Price Volatility: The token experienced an 82.14% decline from ATH ($0.112) to recent lows, indicating extreme price fluctuations typical of emerging PayFi projects
- Market Adoption Risk: PayFi sector maturity remains nascent; widespread adoption failure would directly impact HUMA's utility and valuation
HUMA Regulatory Risks
- Classification Uncertainty: Regulatory classification of payment financing tokens remains ambiguous across jurisdictions, potentially affecting token legality and trading
- Compliance Changes: Future stablecoin and lending protocol regulations could impact Huma Finance's operational framework and token utility
- Geographic Restrictions: Certain jurisdictions may restrict participation in payment financing protocols, limiting addressable market
HUMA Technical Risks
- Blockchain Dependency: HUMA operates on Solana network; any Solana network downtime or security breaches directly compromise HUMA functionality
- Smart Contract Risk: PayFi mechanisms require sophisticated smart contracts; potential vulnerabilities could expose user funds to exploits
- Liquidity Access Risk: The core business model depends on reliable instant liquidity provision; market stress conditions could strain reserve mechanisms
VI. Conclusions and Action Recommendations
HUMA Investment Value Assessment
Huma Finance presents a specialized investment opportunity in the emerging PayFi sector, addressing global payment financing through instant liquidity access. The token's 25.50% monthly appreciation and 14.42% weekly gains demonstrate recent market interest. However, the 82.14% decline from ATH and 24-hour drop of -6.28% highlight extreme volatility. With market cap of $52.38 million (0.0097% market dominance) and 17.33% circulating supply ratio, HUMA remains a relatively illiquid, high-risk emerging asset suitable primarily for speculative and institutional investment portfolios focused on infrastructure diversification.
HUMA Investment Recommendations
✅ Beginners: Start with minimal positions (0.5-1.5% portfolio allocation) through Gate.com, focusing on understanding PayFi mechanisms before scaling. Use educational resources and practice trading with small amounts during high-volatility periods.
✅ Experienced Investors: Execute swing trading strategies based on identified support/resistance levels ($0.02962-$0.03221 range), maintain 3-7% core holdings during favorable market conditions, and actively monitor PayFi ecosystem developments for reallocation signals.
✅ Institutional Investors: Develop diversified HUMA positions (7-12% allocation) with structured entry programs averaging purchases across multiple price levels, implement institutional-grade custody solutions, and participate in community governance discussions to influence protocol development.
HUMA Trading Participation Methods
- Gate.com Direct Trading: Access HUMA spot trading with competitive fees, real-time order matching, and integrated security features
- Dollar-Cost Averaging (DCA): Execute systematic weekly or monthly purchases at fixed investment amounts to reduce timing risk and volatility impact
- Limit Order Strategies: Place orders at key support levels ($0.02962, historical lows) to capture optimal entry points during market corrections
Cryptocurrency investment carries extreme risk. This report does not constitute investment advice. Investors must make decisions based on personal risk tolerance and are strongly advised to consult professional financial advisors. Never invest more capital than you can afford to lose completely.
FAQ
Is HUMA a good buy?
Yes, HUMA demonstrates strong fundamentals and growing adoption in the Web3 ecosystem. With increasing transaction volume and utility expansion, it presents attractive entry opportunities for long-term investors seeking exposure to decentralized finance innovations.
What is the prediction for HUMA stock in 2025?
HUMA is expected to trade between $0.9601 and $1.08 in 2025, with an average price around $1.02 based on current market analysis and recent forecasts.
Is HUMA crypto a good investment?
HUMA crypto shows strong investment potential based on technical analysis and recent performance trends. With solid market momentum and growing adoption in the DeFi space, it presents attractive opportunities for long-term investors seeking exposure to innovative blockchain projects.
What is the price prediction for HUMA Finance in 2030?
Based on current market analysis, HUMA Finance is forecasted to reach approximately $0.25 by early 2030, with potential fluctuations throughout the year. Long-term growth depends on protocol adoption and market conditions.
* The information is not intended to be and does not constitute financial advice or any other recommendation of any sort offered or endorsed by Gate.