The article "2025 IRON Price Prediction" provides an expert analysis of Iron Fish's market trends, focusing on supply-demand dynamics, macroeconomic factors, and potential investment strategies. It addresses issues pertinent to investors interested in privacy-focused blockchain projects, particularly within the context of its price trajectory by 2030. Organized into sections, it covers price history, market sentiment, supply mechanisms, and economic impacts, leading to detailed predictions from 2025 to 2030. This report aids investors in understanding IRON's investment potential and evaluating associated risks, with an emphasis on Gate.com as the primary trading platform.
Introduction: IRON's Market Position and Investment Value
Iron Fish (IRON) is a decentralized, proof of work (PoW) based blockchain project designed to provide strong privacy guarantees for every transaction. Since its launch, Iron Fish has established itself as a censorship-resistant and publicly accessible blockchain solution. As of December 2025, IRON's market capitalization stands at approximately $8.6 million with a circulating supply of approximately 69 million tokens, with prices hovering around $0.1246. This privacy-focused asset is playing an increasingly important role in the blockchain ecosystem's push toward transaction confidentiality and user protection.
This article will comprehensively analyze IRON's price trajectory through 2030, integrating historical patterns, market supply and demand dynamics, ecosystem development, and macroeconomic factors to provide investors with professional price forecasts and practical investment strategies.
Iron Fish (IRON) Market Analysis Report
I. IRON Price History Review and Current Market Status
IRON Historical Price Trajectory
- April 2023: IRON reached its all-time high of $23.5, marking the peak of the token's market performance since launch.
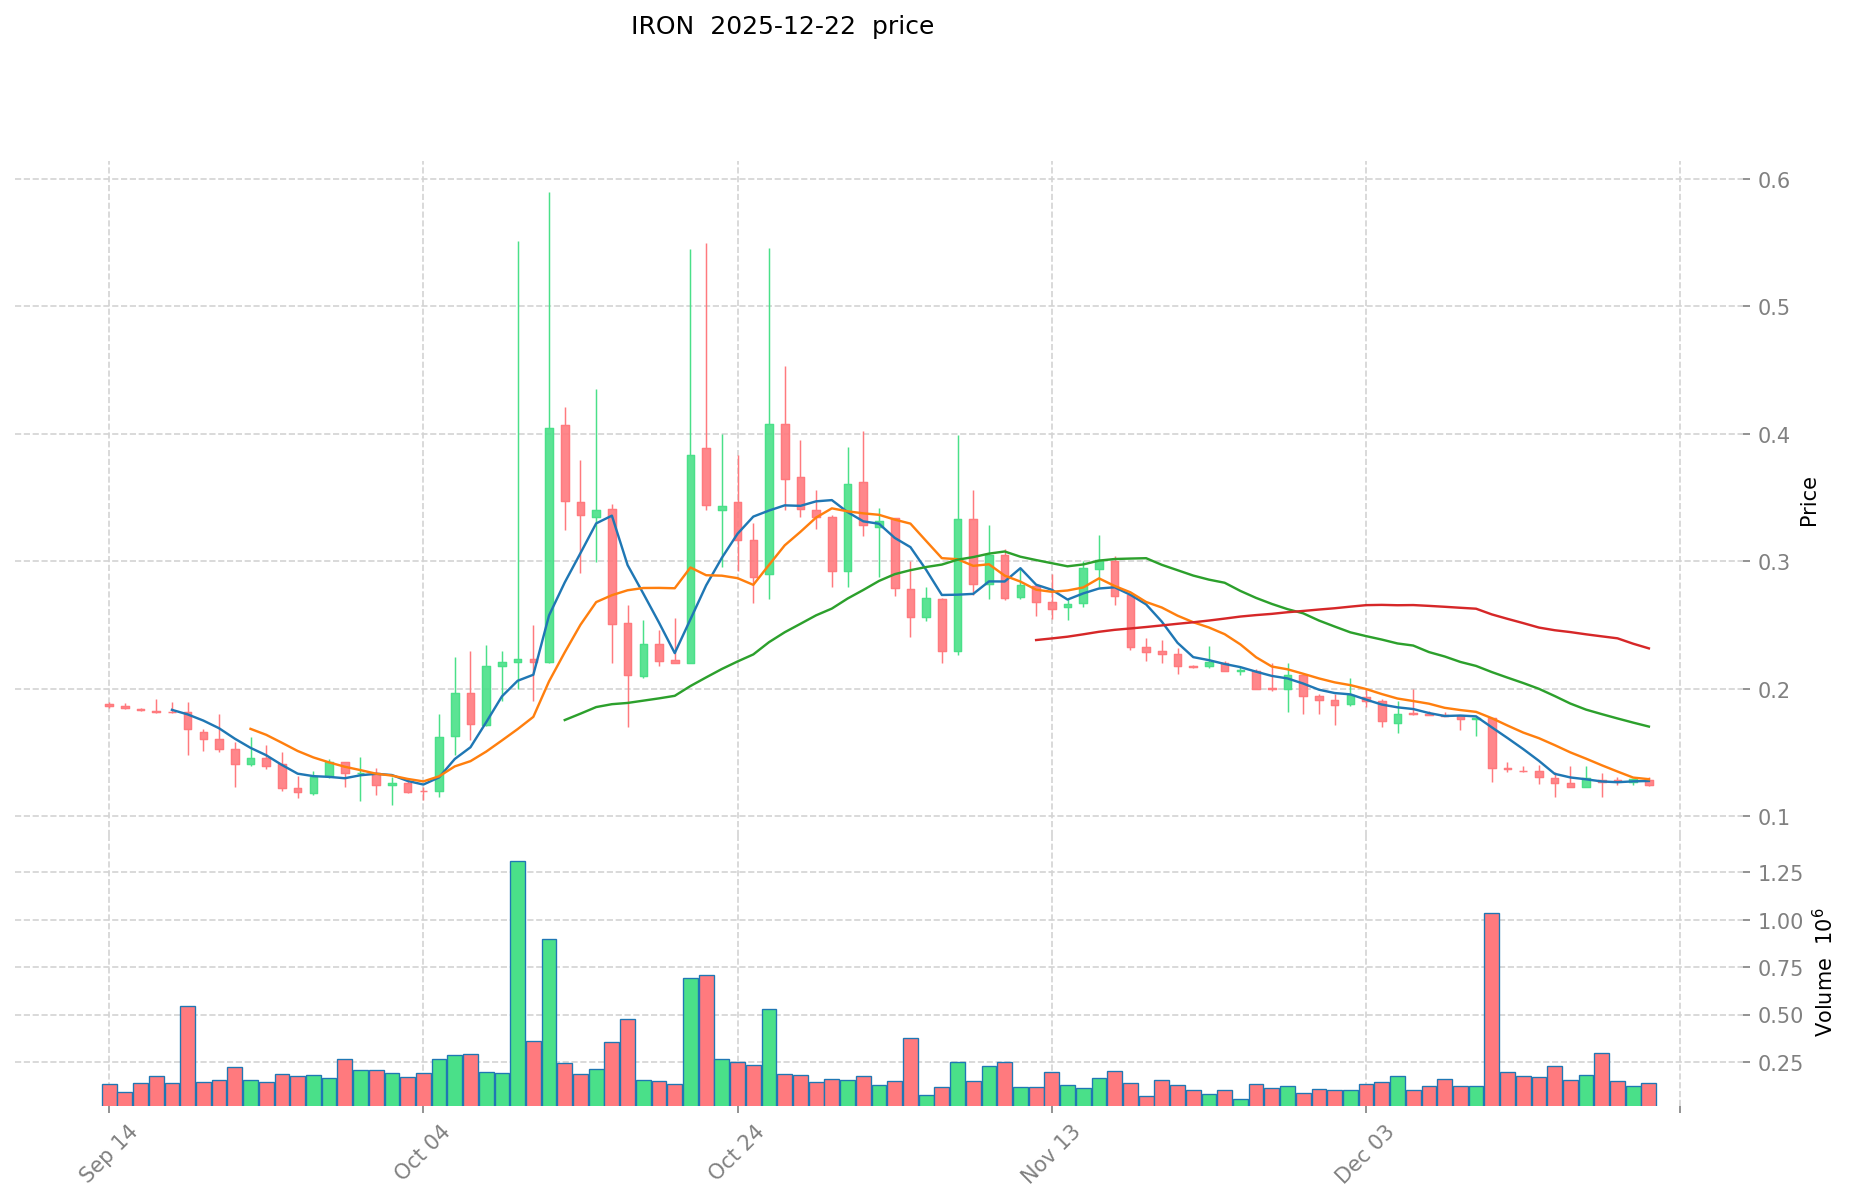
- December 2025: IRON traded at $0.1246, representing a significant decline of approximately 99.47% from its historical high, reflecting the challenging market conditions the token has faced over the past two years.
- March 2025: IRON touched its all-time low of $0.0784, establishing the lowest price point in the token's trading history before recovering slightly in subsequent months.
IRON Current Market Status
As of December 22, 2025, IRON is trading at $0.1246 with a 24-hour trading volume of $15,427.10. The token demonstrates modest positive momentum in the short term, with a 1-hour gain of 0.48% and a 24-hour increase of 0.4%. However, medium to long-term performance remains under pressure, with the token declining 5.03% over the past 7 days, 42.30% over the past 30 days, and 69.93% over the past year.
The fully diluted market capitalization stands at approximately $8.60 million, while the circulating supply comprises 69,003,005.625 IRON tokens out of a total supply of 69,036,355.625 tokens. With a circulating supply ratio of 99.95%, the token distribution is nearly complete. IRON maintains a market dominance of 0.00026%, indicating a relatively small presence within the broader cryptocurrency market. The token is currently trading at 99.95% of its fully diluted valuation, suggesting minimal price premium.
Iron Fish operates as a decentralized, proof-of-work (PoW) based blockchain project designed to provide strong privacy guarantees for every transaction. The project emphasizes censorship resistance and public accessibility as core features of its protocol. Currently, IRON is available for trading on 3 exchanges, with Gate.com being a primary trading venue.
View current IRON market price
IRON Market Sentiment Indicator
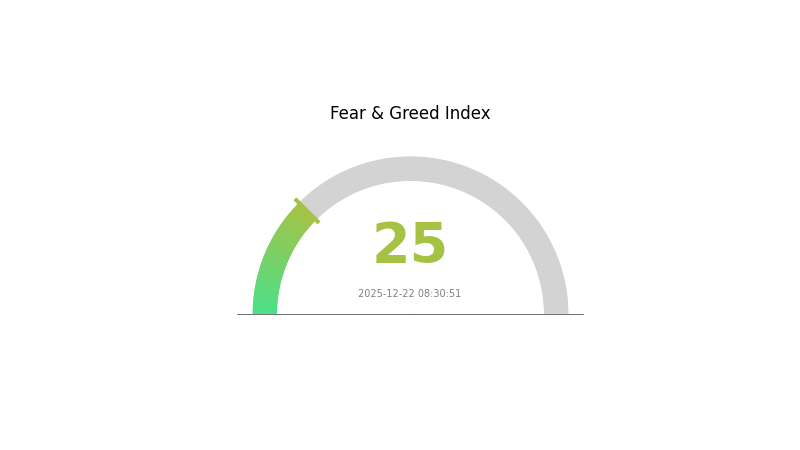
2025-12-22 Fear and Greed Index: 25 (Extreme Fear)
Click to view current Fear & Greed Index
The crypto market is experiencing extreme fear as the Fear and Greed Index hits 25. This indicates significant market pessimism and heightened risk aversion among investors. When fear reaches such extreme levels, it often presents contrarian opportunities for long-term investors. Historical data suggests that periods of extreme fear can precede market reversals. However, exercise caution and conduct thorough research before making investment decisions. Consider dollar-cost averaging strategies to mitigate volatility risks during uncertain market conditions.
IRON Holdings Distribution
The address holdings distribution chart serves as a critical analytical tool for assessing the concentration of token ownership across the blockchain network. By mapping the distribution of IRON tokens among various wallet addresses, this metric provides essential insights into the decentralization characteristics, market structure, and potential vulnerability to price manipulation within the ecosystem.
However, based on the data provided, the holdings distribution table appears to be empty or incomplete, preventing a comprehensive analysis of IRON's current concentration dynamics. Without specific address holdings data, we cannot definitively evaluate whether the token exhibits excessive centralization or assess the degree to which large holders may influence market movements. A robust analysis would require detailed information on the quantity and percentage distribution of tokens held across top addresses, which would allow us to determine concentration ratios and evaluate the token's vulnerability to coordinated selling or price volatility triggered by major stakeholder actions.
To conduct a thorough assessment of IRON's on-chain structure stability and decentralization degree, complete holdings distribution data across leading addresses would be necessary. When such data becomes available, analysts can calculate key metrics such as the Herfindahl-Hirschman Index (HHI) or evaluate the percentage of tokens held by the top 10 or top 100 addresses to determine whether the network exhibits healthy distribution or concerning concentration risks that could undermine long-term market stability and investor confidence.
For current IRON holdings distribution data, visit IRON Holdings Distribution

| Top |
Address |
Holding Qty |
Holding (%) |
Core Factors Influencing IRON's Future Price
Supply Mechanism
-
Global supply trends: Global iron ore supply is expected to continue increasing and may exceed demand growth. In 2026, mainstream mining operations are projected to contribute 12-18 million tons of incremental supply, while non-mainstream mining operations are expected to contribute 40-60 million tons, with total supply increases of 56-87 million tons of iron ore. When accounting for ore grade decline issues, this translates to iron element supply increases of 20-38 million tons.
-
Historical patterns: Supply fluctuations have historically produced significant impacts on iron ore prices. In 2025, global iron ore shipments remained at high levels at 1.568 billion tons, representing a year-on-year increase of approximately 44.9 million tons (2.95% growth).
-
Current impact: The Simandou project in Guinea represents the largest supply variable for 2026, with theoretical annual production capacity of approximately 20 million tons. However, infrastructure challenges including insufficient railway capacity and inefficient port operations may constrain future shipment volumes. Other major contributors include Capanema project from Vale, West Slope project from Rio Tinto, and the Iron Bridge project from FMG.
Macro-economic Environment
-
Monetary policy impact: The U.S. Federal Reserve's monetary policy decisions significantly influence iron ore price movements. Changes in interest rates and currency valuations affect investment flows into commodity markets.
-
Emerging economies demand elasticity: New emerging economies, particularly India and Southeast Asia, are expected to drive substantial incremental demand growth. India plans to increase crude steel production capacity to 300 million tons by 2030 with a clear preference for blast furnace-converter route production, maintaining high growth rates in 2026. Southeast Asian iron production is also projected to show significant growth, with expected incremental production of 12-13 million tons combined with India's 10-11 million tons in 2026.
-
China's export dynamics: China's steel exports reached 108 million tons in January-November 2025, representing 6.7% year-on-year growth. However, the December implementation of export licenses for certain steel products introduces uncertainty regarding 2026 export sustainability, which could impact domestic iron water production levels and iron ore demand.
Supply and Demand Balance Outlook
-
2026 price direction: Iron ore supply surplus is expected to expand, with the price center of gravity shifting downward. The Platts 61% index is projected to operate primarily in the 85-110 USD range, with the price center declining from approximately 100 USD currently to the 90-95 USD range.
-
Key price drivers: The market will continue to center on supply release timing and demand resilience. Port iron ore inventory is expected to accumulate throughout the year. Supply releases are concentrated in the second half, while demand growth remains relatively moderate. Considering seasonal shipment declines in Australia and Brazil during Q1 due to extreme weather impacts, supply-demand contradictions will primarily concentrate in the second half, with Q1 potentially maintaining staged equilibrium.
-
Strategic implications: On a trading basis, the strategy should focus on shorting on rallies. Given new project release timing, emerging economy demand elasticity, and iron ore quality decline issues that create short-term supply-demand tightness, smooth one-way downward price movements are unlikely. Attention should be paid to reducing positions when prices approach the lower end of the range.
Three, 2025-2030 IRON Price Forecast
2025 Outlook
- Conservative Forecast: $0.0735 - $0.0900
- Neutral Forecast: $0.1000 - $0.1246
- Optimistic Forecast: $0.1200 - $0.1333 (requires sustained market interest and positive ecosystem developments)
2026-2027 Mid-term Outlook
- Market Stage Expectation: Consolidation phase with gradual recovery, transitioning from bearish conditions toward stabilization
- Price Range Predictions:
- 2026: $0.0838 - $0.1806
- 2027: $0.1315 - $0.1609
- Key Catalysts: Protocol upgrades, increased adoption on major platforms like Gate.com, improved liquidity conditions, and positive macroeconomic sentiment in the crypto sector
2028-2030 Long-term Outlook
- Base Case Scenario: $0.1326 - $0.1989 (assumes moderate adoption growth and stable market conditions)
- Optimistic Scenario: $0.1588 - $0.1937 (assumes accelerated ecosystem expansion and strong institutional interest)
- Transformation Scenario: $0.1684 - $0.1955 (extreme positive conditions including widespread DeFi integration and significant TVL growth)
- 2030-12-22: IRON reaches $0.1955 (approaching multi-year highs with 45% cumulative gains from current levels)
| 年份 |
预测最高价 |
预测平均价格 |
预测最低价 |
涨跌幅 |
| 2025 |
0.13332 |
0.1246 |
0.07351 |
0 |
| 2026 |
0.18055 |
0.12896 |
0.08382 |
3 |
| 2027 |
0.16094 |
0.15475 |
0.13154 |
24 |
| 2028 |
0.19889 |
0.15785 |
0.13259 |
26 |
| 2029 |
0.18372 |
0.17837 |
0.15875 |
43 |
| 2030 |
0.19553 |
0.18104 |
0.16837 |
45 |
Iron Fish (IRON) Professional Investment Report
IV. IRON Professional Investment Strategy and Risk Management
IRON Investment Methodology
(1) Long-term Holding Strategy
- Suitable for: Privacy-focused investors and blockchain technology enthusiasts who believe in the long-term value of censorship-resistant, privacy-preserving blockchain infrastructure
- Operational recommendations:
- Establish a core position during market downturns, as IRON has experienced significant drawdowns (-69.93% over 1 year)
- Dollar-cost averaging (DCA) strategy to mitigate volatility and reduce timing risk
- Hold through market cycles, recognizing that privacy-focused projects may have extended development and adoption periods
(2) Active Trading Strategy
- Technical analysis tools:
- Support and Resistance Levels: Monitor the current trading range between $0.124 (24h low) and $0.1304 (24h high) for entry and exit points
- Volume Analysis: Track the 24-hour trading volume of $15,427.10 to identify liquidity conditions and potential breakout signals
- Wave trading key points:
- Short-term volatility presents trading opportunities within the established support/resistance framework
- Monitor 7-day and 30-day price trends for momentum confirmation before executing positions
IRON Risk Management Framework
(1) Asset Allocation Principles
- Conservative investors: 1-3% of portfolio allocation, with strong emphasis on long-term holding
- Active investors: 3-5% of portfolio allocation, allowing for opportunistic trading within defined risk parameters
- Professional investors: 5-10% of portfolio allocation, with sophisticated hedging strategies and position management
(2) Risk Hedging Solutions
- Diversification across privacy-focused projects: Balance IRON holdings with exposure to other blockchain security and privacy initiatives to reduce concentration risk
- Stablecoin reserves: Maintain a portion of capital in stablecoins to capitalize on price dips and reduce forced liquidation scenarios
(3) Secure Storage Solutions
- Cold storage approach: For long-term holdings, consider self-custody solutions that support IRON's PoW-based blockchain
- Exchange custody: Gate.com offers IRON trading with institutional-grade security infrastructure for active traders
- Security best practices: Enable two-factor authentication, use hardware security keys, maintain offline backup of recovery phrases, and never share private keys or seed phrases
V. IRON Potential Risks and Challenges
IRON Market Risks
- High volatility: IRON has experienced significant price fluctuation, with a 1-year decline of -69.93%, indicating substantial market risk for capital preservation
- Limited trading liquidity: Available on only 3 exchanges with a 24-hour volume of $15,427.10, suggesting potential liquidity constraints during high-volume trading periods
- Low market capitalization: Market cap of approximately $8.6 million represents relatively small market size compared to established cryptocurrencies, increasing price manipulation risks
IRON Regulatory Risks
- Privacy technology scrutiny: Privacy-focused blockchain projects face potential regulatory challenges in jurisdictions implementing strict anti-money laundering (AML) and know-your-customer (KYC) requirements
- Regulatory uncertainty: Evolving global regulatory frameworks regarding privacy-enhancing technologies could impact adoption and compliance requirements
- Exchange delisting risk: Privacy-focused assets may face pressure from regulatory authorities leading to reduced exchange availability
IRON Technical Risks
- Proof of Work scalability: The PoW consensus mechanism may face limitations in transaction throughput compared to alternative consensus models
- Privacy protocol vulnerabilities: Complex privacy mechanisms carry inherent risks of potential cryptographic vulnerabilities or implementation flaws
- Network adoption challenges: As a specialized privacy-focused blockchain, IRON requires sufficient network effects and developer adoption to justify long-term technical sustainability
VI. Conclusion and Action Recommendations
IRON Investment Value Assessment
Iron Fish presents a specialized value proposition within the privacy-focused blockchain segment. With a focus on censorship resistance and transaction privacy through PoW-based mechanisms, IRON targets a specific market niche. However, the -69.93% one-year price decline, limited liquidity across 3 exchanges, and relatively modest market capitalization of $8.6 million reflect significant adoption and market validation challenges. The project's technical merit in privacy preservation must be weighed against substantial market risks and the competitive landscape of privacy-focused blockchain solutions.
IRON Investment Recommendations
✅ Beginners: Start with minimal allocation (0.5-1%) only if you have strong conviction in privacy-focused blockchain technology; use Gate.com for secure IRON trading with educational resources
✅ Experienced investors: Consider position sizing of 2-5% within a diversified cryptocurrency portfolio; employ technical analysis tools and maintain strict stop-loss discipline; actively monitor regulatory developments affecting privacy-focused projects
✅ Institutional investors: Conduct comprehensive due diligence on protocol security, developer team capabilities, and regulatory compliance; utilize Gate.com's institutional trading services for position management; maintain detailed documentation for compliance and audit purposes
IRON Trading Participation Methods
- Direct spot trading: Purchase and hold IRON directly on Gate.com for long-term investment or short-term trading opportunities
- Systematic buying: Implement dollar-cost averaging strategies through regular purchases to reduce timing risk and average entry prices
- Technical trading: Utilize price swings and volatility patterns within the established trading range for active trading strategies on Gate.com's platform
Cryptocurrency investment carries extreme risk. This report does not constitute investment advice. Investors should make decisions based on their individual risk tolerance and financial situation. Consult with professional financial advisors before making investment decisions. Never invest more than you can afford to lose.
FAQ
Is the iron price expected to rise?
Yes, iron price is expected to rise. Current market trends show sustained upward momentum driven by strong commodity demand and supply constraints. Technical indicators and market dynamics support a bullish outlook.
What is the price of iron in 2025?
Iron prices in 2025 are projected to remain below US$100 per ton. This forecast reflects declining steel production, reduced pig iron demand, and elevated port inventory levels globally.
What will the price of iron ore be in 2025?
Iron ore prices in 2025 are expected to stabilize around $100 per tonne. Market dynamics reflect recent adjustments driven by global supply and demand fundamentals, with potential fluctuations based on economic conditions and production levels.
Will iron prices go down?
Yes, iron prices are expected to decline in 2025 due to weak steel demand, particularly from China, combined with ample supply in the market.
* The information is not intended to be and does not constitute financial advice or any other recommendation of any sort offered or endorsed by Gate.