This comprehensive article provides expert analysis and market forecasts for JST (Justswap Token), a TRON-based DeFi governance token currently trading at $0.04068 with a $402.73 million market cap. The article examines JST's price trajectory from 2026 to 2031, combining historical patterns, market dynamics, and ecosystem developments. Key sections cover JST's historical evolution, current market sentiment showing greed indicators, and detailed price predictions ranging from $0.0353 to $0.0610 across different scenarios. Investors gain practical strategies including long-term holding approaches and active trading techniques, alongside comprehensive risk management frameworks and secure storage solutions via Gate. The article addresses market, regulatory, and technical risks while offering tailored investment recommendations for beginners, experienced traders, and institutional investors participating in TRON's DeFi ecosystem.
Introduction: JST's Market Position and Investment Value
Just (JST), positioned as a dual-token decentralized financial system built on the TRON ecosystem, has been providing stablecoin lending and governance mechanisms since its launch in 2020. As of 2026, JST maintains a market capitalization of approximately $402.73 million, with a circulating supply of 9.9 billion tokens and a price hovering around $0.04068. This asset, designed to establish a fair and transparent financial system, is playing an increasingly important role in decentralized finance applications and stablecoin infrastructure.
This article will comprehensively analyze JST's price trajectory from 2026 to 2031, combining historical patterns, market supply and demand dynamics, ecosystem development, and macroeconomic conditions to provide investors with professional price forecasts and practical investment strategies.
I. JST Price History Review and Market Status
JST Historical Price Evolution Trajectory
- 2020: JST launched in April, with an initial price of $0.002, experiencing significant growth in the early stages of the DeFi ecosystem development
- 2021: Benefited from the overall crypto market bull run, price reached $0.193254 on April 5th, marking a notable appreciation from its launch price
- 2022-2023: Following broader market corrections, price experienced substantial adjustments from previous peaks
- 2024-2025: Price demonstrated relative stability with moderate fluctuations, currently trading at $0.04068
JST Current Market Situation
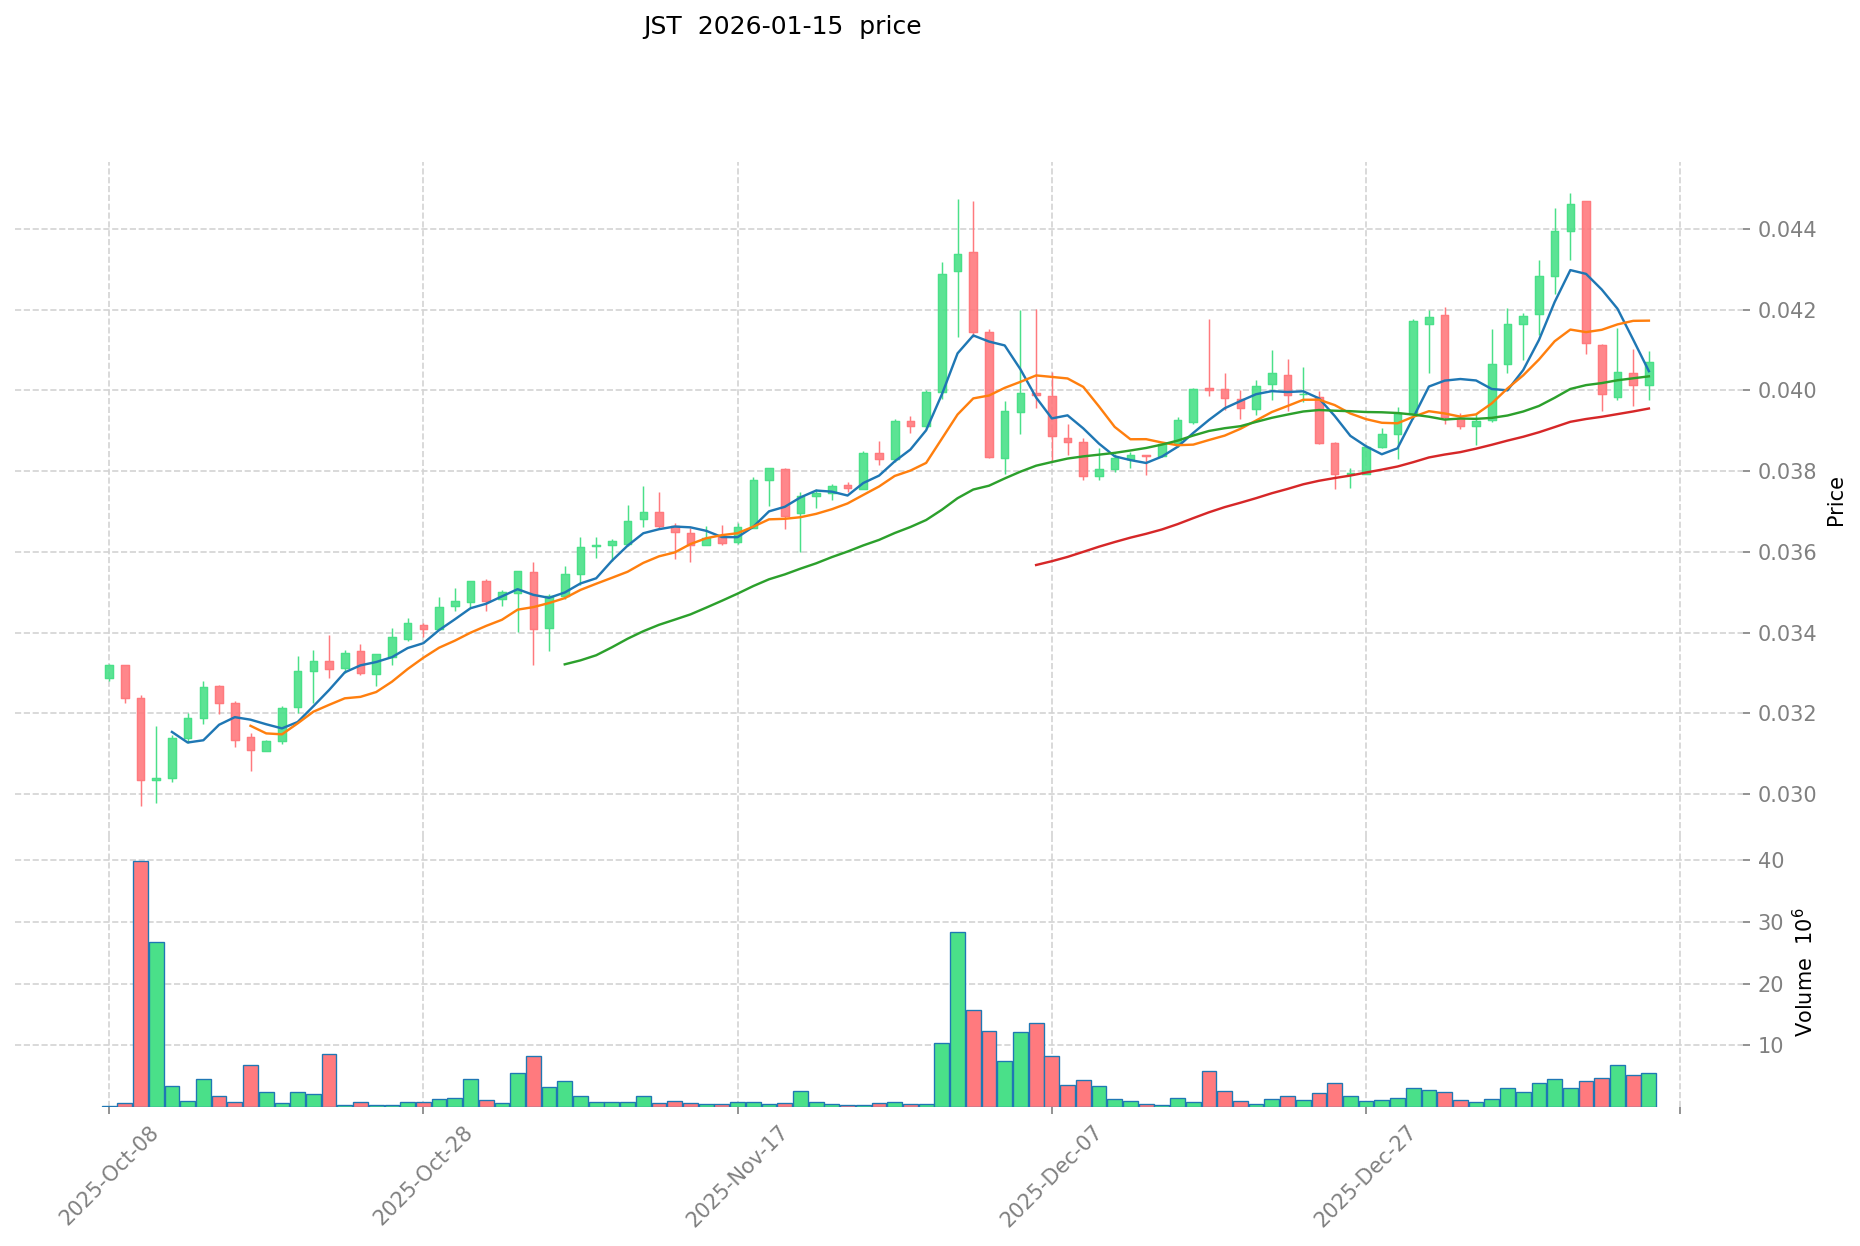
As of January 15, 2026, JST is trading at $0.04068, showing a 24-hour increase of 1.75%. The token's intraday range spans from $0.03976 to $0.04098. Over the past hour, JST has experienced a slight uptick of 0.069%, while the weekly performance indicates a decline of 5.14%. On a monthly basis, JST has gained 3.59%, and the annual perspective shows a positive movement of 6.39%.
The current market capitalization stands at approximately $402.73 million, with JST ranking at position 155 in the overall cryptocurrency market. The 24-hour trading volume reaches $220,118.62, reflecting active market participation. With a fully diluted valuation matching the current market cap at $402.73 million, JST maintains a complete circulation of 9.9 billion tokens, representing 100% of its maximum supply.
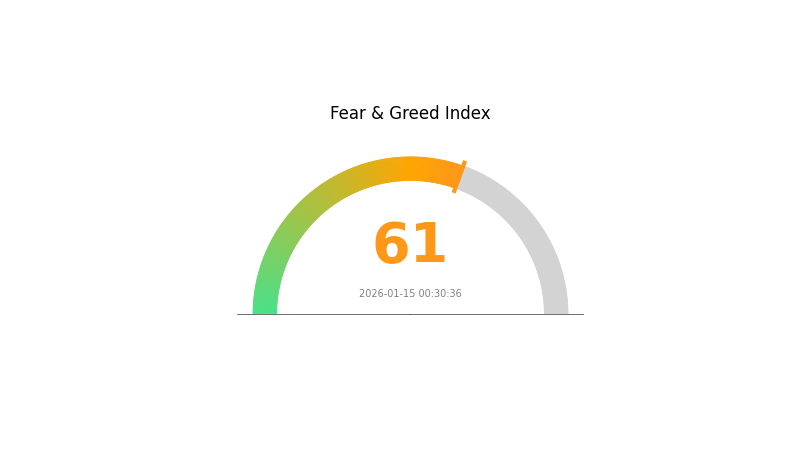
JST holds a market dominance of 0.011%, with the token being listed on 30 exchanges and supported by 440,892 holders. The current market sentiment index indicates a reading of 61, suggesting a "Greed" phase in market psychology.
Click to view current JST market price
JST Market Sentiment Index
2026-01-15 Fear & Greed Index: 61 (Greed)
Click to view the current Fear & Greed Index
The crypto market is currently exhibiting strong greed sentiment with an index reading of 61. This elevated level indicates that market participants are showing optimistic and bullish behavior, with increased risk appetite and buying interest. Investors should remain cautious during periods of high greed, as such conditions often precede market corrections. Diversification and prudent risk management remain essential strategies when market sentiment swings toward excessive optimism.
JST Holding Distribution
The holding distribution chart reflects the concentration of token ownership across different wallet addresses, serving as a key indicator of market structure and potential price manipulation risks. Based on the current data, the top 5 addresses collectively hold approximately 34.62% of the total JST supply, with the largest holder controlling 10.73% (1,063,108.06K JST). The remaining 65.38% is distributed among other addresses, suggesting a relatively moderate level of decentralization compared to many emerging crypto assets.
While the top address holds a significant portion, the distribution pattern indicates that no single entity possesses overwhelming market control. The gradual decline in holdings from the first to the fifth-ranked address (ranging from 10.73% to 4.50%) demonstrates a relatively healthy distribution structure. This configuration reduces the immediate risk of coordinated market manipulation, though large holders still retain the capability to influence short-term price movements through substantial transactions.
From a market stability perspective, this distribution pattern presents both opportunities and risks. The 65.38% held by smaller addresses suggests reasonable retail participation and liquidity diversity, which can help absorb selling pressure during market downturns. However, the concentrated holdings in the top addresses warrant continued monitoring, as coordinated movements by major holders could trigger significant volatility. Overall, JST's current holding structure reflects a moderately decentralized ecosystem with acceptable on-chain stability, though investors should remain aware of concentration risks inherent in the top-tier addresses.
Click to view the current JST Holding Distribution
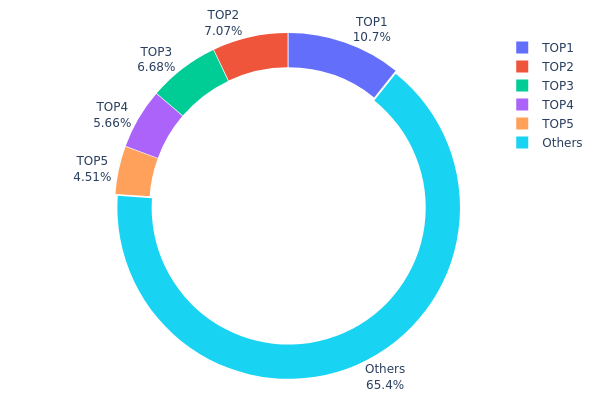
| Top |
Address |
Holding Qty |
Holding (%) |
| 1 |
TT2T17...EWkU9N |
1063108.06K |
10.73% |
| 2 |
TXk9Ln...9M4ZD6 |
700012.15K |
7.07% |
| 3 |
TPyjyZ...kgNan5 |
660882.47K |
6.67% |
| 4 |
T9yD14...HxuWwb |
559891.08K |
5.65% |
| 5 |
TASUAU...F4NKot |
446259.73K |
4.50% |
| - |
Others |
6469846.51K |
65.38% |
II. Core Factors Influencing JST's Future Price
Supply Mechanism
-
Market Demand Dynamics: JST's price performance is closely tied to market demand fluctuations within the DeFi ecosystem. As a token designed to support comprehensive DeFi solutions, its value proposition remains dependent on adoption rates and user engagement across various decentralized finance applications.
-
Current Influence: Trading activity shows moderate engagement, with 24-hour trading volume reaching approximately $21.5 million (¥150.51M), indicating ongoing market interest despite broader market volatility.
Macroeconomic Environment
-
Inflation Impact: Rising inflation presents downward pressure on digital asset valuations. Economic indicators suggest that sustained inflationary trends could negatively affect JST's price trajectory, as observed in broader cryptocurrency market patterns.
-
Regulatory Framework: Regulatory restrictions remain a significant concern for JST's price outlook. Changes in cryptocurrency regulations across major jurisdictions could introduce additional volatility and potentially constrain price appreciation.
-
Overall Economic Conditions: The token's performance remains sensitive to general economic conditions, including investor sentiment, risk appetite, and macroeconomic stability. Market participants should monitor broader financial market trends as they tend to correlate with cryptocurrency valuations.
Technical Development and Ecosystem Building
-
DeFi Integration: JST is positioned to serve diverse DeFi applications, offering comprehensive solutions designed to adapt to various decentralized finance needs. The token's utility within its ecosystem provides fundamental support for its long-term value proposition.
-
Trading Volume Trends: Market activity patterns and trading volume fluctuations serve as important indicators of investor interest and confidence. Recent data shows a modest price increase of 0.56% within a 24-hour period, reflecting relatively stable short-term price action.
III. 2026-2031 JST Price Prediction
2026 Outlook
- Conservative prediction: $0.0353 - $0.0406
- Neutral prediction: Around $0.0406
- Optimistic prediction: Up to $0.0422 (subject to favorable market conditions and increased adoption)
2027-2029 Mid-term Outlook
- Market stage expectation: JST may enter a gradual growth phase as the DeFi ecosystem matures and user adoption potentially expands
- Price range predictions:
- 2027: $0.0244 - $0.0518, with an average around $0.0414
- 2028: $0.0382 - $0.0512, with an average around $0.0466
- 2029: $0.0328 - $0.0548, with an average around $0.0489
- Key catalysts: Platform technological upgrades, expansion of DeFi use cases, broader cryptocurrency market sentiment, and regulatory developments
2030-2031 Long-term Outlook
- Baseline scenario: $0.0311 - $0.0518 (assuming steady ecosystem development and stable market conditions)
- Optimistic scenario: $0.0432 - $0.0610 (assuming significant protocol improvements and increased institutional participation)
- Transformational scenario: Potential to reach $0.0610 (contingent upon mass adoption, major partnerships, and exceptionally favorable regulatory environment)
- 2026-01-15: JST trading within the $0.0353 - $0.0422 range (reflecting current market dynamics)
| Year |
Predicted High Price |
Predicted Average Price |
Predicted Low Price |
Price Change |
| 2026 |
0.04221 |
0.04059 |
0.03531 |
0 |
| 2027 |
0.05175 |
0.0414 |
0.02443 |
1 |
| 2028 |
0.05123 |
0.04658 |
0.03819 |
14 |
| 2029 |
0.05477 |
0.04891 |
0.03277 |
20 |
| 2030 |
0.0534 |
0.05184 |
0.0311 |
27 |
| 2031 |
0.06104 |
0.05262 |
0.04315 |
29 |
IV. JST Professional Investment Strategy and Risk Management
JST Investment Methodology
(I) Long-term Holding Strategy
- Suitable for: Investors seeking stable returns in decentralized finance ecosystems with moderate risk tolerance
- Operational Recommendations:
- Consider accumulating JST during market corrections when the price approaches key support levels
- Monitor the TRON ecosystem development and USDJ stablecoin adoption as fundamental indicators
- Utilize Gate Web3 Wallet for secure long-term storage with backup recovery phrases stored offline
(II) Active Trading Strategy
- Technical Analysis Tools:
- Moving Averages: Use 50-day and 200-day moving averages to identify trend directions and potential entry/exit points
- Volume Analysis: Monitor 24-hour trading volume patterns to confirm price movements and detect potential reversals
- Swing Trading Key Points:
- Set stop-loss orders at 5-8% below entry price to manage downside risk
- Take partial profits during resistance level tests while maintaining core position
JST Risk Management Framework
(I) Asset Allocation Principles
- Conservative Investors: 2-5% of crypto portfolio allocation
- Aggressive Investors: 8-12% of crypto portfolio allocation
- Professional Investors: Up to 15-20% with active hedging strategies
(II) Risk Hedging Solutions
- Portfolio Diversification: Combine JST with major cryptocurrencies and stablecoins to reduce concentration risk
- Position Sizing: Implement gradual entry strategy by dividing capital into multiple tranches
(III) Secure Storage Solutions
- Hot Wallet Recommendation: Gate Web3 Wallet for active trading and DeFi participation
- Cold Storage Solution: Hardware wallet integration for long-term holdings exceeding trading needs
- Security Precautions: Enable two-factor authentication, verify contract addresses before transactions, and avoid sharing private keys
V. JST Potential Risks and Challenges
JST Market Risks
- Price Volatility: JST experienced a 5.14% decline over the past 7 days, demonstrating susceptibility to short-term market fluctuations
- Liquidity Concerns: Trading volume concentration on specific platforms may impact execution during high volatility periods
- Competition Pressure: DeFi stablecoin platforms face increasing competition from established protocols
JST Regulatory Risks
- Stablecoin Regulation: Evolving regulatory frameworks for algorithmic stablecoins may impact USDJ operations
- DeFi Compliance: Potential jurisdiction-specific restrictions on decentralized lending platforms
- Cross-border Transactions: Regulatory uncertainty regarding international crypto asset transfers
JST Technical Risks
- Smart Contract Vulnerabilities: CDP lending platform depends on secure smart contract execution
- Oracle Dependency: Price feed accuracy is essential for collateralization ratios and liquidation mechanisms
- Network Congestion: TRON network performance during high activity periods may affect transaction processing
VI. Conclusion and Action Recommendations
JST Investment Value Assessment
JST presents a specialized opportunity within the TRON-based DeFi ecosystem, offering exposure to stablecoin lending and governance mechanisms. With a current market capitalization of approximately $402.73 million and ranking at 155, the project maintains established positioning while facing ongoing competition. The 100% circulating supply eliminates token unlock concerns, though the significant distance from all-time high suggests recovery potential remains speculative. Short-term volatility persists, while long-term value depends on USDJ adoption and TRON ecosystem growth.
JST Investment Recommendations
✅ Beginners: Start with small position sizes (1-3% of crypto portfolio) and utilize Gate.com educational resources to understand DeFi mechanics before increasing exposure
✅ Experienced Investors: Consider JST as a tactical allocation within diversified DeFi holdings, monitoring TRON ecosystem developments and USDJ stability metrics
✅ Institutional Investors: Evaluate JST within broader stablecoin infrastructure thesis, conducting thorough due diligence on governance mechanisms and platform security audits
JST Trading Participation Methods
- Spot Trading: Access JST through Gate.com with competitive trading pairs and liquidity
- DeFi Integration: Participate in USDJ minting and governance activities through Gate Web3 Wallet
- Dollar-Cost Averaging: Implement systematic accumulation strategy to mitigate entry timing risk
Cryptocurrency investment carries extremely high risk, and this article does not constitute investment advice. Investors should make prudent decisions based on their own risk tolerance and are advised to consult professional financial advisors. Never invest more than you can afford to lose.
FAQ
What is the current price of JST token? What are its historical highest and lowest prices?
JST's historical all-time high is US$0.1933 and all-time low is US$0.004763. Current price fluctuates based on market conditions and real-time trading volume.
What is the price prediction for JST in 2024-2025?
JST price prediction for 2024-2025 may reach $0.11221, influenced by network performance and market trends. However, actual prices may vary due to market volatility and regulatory factors. Continuous market monitoring is recommended for accurate forecasts.
What factors affect JST price movements?
JST price is influenced by TRON ecosystem adoption, DeFi market trends, trading volume, market sentiment, and overall cryptocurrency market conditions. Network growth and protocol developments also impact its value.
What are the advantages of JST compared to other DeFi tokens such as USDC and USDT?
JST offers higher capital efficiency and greater decentralization compared to USDC and USDT. Its hybrid algorithmic stablecoin design provides superior stability and efficiency than traditional centralized stablecoins.
What is the liquidity and trading volume of JST? On which exchanges can it be traded?
JST maintains solid liquidity with consistent trading volume. The token is actively traded on major exchanges with JST/USDT being the most popular trading pair, showing strong daily trading activity and reliable market depth for efficient trading.
What are the risks of investing in JST? How should I evaluate investment risks?
JST investment faces technology, market, funding, management, policy and exit risks. Evaluate by analyzing project technical feasibility, market demand, funding sources, and team capability.
What are the technical team and development roadmap of the JST project?
JST project is led by Japan Science and Technology Agency, focusing on innovation and international cooperation. The roadmap includes enhanced research development, youth tech exchange programs, and expanded global influence in scientific collaboration.
What is the total supply, circulating supply, and tokenomics model of JST token?
JST has a total supply of 9,340,108,920.58 tokens with 9,340,109,000 in circulation. The tokenomics model features a unique distribution structure designed to ensure sustainable long-term growth and ecosystem development.
* The information is not intended to be and does not constitute financial advice or any other recommendation of any sort offered or endorsed by Gate.