This comprehensive guide delivers expert analysis and market forecasts for KAIA, an EVM-based Layer 1 blockchain, covering price projections through 2031 with up to 126% cumulative growth potential. The article examines KAIA's current market position at $0.062 with $363.23M capitalization, analyzes historical price evolution, and evaluates core growth factors including institutional partnerships with Kakao and LINE, regional market expansion, and ecosystem development. Professional investment strategies are provided for different investor profiles, including long-term holding and active trading approaches. The guide establishes a robust risk management framework covering asset allocation, position sizing, and secure storage solutions via Gate exchange and Web3 Wallet. Detailed sections address regulatory risks, technical vulnerabilities, and market volatility considerations. Actionable recommendations guide beginners through institutional investors on optimal KAIA participation methods through spot trading an
Introduction: KAIA's Market Position and Investment Value
Kaia (KAIA), as an EVM-based Layer 1 blockchain prioritizing scalability, convenience, and reliability, has been serving the Web 3.0 ecosystem since its launch in 2019. As of 2026, KAIA maintains a market capitalization of approximately $363.23 million, with a circulating supply of around 5.86 billion tokens, and its price hovering around $0.062. This asset, recognized as a "trusted infrastructure layer connecting global participants", is playing an increasingly important role in blockchain accessibility and Web 3.0 adoption.
This article will comprehensively analyze KAIA's price trends from 2026 to 2031, incorporating historical patterns, market supply-demand dynamics, ecosystem development, and macroeconomic conditions to provide investors with professional price forecasts and practical investment strategies.
I. KAIA Price History Review and Market Status
KAIA Historical Price Evolution Trajectory
- 2019: Launched on September 1, 2019, the project began its initial market journey.
- 2024: Reached a notable price peak of $0.406698 on December 3, 2024, marking a significant milestone in its trading history.
- 2025: Experienced market adjustment, with the price declining to $0.053969 on December 19, 2025.
KAIA Current Market Situation
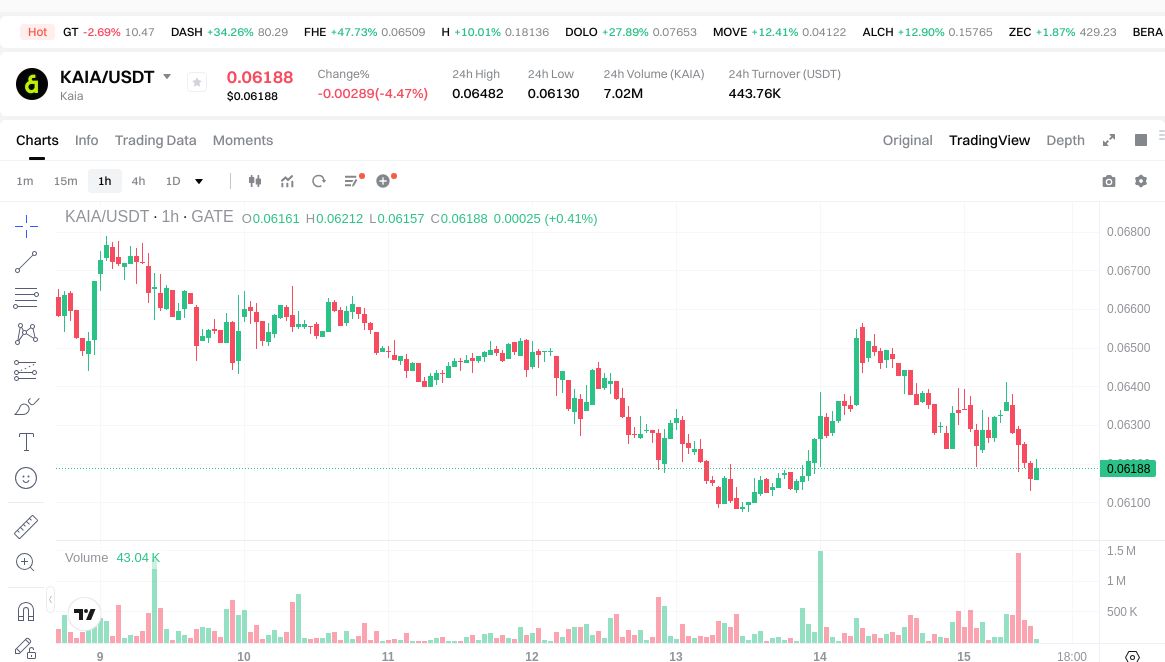
As of January 15, 2026, KAIA is trading at $0.06202, showing a mixed short-term performance. The token has experienced a 0.15% increase over the past hour, indicating some positive momentum. However, the broader trend reveals downward pressure, with a 4.35% decline over the past 24 hours and an 8.70% decrease over the past week.
KAIA's market capitalization stands at approximately $363.23 million, with a circulating supply of 5.86 billion tokens. The token ranks 169th in the cryptocurrency market, holding a market dominance of 0.010%. The 24-hour trading volume reached $444,001.66, reflecting moderate trading activity.
The fully diluted market cap closely aligns with the current market capitalization at approximately $363.23 million, with the circulating supply representing nearly 100% of the total supply. This indicates minimal token inflation pressure from locked or unreleased tokens.
Over the past 30 days, KAIA has declined by 10.19%, while the one-year performance shows a significant contraction of 70.91% from previous levels. The token's 24-hour price range has fluctuated between $0.0613 and $0.06485.
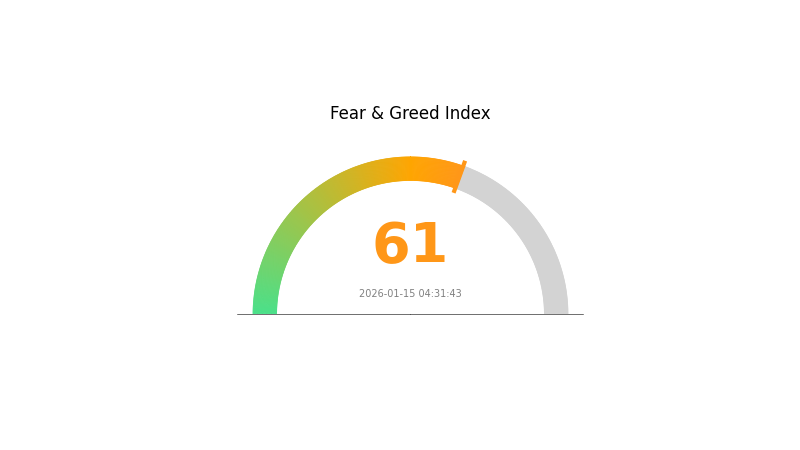
The current market sentiment index stands at 61, indicating a "Greed" phase in the crypto fear and greed index, suggesting that market participants may be displaying optimistic behavior despite recent price corrections.
KAIA is available for trading on 35 cryptocurrency exchanges and has attracted a substantial holder base of approximately 64 million addresses, demonstrating broad community participation and adoption across its ecosystem.
Click to view current KAIA market price
KAIA Market Sentiment Indicator
2026-01-15 Fear and Greed Index: 61 (Greed)
Click to view current Fear & Greed Index
The KAIA market is currently in a greed state with an index reading of 61, indicating strong bullish sentiment among investors. This elevated level suggests market participants are optimistic and willing to take on risk. However, extreme greed can sometimes precede market corrections. Traders should remain cautious and maintain proper risk management strategies. Monitor market developments closely and consider taking profits on strong positions while managing portfolio exposure carefully during periods of heightened market enthusiasm.
KAIA Holding Distribution
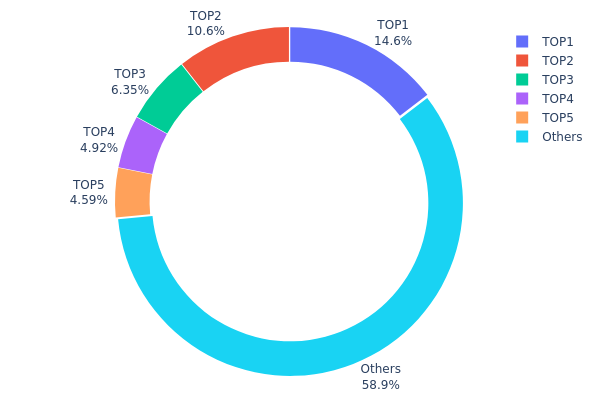
The holding distribution chart provides a visual representation of how KAIA tokens are distributed across different wallet addresses on the blockchain network. This metric is crucial for assessing the degree of decentralization and potential concentration risks within the token ecosystem. By analyzing the percentage of total supply held by top addresses versus smaller holders, investors can gauge the level of centralization and its implications for market dynamics.
According to current data, KAIA exhibits a moderate concentration pattern. The top holder controls approximately 14.59% of the total supply with 907.3 million tokens, while the second-largest address holds 10.61% (660 million tokens). The cumulative holdings of the top five addresses account for 41.08% of the total supply, with the remaining 58.92% distributed among other addresses. This distribution structure suggests that while no single entity possesses overwhelming control, the top addresses collectively maintain significant influence over the token's market behavior.
From a market structure perspective, this concentration level presents both opportunities and risks. The relatively balanced distribution between major holders and the broader community indicates a healthier degree of decentralization compared to projects where a single address holds over 50% of supply. However, the fact that top five addresses control over 40% of tokens means coordinated selling pressure from these entities could trigger substantial price volatility. Additionally, this concentration level provides sufficient liquidity for institutional participation while maintaining enough distribution to support organic market development and resist potential price manipulation attempts.
Click to view current KAIA Holding Distribution
| Top |
Address |
Holding Qty |
Holding (%) |
| 1 |
0x7f59...88f4c7 |
907299.77K |
14.59% |
| 2 |
0xf208...02ae10 |
660000.01K |
10.61% |
| 3 |
0xdc41...d833c6 |
395149.00K |
6.36% |
| 4 |
0xd443...4a6f1f |
305831.48K |
4.92% |
| 5 |
0xdada...b94281 |
285714.29K |
4.60% |
| - |
Others |
3664650.51K |
58.92% |
II. Core Factors Influencing KAIA's Future Price
Supply Mechanism
- Flexible Token Economics: The Kaia blockchain maintains adaptable token economics and governance structures that can evolve based on market conditions and regulatory requirements, rather than adhering to a single fixed model.
- Current Impact: This flexible approach allows KAIA's supply mechanism to respond dynamically to external market factors while maintaining internal stability principles.
Institutional and Major Holder Dynamics
- Strategic Partnerships: Kaia represents a collaborative effort between major Asian communication platforms Kakao and LINE, providing access to hundreds of millions of potential users across Asia.
- Exchange Listings: KAIA has secured listings on multiple platforms, with BitoPro becoming the exclusive Taiwan dollar gateway globally, enabling direct fiat currency access for Taiwanese users through KAIA/USDT and KAIA/TWD trading pairs.
- Regional Policy Framework: The Kaia DLT Foundation aims to build cross-border inclusive financial environments through diversified digital financial services, positioning KAIA as a potential hub for integrating Asian digital currencies.
Macroeconomic Environment
- Regional Market Growth: According to Grand View Research projections, the Korean cryptocurrency market is expected to achieve a compound annual growth rate of 16.1% from 2025 to 2030, with revenue anticipated to grow from 264.3 million dollars in 2024 to 635.4 million dollars by 2030.
- Market Structure Evolution: As the global crypto ecosystem develops, decentralized exchange volumes continue to rise, though centralized platforms still dominate in key Asian markets where KAIA operates.
Technology Development and Ecosystem Building
- Web3 Integration Strategy: The 2025 Kaia chain business strategy shifted focus from underlying technical innovation to user interface integration and real-world asset tokenization, emphasizing practical application over pure technological advancement.
- High-Performance Infrastructure: Kaia chain features high efficiency, fast transaction speeds, and low costs, designed to facilitate cross-border payments and decentralized finance applications across Asia.
- Ecosystem Applications: KAIA serves as the native token within the ecosystem, used for paying on-chain transaction fees (Gas Fees), airdrop rewards, and is positioned to become a core component for cross-border payments and settlement within the Kaia ecosystem. The platform has generated over 38 million wallets, integrated 80+ mini-programs, and maintains daily active addresses between 1 to 1.5 million.
- User Base Expansion: With LINE's penetration rate reaching 93% in Taiwan and strong presence across Asia, Kaia provides a critical pathway for hundreds of millions of users to transition from Web2 to Web3 applications.
III. 2026-2031 KAIA Price Prediction
2026 Outlook
- Conservative Forecast: $0.05826 - $0.06198
- Neutral Forecast: Around $0.06198
- Optimistic Forecast: Up to $0.08429 (requires favorable market conditions and increased adoption)
2027-2029 Outlook
- Market Stage Expectation: Mid-term growth phase with gradual expansion in ecosystem development and user adoption
- Price Range Forecast:
- 2027: $0.03949 - $0.10751, with an average of $0.07314
- 2028: $0.06503 - $0.13097, with an average of $0.09032
- 2029: $0.05975 - $0.15933, with an average of $0.11065
- Key Catalysts: Platform upgrades, strategic partnerships, broader market recovery, and increased DeFi integration
2030-2031 Long-term Outlook
- Baseline Scenario: $0.07964 - $0.14579 in 2030 (assuming steady ecosystem growth and moderate market conditions)
- Optimistic Scenario: $0.08283 - $0.17408 in 2031 (with accelerated adoption and positive regulatory developments)
- Transformative Scenario: Potential to reach upper price bands (under highly favorable conditions including mass adoption and significant technological breakthroughs)
- 2026-01-15: KAIA price predictions suggest a potential cumulative increase of up to 126% by 2031 compared to 2026 baseline levels
| Year |
Predicted High Price |
Predicted Average Price |
Predicted Low Price |
Price Change |
| 2026 |
0.08429 |
0.06198 |
0.05826 |
0 |
| 2027 |
0.10751 |
0.07314 |
0.03949 |
17 |
| 2028 |
0.13097 |
0.09032 |
0.06503 |
45 |
| 2029 |
0.15933 |
0.11065 |
0.05975 |
78 |
| 2030 |
0.14579 |
0.13499 |
0.07964 |
117 |
| 2031 |
0.17408 |
0.14039 |
0.08283 |
126 |
IV. KAIA Professional Investment Strategies and Risk Management
KAIA Investment Methodology
(1) Long-term Holding Strategy
- Suitable for: investors who believe in blockchain infrastructure development and Web 3.0 adoption
- Operational recommendations:
- Consider establishing positions during market corrections when price volatility creates entry opportunities
- Monitor key development milestones and ecosystem growth metrics as indicators of long-term value
- Implement cold storage solutions like Gate Web3 Wallet for secure asset custody
(2) Active Trading Strategy
- Technical analysis tools:
- Moving averages: utilize 50-day and 200-day moving averages to identify potential trend reversals
- Volume analysis: monitor trading volume patterns to confirm price movement validity
- Swing trading considerations:
- Observe support and resistance levels based on recent trading ranges
- Set stop-loss orders to limit downside exposure during volatile periods
KAIA Risk Management Framework
(1) Asset Allocation Principles
- Conservative investors: 1-3% of crypto portfolio allocation
- Aggressive investors: 5-10% of crypto portfolio allocation
- Professional investors: customized allocation based on comprehensive portfolio strategy
(2) Risk Hedging Solutions
- Diversification approach: balance KAIA exposure with established cryptocurrencies and stablecoins
- Position sizing strategy: avoid concentration risk by limiting single-asset exposure
(3) Secure Storage Solutions
- Hot wallet recommendation: Gate Web3 Wallet for convenient access and trading
- Cold storage solution: hardware wallet options for long-term holdings
- Security considerations: enable two-factor authentication, maintain secure backup of recovery phrases, and never share private keys
V. KAIA Potential Risks and Challenges
KAIA Market Risks
- Price volatility: KAIA has experienced significant price fluctuations, with 24-hour changes of -4.35% and 7-day changes of -8.70%
- Liquidity concerns: trading volume and market depth may impact execution during large transactions
- Market sentiment: broader cryptocurrency market trends can influence KAIA price movements regardless of project fundamentals
KAIA Regulatory Risks
- Evolving regulatory landscape: changes in cryptocurrency regulations across different jurisdictions may affect token accessibility
- Compliance requirements: potential regulatory developments could impact blockchain operations and token utility
- Geographic restrictions: varying legal frameworks may limit token availability in certain regions
KAIA Technical Risks
- Smart contract vulnerabilities: despite audits, potential security issues in smart contracts could pose risks
- Network dependencies: as an EVM-based blockchain, reliance on underlying technology infrastructure creates potential points of failure
- Competition risks: increasing competition from other Layer 1 blockchain solutions may affect adoption and market position
VI. Conclusion and Action Recommendations
KAIA Investment Value Assessment
KAIA represents an EVM-compatible Layer 1 blockchain positioned in the competitive Web 3.0 infrastructure space. The project emphasizes scalability, convenience, and reliability, with a focus on accessibility and broader blockchain adoption. Current market performance shows price volatility, with recent declines across multiple timeframes. Long-term value proposition depends on successful ecosystem development and user adoption, while short-term risks include market volatility and competitive pressures from established blockchain platforms.
KAIA Investment Recommendations
✅ Beginners: start with minimal allocation, focus on understanding blockchain technology and market dynamics before significant investment
✅ Experienced investors: consider KAIA as part of a diversified Layer 1 blockchain portfolio, with position sizing aligned to risk tolerance
✅ Institutional investors: conduct thorough due diligence on technical architecture, governance structure, and ecosystem development roadmap
KAIA Trading Participation Methods
- Spot trading: direct purchase and sale of KAIA tokens on Gate.com and other supported exchanges
- Dollar-cost averaging: systematic periodic investments to reduce timing risk and average entry prices
- Portfolio rebalancing: periodic adjustment of KAIA allocation to maintain target portfolio composition
Cryptocurrency investment carries extremely high risk, and this article does not constitute investment advice. Investors should make prudent decisions based on their own risk tolerance and are advised to consult professional financial advisors. Never invest more than you can afford to lose.
FAQ
What is KAIA token? What are its main uses and value sources?
KAIA is a blockchain token merging Web2 social platforms with crypto technology. Its primary use is promoting blockchain adoption among Asian users through daily life applications. Value derives from widespread utility integration and network expansion across the region.
What are the main factors affecting KAIA price?
KAIA price is mainly influenced by enterprise and DApp adoption rates, the number of applications deployed on the platform, transaction activity levels, and the implementation of enterprise-grade solutions. These factors directly determine KAIA's market value.
How to predict KAIA price? What are the common analysis methods?
Common KAIA price prediction methods include technical analysis using indicators like MACD, RSI, and Bollinger Bands to assess short-term trends, and fundamental analysis to evaluate intrinsic value by examining project development, trading volume, and market sentiment.
What advantages does KAIA have compared to other Klaytn ecosystem tokens?
KAIA stands out with strong regulatory compliance in Japan and South Korea, enabling legitimate financial and NFT services. Its regional advantages and stable governance environment build trust in Asian markets, positioning it as a leading Klaytn ecosystem token.
What are the risks to pay attention to when investing in KAIA?
KAIA investments carry liquidation risk if market moves against your position, requiring margin top-ups or position reduction. Market volatility can cause significant losses. Trading execution risk and slippage during high volatility periods should also be considered.
What is the historical price trend of KAIA? What stage is it currently in?
KAIA experienced significant volatility in its trading history. Currently, it is consolidating between 4400-4300 USD, facing short-term resistance. The market is in a consolidation phase with potential for further movement depending on key support and resistance breakouts.
* The information is not intended to be and does not constitute financial advice or any other recommendation of any sort offered or endorsed by Gate.