This comprehensive guide analyzes Loopring (LRC) token's price trajectory from 2026 to 2031, combining historical data and market dynamics. Currently trading at $0.05285 with a $65.85 million market cap, LRC represents a Layer 2 scaling solution with zkRollup technology. The article examines key price drivers including supply mechanisms, institutional activity, macroeconomic conditions, and ecosystem development. Expert forecasts suggest conservative 2026 targets of $0.0491-$0.0528, with long-term potential reaching $0.1222 by 2031 under optimistic scenarios. The guide provides actionable investment strategies for different risk profiles, detailed risk management frameworks, and secure trading methods via Gate.com, helping investors make informed decisions in the evolving DeFi infrastructure space.
Introduction: LRC's Market Position and Investment Value
Loopring (LRC), positioned as a decentralized multi-token trading protocol based on ERC20 and smart contracts, has established itself in the blockchain infrastructure space since its inception in 2017. As of 2026, LRC maintains a market capitalization of approximately $65.85 million with a circulating supply of around 1.246 billion tokens, trading at roughly $0.05285. This asset, recognized for its zkRollup Layer 2 scaling solution, plays an increasingly significant role in enabling secure, trustless token exchanges without asset custody requirements.
This article provides a comprehensive analysis of LRC's price trajectory from 2026 to 2031, combining historical patterns, market supply-demand dynamics, ecosystem development, and macroeconomic conditions to deliver professional price forecasts and practical investment strategies for investors.
I. LRC Price History Review and Market Status
LRC Historical Price Evolution Trajectory
- 2017: Loopring launched in September 2017 with an initial price of $0.053, marking the beginning of its journey in the decentralized exchange protocol space
- 2019: Price reached its historical low point at $0.0196 on December 18, reflecting market challenges during the broader crypto winter period
- 2021: November 10 marked a significant milestone as LRC achieved its all-time high of $3.75, representing substantial growth driven by increased adoption of Layer 2 solutions and decentralized exchange protocols
- 2022-2026: The token experienced considerable correction, with price declining from peak levels as market conditions evolved
LRC Current Market Status
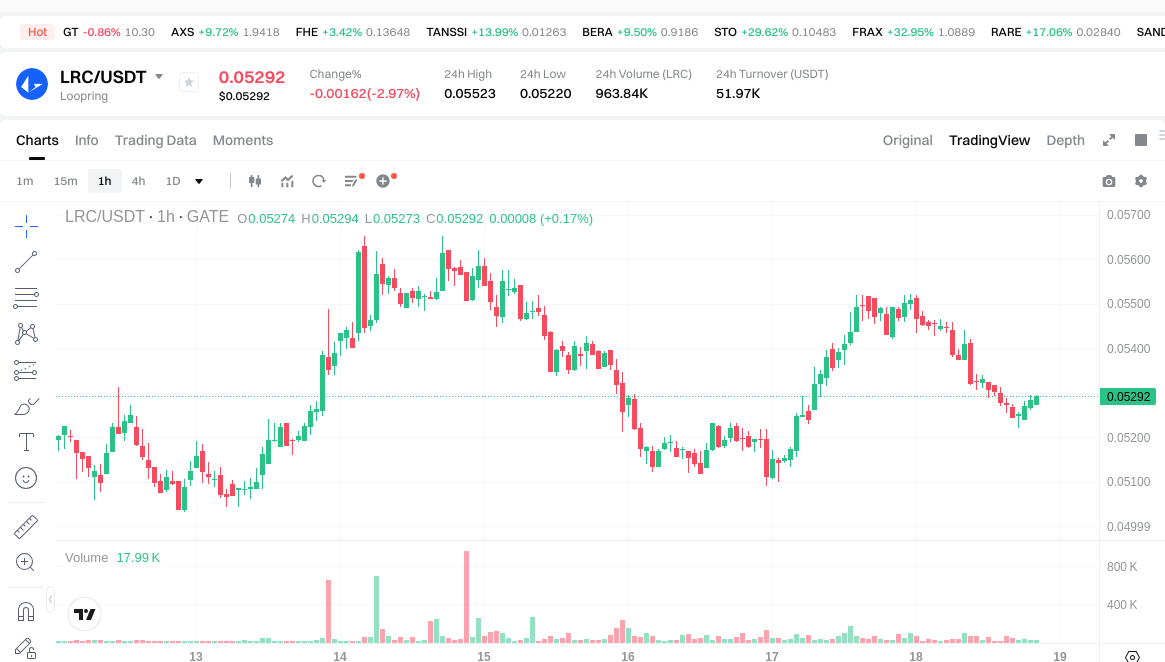
As of January 18, 2026, LRC is trading at $0.05285, showing a 24-hour decline of 2.97% with the price ranging between $0.0522 and $0.05523. The token demonstrates a market capitalization of approximately $65.85 million, with a circulating supply of 1.246 billion tokens representing 90.65% of the total supply of 1.374 billion LRC.
The token maintains a presence across 45 cryptocurrency exchanges and holds 168,754 addresses, indicating sustained community engagement. Over different time horizons, LRC exhibits varied performance: a modest 1-hour decline of 0.02%, a 7-day gain of 1.32%, a 30-day decrease of 6.63%, and a 1-year decline of 75.06%. The fully diluted market capitalization stands at approximately $72.61 million, with the ratio of circulating market cap to fully diluted valuation at 90.65%.
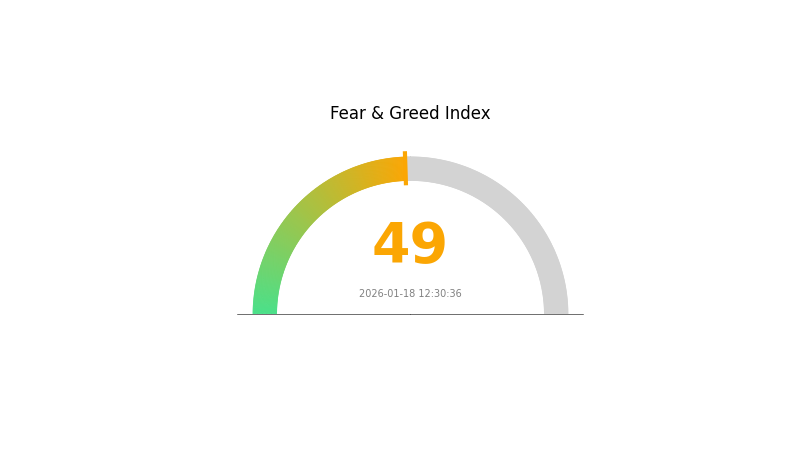
LRC operates as an ERC-20 token on the Ethereum blockchain, with the contract address 0xBBbbCA6A901c926F240b89EacB641d8Aec7AEafD. The current trading volume over 24 hours reached approximately $51,903, while the token maintains a market dominance of 0.0021%. The Gate.com Fear and Greed Index shows a neutral reading of 49, suggesting balanced market sentiment.
Click to view current LRC market price
LRC Market Sentiment Indicator
2026-01-18 Fear and Greed Index: 49 (Neutral)
Click to view current Fear & Greed Index
The LRC market sentiment indicator shows a neutral reading of 49, reflecting balanced market conditions. At this midpoint level, investors are neither driven by excessive fear nor unbridled greed. This balanced sentiment typically suggests a period of consolidation and measured decision-making in the market. Traders should remain vigilant and monitor for potential shifts in sentiment that could indicate emerging trends. A neutral index reading often presents opportunities for strategic positioning, as the market awaits clearer directional signals and fundamental catalysts to drive the next major move.
LRC Holdings Distribution
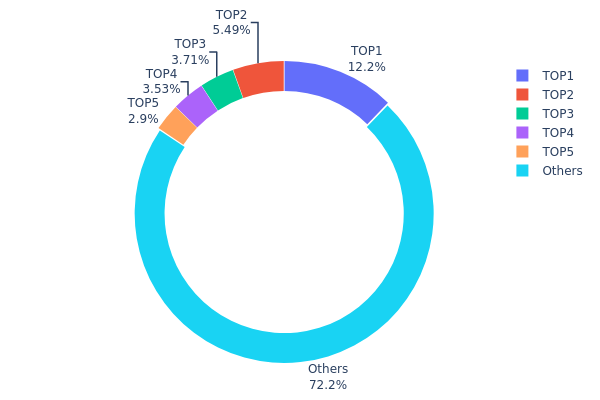
The holdings distribution chart illustrates the allocation of LRC tokens across different wallet addresses, providing insights into the token's decentralization level and concentration risk. According to the latest on-chain data as of January 18, 2026, the top five addresses collectively hold 381,755.68K LRC, accounting for 27.76% of the total supply, while the remaining 72.24% is distributed among other holders.
The current distribution pattern reveals a moderate level of concentration. The largest holder at address 0xf977...41acec controls 12.15% of the supply, followed by the second-largest at 5.49%. While the top holder's share exceeds 10%, this concentration level falls within an acceptable range for established cryptocurrency projects and does not immediately suggest excessive centralization risks. The relatively gradual decline in holdings from the first to the fifth position (12.15% → 5.49% → 3.70% → 3.52% → 2.90%) indicates a reasonably balanced distribution among major stakeholders.
From a market structure perspective, this distribution configuration presents both opportunities and considerations. The majority ownership (72.24%) dispersed among numerous addresses demonstrates healthy decentralization and suggests robust community participation. However, the top holder's significant 12.15% stake warrants monitoring, as large concentrated positions could potentially influence short-term price movements during substantial trading activities. The current structure reflects a relatively mature token economy with established institutional and retail participation, maintaining adequate liquidity while preserving reasonable decentralization characteristics that align with blockchain network security principles.
Click to view the current LRC Holdings Distribution
| Top |
Address |
Holding Qty |
Holding (%) |
| 1 |
0xf977...41acec |
166983.89K |
12.15% |
| 2 |
0x76ec...78fbd3 |
75477.00K |
5.49% |
| 3 |
0x674b...66bd3f |
50967.17K |
3.70% |
| 4 |
0xc368...816880 |
48475.79K |
3.52% |
| 5 |
0x9b0c...ba8d46 |
39851.83K |
2.90% |
| - |
Others |
992117.72K |
72.24% |
II. Core Factors Influencing LRC's Future Price Trajectory
Supply Mechanism
- Governance and Liquidity Incentives: LRC tokens serve dual purposes within the Loopring ecosystem - facilitating protocol governance decisions and providing liquidity mining rewards to network participants. This utility-driven distribution model creates organic demand aligned with protocol usage.
- Historical Patterns: The token's circulation has remained relatively stable since launch, with periodic unlocks balanced by staking mechanisms. Past supply events have shown moderate price sensitivity, particularly during periods of heightened DeFi activity.
- Current Dynamics: As Layer 2 adoption accelerates, the demand for LRC in transaction fee discounts and liquidity provision may intensify, potentially creating upward pressure despite the fixed maximum supply.
Institutional and Whale Activity
- Institutional Holdings: Based on on-chain data, the top five addresses collectively control approximately 16% of circulating supply, with significant concentration in liquidity pools and exchange wallets. This distribution suggests moderate centralization risk.
- Enterprise Integration: Loopring's zkRollup infrastructure has attracted attention from decentralized exchange projects seeking scalable solutions, though specific enterprise partnerships remain limited in public disclosure.
- Regulatory Landscape: The protocol operates within evolving DeFi regulatory frameworks, with increased scrutiny on DEX protocols potentially impacting long-term adoption trajectories.
Macroeconomic Environment
- Monetary Policy Influence: Global central bank policies continue shaping risk appetite for digital assets. Tightening cycles historically correlate with reduced speculative demand for mid-cap DeFi tokens like LRC.
- Inflation Hedge Characteristics: Unlike primary cryptocurrencies, LRC exhibits limited correlation with traditional inflation hedges, functioning more as a growth-oriented tech asset tied to DeFi sector performance.
- Geopolitical Considerations: Cross-border regulatory harmonization efforts and stablecoin legislation may indirectly affect DEX protocol valuations by shaping the broader DeFi operational environment.
Technological Development and Ecosystem Growth
- zkRollup Optimization: Loopring continues enhancing its zero-knowledge proof implementation, targeting transaction throughput improvements and gas cost reductions. These upgrades directly impact user experience and competitive positioning against alternative Layer 2 solutions.
- Cross-Chain Compatibility: Emerging interoperability features aim to extend Loopring's utility beyond Ethereum, potentially expanding addressable market size and trading volume.
- Ecosystem Applications: The protocol supports decentralized exchange functionality with emphasis on non-custodial trading and liquidity provision. Key ecosystem metrics include active market pairs and cumulative trading volume, which serve as leading indicators of protocol health and token utility demand.
III. 2026-2031 LRC Price Forecast
2026 Outlook
- Conservative Forecast: $0.0491 - $0.0528
- Neutral Forecast: Around $0.0528
- Optimistic Forecast: Up to $0.0755 (contingent on favorable market conditions and increased adoption)
2027-2029 Outlook
- Market Stage Expectation: Gradual recovery and consolidation phase with potential upward momentum as the Layer 2 scaling solutions gain broader market acceptance
- Price Range Forecast:
- 2027: $0.0385 - $0.0732, average around $0.0642
- 2028: $0.0433 - $0.0831, average around $0.0687
- 2029: $0.0546 - $0.0956, average around $0.0759
- Key Catalysts: Expansion of decentralized exchange infrastructure, enhanced protocol efficiency, growing institutional interest in Layer 2 technologies, and broader DeFi ecosystem development
2030-2031 Long-term Outlook
- Baseline Scenario: $0.0763 - $0.1037 (assuming steady protocol development and moderate market growth)
- Optimistic Scenario: $0.0881 - $0.1222 (assuming accelerated adoption of Layer 2 solutions and favorable regulatory environment)
- Transformative Scenario: Potentially exceeding $0.1222 (contingent on breakthrough technological advancements and mass market adoption of decentralized trading platforms)
- 2026-01-18: LRC trading within the forecasted range (early consolidation phase)
| Year |
Predicted High Price |
Predicted Average Price |
Predicted Low Price |
Price Change |
| 2026 |
0.07552 |
0.05281 |
0.04911 |
0 |
| 2027 |
0.07315 |
0.06416 |
0.0385 |
21 |
| 2028 |
0.08307 |
0.06866 |
0.04325 |
30 |
| 2029 |
0.09559 |
0.07586 |
0.05462 |
43 |
| 2030 |
0.10373 |
0.08573 |
0.0763 |
62 |
| 2031 |
0.1222 |
0.09473 |
0.0881 |
79 |
IV. LRC Professional Investment Strategies and Risk Management
LRC Investment Methodology
(1) Long-Term Holding Strategy
- Suitable for: Investors seeking exposure to decentralized exchange infrastructure and Layer 2 scaling solutions
- Operational Recommendations:
- Consider accumulating positions during market downturns when LRC trades significantly below historical averages
- Monitor Loopring protocol development milestones and ecosystem growth metrics
- Utilize secure storage solutions such as Gate Web3 Wallet for long-term asset custody
(2) Active Trading Strategy
- Technical Analysis Tools:
- Support and Resistance Levels: Track key price levels including the 24-hour range of $0.0522-$0.05523 to identify potential entry and exit points
- Volume Analysis: Monitor daily trading volume (currently $51,903) relative to historical averages to gauge market interest
- Swing Trading Considerations:
- Consider the recent 7-day price increase of 1.32% against the 30-day decline of 6.63% for short-term positioning
- Set stop-loss orders to manage downside risk given LRC's historical volatility
LRC Risk Management Framework
(1) Asset Allocation Principles
- Conservative Investors: 1-3% of crypto portfolio allocation
- Moderate Investors: 3-5% of crypto portfolio allocation
- Aggressive Investors: 5-10% of crypto portfolio allocation
(2) Risk Hedging Approaches
- Diversification Strategy: Balance LRC holdings with other Layer 2 solutions and established digital assets
- Position Sizing: Scale investments based on market conditions and avoid overexposure to single assets
(3) Secure Storage Solutions
- Hot Wallet Recommendation: Gate Web3 Wallet for convenient trading and staking access
- Cold Storage Option: Hardware wallet solutions for long-term holdings exceeding trading needs
- Security Precautions: Enable two-factor authentication, verify contract addresses (0xBBbbCA6A901c926F240b89EacB641d8Aec7AEafD on Ethereum), and never share private keys
V. LRC Potential Risks and Challenges
LRC Market Risks
- Price Volatility: LRC has declined 75.06% over the past year, demonstrating significant price fluctuations that may continue
- Liquidity Concerns: Current 24-hour trading volume of approximately $51,903 may limit large position entries or exits
- Market Share Position: With a market dominance of 0.0021%, LRC faces competition from larger Layer 2 platforms
LRC Regulatory Risks
- DeFi Regulatory Scrutiny: Evolving regulations around decentralized exchanges may impact Loopring protocol operations
- Compliance Requirements: Potential future regulatory frameworks could affect tokenomics or protocol functionality
- Jurisdictional Variations: Different regional approaches to cryptocurrency regulation may create operational challenges
LRC Technical Risks
- Smart Contract Vulnerabilities: As an ERC-20 token dependent on smart contracts, potential code exploits could affect asset security
- Network Dependency: LRC's reliance on Ethereum infrastructure means network congestion or technical issues could impact functionality
- Protocol Competition: Emergence of alternative Layer 2 solutions and DEX protocols may reduce Loopring's competitive advantages
VI. Conclusion and Action Recommendations
LRC Investment Value Assessment
Loopring (LRC) represents a specialized investment in decentralized exchange infrastructure and Layer 2 scaling technology. With a current price of $0.05285 and market capitalization of approximately $65.85 million, LRC offers exposure to the growing DEX ecosystem. The token has experienced significant price pressure over the past year, trading substantially below its all-time high of $3.75 reached in November 2021. The circulating supply of approximately 1.246 billion tokens represents 90.65% of total supply, indicating limited additional inflation risk. However, investors should carefully weigh the technology's long-term potential against current market conditions and competitive pressures.
LRC Investment Recommendations
✅ Beginners: Start with small allocations (1-2% of crypto portfolio) to understand market dynamics before increasing exposure
✅ Experienced Investors: Consider strategic accumulation during market weakness while maintaining strict position sizing discipline
✅ Institutional Investors: Evaluate Loopring's technology stack and ecosystem development against competing Layer 2 solutions for potential portfolio inclusion
LRC Trading Participation Methods
- Spot Trading: Direct purchase and sale of LRC tokens through centralized platforms like Gate.com
- DCA Strategy: Implement dollar-cost averaging to mitigate timing risk and build positions gradually
- Yield Opportunities: Explore potential staking or liquidity provision options within the Loopring ecosystem
Cryptocurrency investments carry extremely high risks, and this article does not constitute investment advice. Investors should make prudent decisions based on their own risk tolerance and are advised to consult professional financial advisors. Never invest more than you can afford to lose.
FAQ
What is the LRC token price prediction for 2024-2025?
Based on market analysis, LRC is projected to reach approximately $0.07006 in 2025. This forecast considers Loopring's market capitalization and circulating supply dynamics within the DeFi ecosystem.
What are the main factors affecting LRC price?
LRC price is influenced by market supply and demand, Loopring protocol development progress, overall cryptocurrency market performance, trading volume, and network adoption rates.
What is the fundamentals of Loopring project and how does it affect LRC price?
Loopring leverages zero-knowledge rollup technology to enable fast, low-cost transactions on Ethereum. Strong fundamentals including innovative technology, ecosystem development, and governance participation drive LRC price appreciation as the project advances and adoption grows.
How does LRC's price potential compare to other Layer 2 solution tokens?
LRC demonstrates strong price potential driven by Layer 2 adoption and DeFi growth. With superior liquidity and growing trading volume, LRC outperforms many competitors. Market analysis suggests continued upside as Ethereum scaling demand increases significantly.
What are analysts' predictions for LRC's long-term price trend?
Analysts predict LRC could test support at $0.0478 in the short term, with long-term targets around $0.1045. These forecasts are based on technical analysis and market indicators, though actual performance depends on market conditions and adoption developments.
LRC的技术指标和链上数据显示什么信号?
LRC technical indicators show strong signals with 24-hour transaction volume reaching 389 million USD. On-chain data reveals improved liquidity levels, demonstrating increased market activity and positive momentum indicators.
What are the risks of investing in LRC for price prediction trading?
LRC price prediction trading carries high risk due to extreme market volatility. Price swings can cause substantial losses rapidly. Most traders experience significant losses; only a small percentage achieve profits. Trade only with capital you can afford to lose completely.
* The information is not intended to be and does not constitute financial advice or any other recommendation of any sort offered or endorsed by Gate.