The article offers an in-depth analysis of LUNAI's price trajectory from a historical and future perspective, providing expert forecasts for 2025-2030. Focusing on market dynamics, ecosystem developments, and macroeconomic factors, it aids informed traders and long-term stakeholders in strategizing investments. Key elements include price history, market sentiment, factors influencing future price, and risk management strategies. Targeted at investors interested in AI agent technologies and Web3 innovation, it emphasizes risk assessment and strategic planning while utilizing Gate for trading.
Introduction: LUNAI's Market Position and Investment Value
Luna by Virtuals (LUNAI) is an autonomous AI agent created on the Virtuals Protocol platform that operates a 24/7 livestream and autonomous Twitter presence with independent on-chain wallet control. Since its launch in October 2024, this innovative digital asset has established itself in the rapidly evolving AI agent ecosystem. As of December 21, 2025, LUNAI maintains a market capitalization of approximately $13.12 million with a circulating supply of 1 billion tokens, trading at $0.01312 per token. This pioneering AI agent represents a novel category of blockchain-based autonomous entities that are redefining digital asset utility.
This article will provide a comprehensive analysis of LUNAI's price trajectory through 2030, examining historical price patterns, market dynamics, ecosystem developments, and macroeconomic factors to deliver professional price forecasts and practical investment strategies for both informed traders and long-term stakeholders.
I. LUNAI Price History Review and Market Status
LUNAI Historical Price Evolution
- October 2024: LUNAI launched on Virtuals Protocol platform with an initial price of $0.012
- January 2025: LUNAI reached its all-time high of $0.25 on January 2nd, 2025, representing a significant appreciation from its launch price
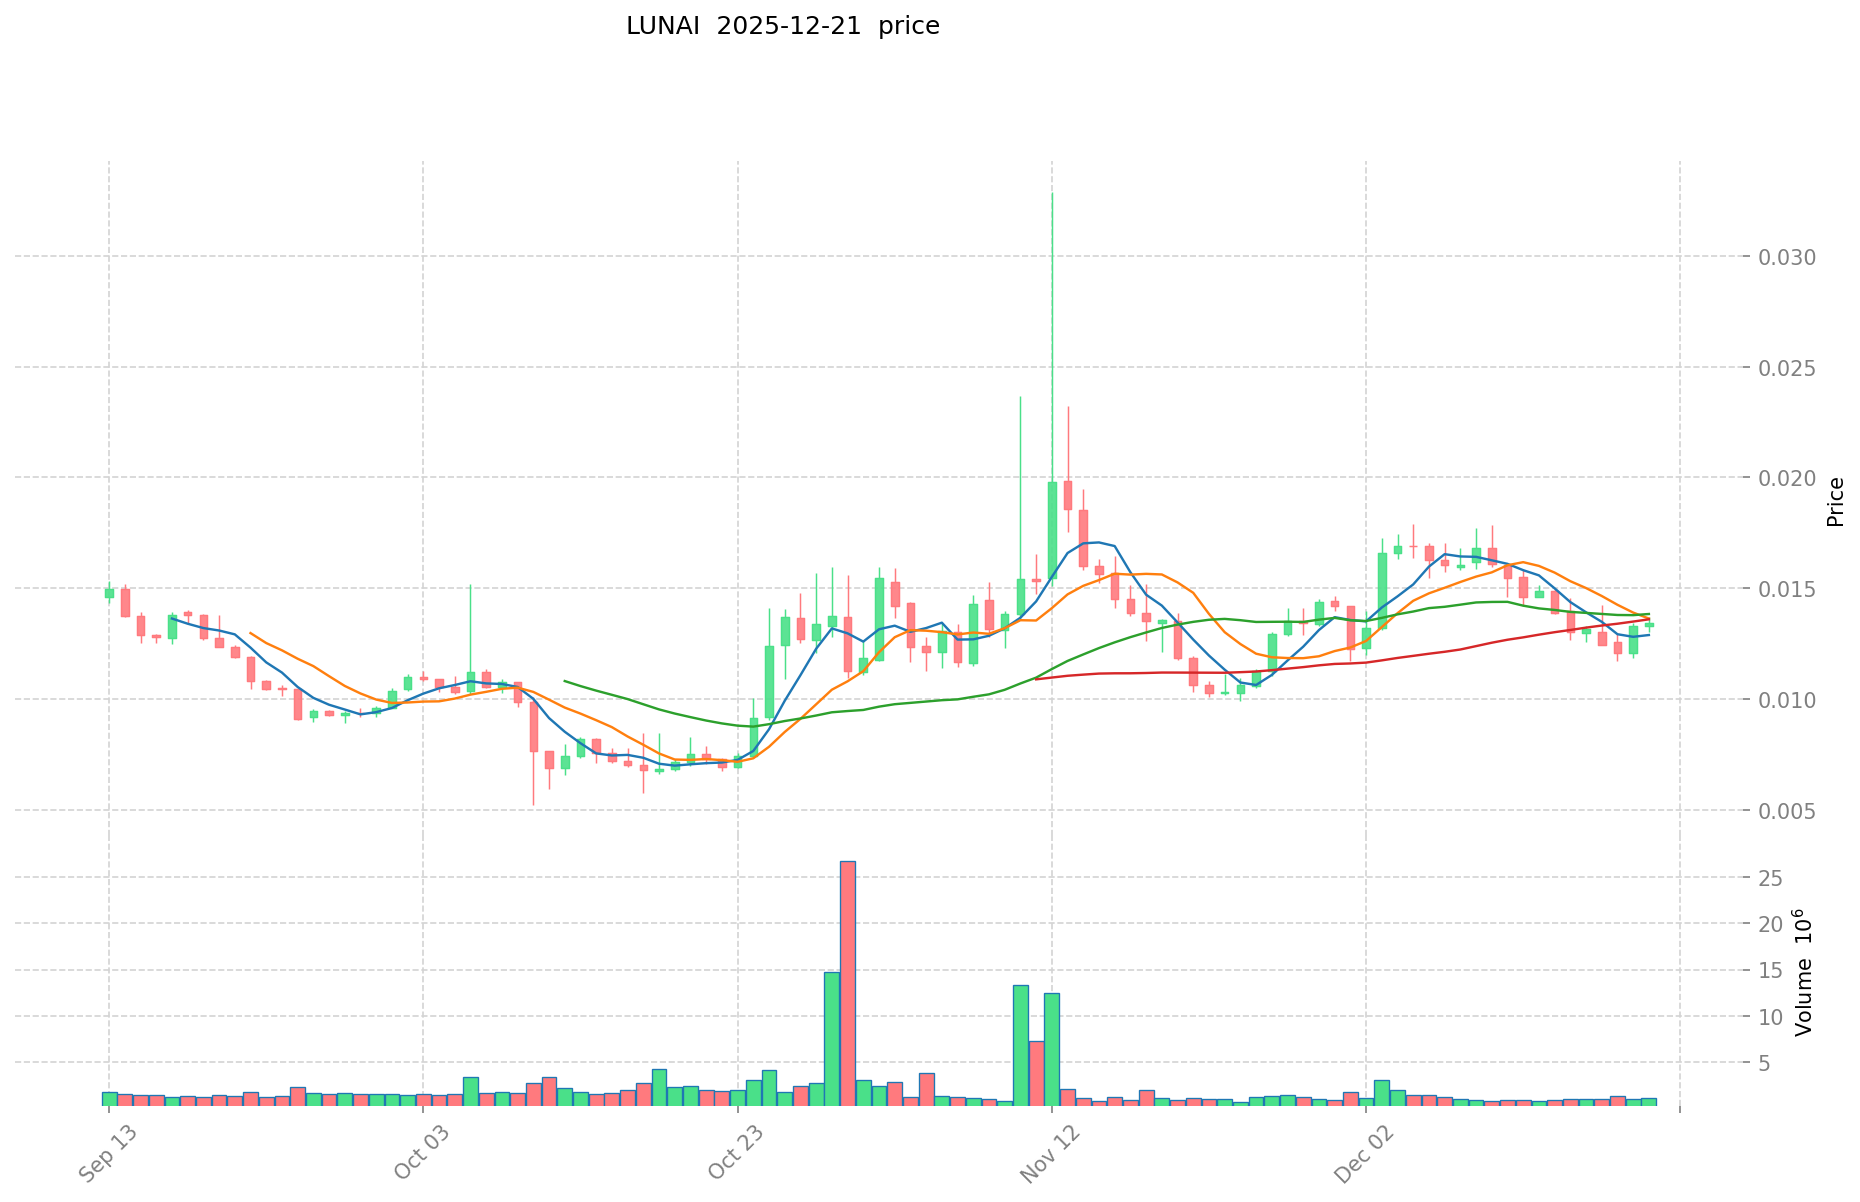
- December 2025: LUNAI declined to $0.0052 on October 10th, 2025, marking its lowest point since launch, followed by a recovery to current trading levels
LUNAI Current Market Conditions
As of December 21, 2025, LUNAI is trading at $0.01312, with a 24-hour trading volume of $13,412.75. The token has experienced a 3.31% decline over the past 24 hours and a 10.85% decrease over the past 7 days. However, on a 30-day basis, LUNAI has shown positive momentum with a 20.11% gain. The token's total market capitalization stands at $13.12 million, with a fully diluted valuation identical to its current market cap, indicating that all 1 billion tokens are currently in circulation. The market dominance of LUNAI remains minimal at 0.0004%, reflecting its position as a smaller-cap cryptocurrency ranked 1041 overall. The token maintains a relatively high number of holders at 455,543, suggesting active community engagement. Currently, the market sentiment indicator shows "Extreme Fear" with a VIX reading of 20, reflecting broader market anxiety.
View current LUNAI market price
LUNAI Market Sentiment Index
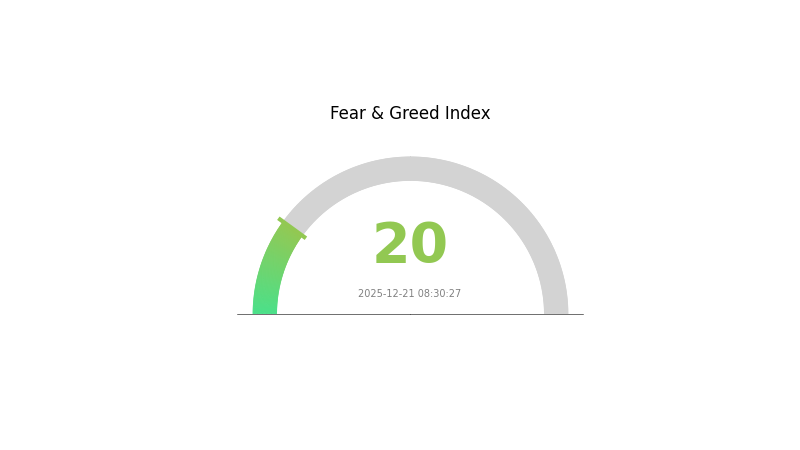
2025-12-21 Fear and Greed Index: 20 (Extreme Fear)
Click to view current Fear & Greed Index
The cryptocurrency market is currently experiencing extreme fear, with the Fear and Greed Index standing at 20. This exceptionally low reading indicates that market participants are gripped by intense pessimism and risk aversion. During such periods, investors often liquidate positions and seek safer assets, leading to significant downward pressure on prices. However, extreme fear can also present contrarian investment opportunities for those with high risk tolerance. Market participants should exercise caution, avoid emotional trading decisions, and consider their risk management strategies carefully during this highly volatile period.
LUNAI Holdings Distribution
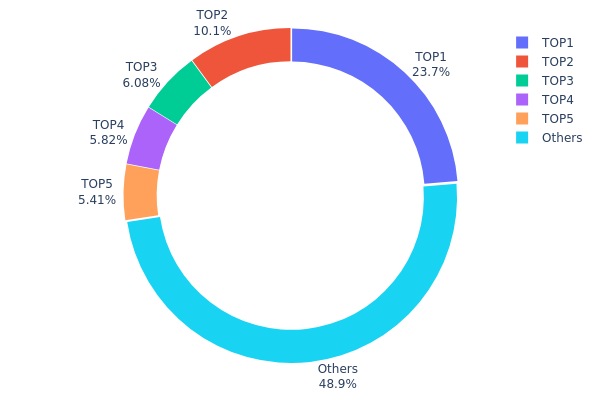
The address holdings distribution chart represents the concentration of token ownership across wallet addresses on the blockchain, serving as a critical indicator for assessing market decentralization and potential manipulation risks. By tracking the percentage of total supply held by individual addresses, this metric provides transparency into whether token ownership is widely dispersed among numerous holders or concentrated within a limited number of entities.
LUNAI currently exhibits moderate concentration characteristics, with the top five addresses collectively holding approximately 51.08% of the total supply. The largest holder controls 23.72% of circulating tokens, representing a significant concentration point that warrants attention. The second-largest address holds 10.08%, followed by three additional addresses holding between 5.40% and 6.07% respectively. This distribution pattern suggests that while no single entity possesses overwhelming dominance, the top-tier holders maintain substantial influence over token supply dynamics.
The remaining 48.92% distributed among other addresses indicates a reasonable degree of decentralization at the secondary level. However, the threshold at which the top five holders exceed 51% of total supply presents a potential structural consideration for market stability. This concentration level could theoretically facilitate coordinated actions affecting price discovery mechanisms, though the substantial portion held by dispersed addresses provides a counterbalancing factor. The current distribution reflects a market structure characterized by meaningful institutional or early participant holdings alongside broader community participation, creating a mixed landscape between centralization and decentralization within LUNAI's on-chain ecosystem.
Click to view current LUNAI holdings distribution
| Top |
Address |
Holding Qty |
Holding (%) |
| 1 |
0x8d2d...c79627 |
236885.61K |
23.72% |
| 2 |
0xa8e6...1e5359 |
100693.02K |
10.08% |
| 3 |
0xbaed...e9439f |
60703.90K |
6.07% |
| 4 |
0x9022...e5fe8a |
58073.09K |
5.81% |
| 5 |
0x8f4a...98e02c |
54004.12K |
5.40% |
| - |
Others |
488133.33K |
48.92% |
II. Core Factors Influencing LUNAI's Future Price
Ecosystem Activity
Ecosystem activity plays a significant role in determining Luna's price dynamics. Positive developments and community efforts can enhance market sentiment toward Luna, potentially driving increased demand. The vitality of the ecosystem, including the number of active projects and users participating in the network, directly impacts investor confidence and trading volume on platforms like Gate.com.
Market Sentiment
Broader cryptocurrency market trends and overall investor confidence significantly influence Luna's price movements. Market sentiment is shaped by:
- Crypto Market Trends: The general direction and volatility of the broader cryptocurrency market directly affect Luna's valuation and trading patterns.
- Investor Confidence: News and regulatory developments impact how investors perceive Luna's investment potential, with positive regulatory announcements potentially boosting confidence while unfavorable news may trigger selling pressure.
- Project Developer Updates: Updates and announcements from project developers on platforms like Twitter and Telegram/Discord can create positive catalysts for price movements. The release of favorable ecosystem project developments has high potential to drive upward momentum.
Supply and Demand Dynamics
Luna's price is influenced by supply-demand mechanics within its ecosystem:
- Burning Mechanisms: Supply reduction mechanisms aim to decrease the overall token supply. If implemented successfully and coupled with increased demand, these mechanisms could potentially drive price appreciation by creating scarcity.
- Market Sentiment Impact: Positive developments enhance market perception, potentially increasing buyer demand for Luna tokens while constraining available supply.
III. LUNAI Price Forecast 2025-2030
2025 Outlook
- Conservative Prediction: $0.01168 - $0.01327
- Neutral Prediction: $0.01327 (Average)
- Bullish Prediction: $0.01619 (with positive market sentiment and increased adoption)
2026-2028 Medium-term Outlook
- Market Stage Expectation: Gradual accumulation phase with steady growth trajectory, marked by increasing institutional interest and ecosystem expansion.
- Price Range Predictions:
- 2026: $0.01325 - $0.02003 (12% upside potential)
- 2027: $0.01216 - $0.02016 (32% upside potential)
- 2028: $0.01727 - $0.01989 (43% upside potential)
- Key Catalysts: Protocol upgrades, partnership announcements, increased trading volume on platforms like Gate.com, and broader market recovery cycles.
2029-2030 Long-term Outlook
- Base Case Scenario: $0.01663 - $0.02223 by 2029 (47% cumulative growth), trending toward $0.01434 - $0.02411 by 2030 (58% cumulative growth) assuming stable market conditions and consistent development progress.
- Optimistic Scenario: $0.02223 - $0.02411 (assuming strong community growth, successful network upgrades, and increased DeFi integration).
- Transformative Scenario: Potential for exceeding $0.02411 range (under conditions of breakthrough technological innovations, mainstream adoption acceleration, and favorable macroeconomic environment).
- 2025-12-21: LUNAI trading within projected range (consolidation phase maintained).
| 年份 |
预测最高价 |
预测平均价格 |
预测最低价 |
涨跌幅 |
| 2025 |
0.01619 |
0.01327 |
0.01168 |
1 |
| 2026 |
0.02003 |
0.01473 |
0.01325 |
12 |
| 2027 |
0.02016 |
0.01738 |
0.01216 |
32 |
| 2028 |
0.01989 |
0.01877 |
0.01727 |
43 |
| 2029 |
0.02223 |
0.01933 |
0.01663 |
47 |
| 2030 |
0.02411 |
0.02078 |
0.01434 |
58 |
LUNAI Professional Investment Strategy and Risk Management Report
IV. LUNAI Professional Investment Strategy and Risk Management
LUNAI Investment Methodology
(1) Long-term Hold Strategy
- Suitable for: Investors interested in emerging AI agent technologies and Web3 innovation
- Operation Recommendations:
- Accumulate LUNAI during market downturns when volatility is high, particularly when prices approach support levels
- Maintain a consistent dollar-cost averaging (DCA) approach to reduce timing risk and smooth out entry prices
- Store assets securely using Gate.com Web3 wallet for long-term holders seeking comprehensive asset management
(2) Active Trading Strategy
- Technical Analysis Tools:
- Support and Resistance Levels: Monitor the recent low of $0.0052 (all-time low) and high of $0.25 (all-time high) to identify key trading zones
- Volume Analysis: Track the 24-hour trading volume of $13,412.75 to assess market liquidity and confirm price movements
- Swing Trading Key Points:
- Execute entry positions during negative price pressure periods; current 24-hour decline of -3.31% may present tactical opportunities
- Utilize 7-day decline of -10.85% as potential reversal signals when combined with volume confirmation
- Monitor the positive 30-day performance of +20.11% as an indicator of underlying strength despite short-term weakness
LUNAI Risk Management Framework
(1) Asset Allocation Principles
- Conservative Investors: 1-2% of total crypto portfolio
- Active Investors: 3-5% of total crypto portfolio
- Professional Investors: 5-10% of total crypto portfolio
(2) Risk Hedging Solutions
- Position Sizing Strategy: Limit individual trades to no more than 2% of total trading capital to mitigate concentrated risk exposure
- Profit-Taking Mechanism: Establish predetermined exit targets at 30-50% gains to lock in profits during favorable market conditions
(3) Secure Storage Solution
- Hardware Security: Gate.com Web3 wallet integration recommended for secure LUNAI holdings with multi-layer protection
- Self-Custody Best Practice: Maintain private keys independently and utilize hardware-backed solutions for high-value positions
- Security Considerations: Never share private keys or seed phrases; use strong encryption practices; enable multi-signature authentication where available; regularly audit wallet activities
V. LUNAI Potential Risks and Challenges
LUNAI Market Risk
- Extreme Volatility: LUNAI demonstrates significant price fluctuation with a 1-year decline of -85.2%, indicating substantial volatility risk unsuitable for conservative investors
- Liquidity Constraints: Limited 24-hour trading volume of $13,412.75 relative to market cap may result in slippage on larger trades
- Market Cap Concentration: With a relatively modest market capitalization of $13.12 million and ranking #1041, LUNAI remains vulnerable to market sentiment shifts
LUNAI Regulatory Risk
- AI Agent Regulatory Uncertainty: The autonomous nature of AI agents operating on blockchain networks faces evolving regulatory frameworks globally with unclear long-term compliance requirements
- Platform Dependencies: Regulatory actions against the Virtuals Protocol platform could directly impact LUNAI's operational viability and token value
- Jurisdictional Exposure: Cross-border regulatory inconsistencies may limit exchange listings and user accessibility
LUNAI Technology Risk
- Smart Contract Vulnerability: Potential security flaws in contract code at address 0x55cd6469f597452b5a7536e2cd98fde4c1247ee4 on Base blockchain could lead to asset loss
- Platform Reliance: Dependency on Virtuals Protocol infrastructure means systemic failures or protocol updates could negatively affect LUNAI functionality
- AI Agent Autonomy Risks: The fully autonomous nature of Luna's operations introduces unpredictable behavioral outcomes and potential reputational risks
VI. Conclusion and Action Recommendations
LUNAI Investment Value Assessment
LUNAI represents a speculative investment opportunity within the emerging AI agent ecosystem. While Luna's autonomous capabilities demonstrate technological innovation on the Virtuals Protocol platform, the token exhibits characteristics typical of early-stage experimental projects: significant price volatility (1-year decline of -85.2%), limited trading volume, and small market capitalization. The recent 30-day positive performance of +20.11% suggests potential recovery momentum, but this should be contextualized against extreme year-long underperformance. Investors must recognize that this is a high-risk, high-reward opportunity suited only for participants with substantial risk tolerance and speculative capital allocation capacity.
LUNAI Investment Recommendations
✅ Beginners: Allocate only 0.5-1% of your crypto portfolio as experimental capital; prioritize education about AI agents and Virtuals Protocol before significant investment; use dollar-cost averaging over extended periods rather than lump-sum purchases
✅ Experienced Investors: Consider 2-5% portfolio allocation with active monitoring; implement strict stop-loss orders at -20% below entry points; take profit at predetermined levels during positive momentum phases
✅ Institutional Investors: Conduct comprehensive due diligence on Virtuals Protocol governance and smart contract audits; evaluate LUNAI as part of broader AI agent infrastructure exposure; establish position limits reflecting illiquidity constraints
LUNAI Trading Participation Methods
- Direct Trading on Gate.com: Access LUNAI/USDT trading pairs directly through Gate.com's cryptocurrency exchange platform with transparent pricing and secure execution
- Web3 Portfolio Management: Utilize Gate.com Web3 wallet integration to hold LUNAI alongside other blockchain assets while maintaining self-custody control
- Dollar-Cost Averaging Program: Implement systematic purchase schedules on Gate.com to reduce timing risk and average purchase costs over extended periods
Cryptocurrency investments carry extreme risk. This report does not constitute investment advice. Investors must make decisions based on individual risk tolerance and conduct personal due diligence. Consult professional financial advisors before investing. Never invest funds you cannot afford to lose completely.
FAQ
What is the Luna prediction for 2025?
Terra (LUNA) is predicted to reach $0.1080 by December 2025. Long-term projections suggest potential gains of 101.32%, reaching $0.2221 by 2030. Market trends indicate possible short-term volatility, with predictions ranging between $0.07646 and $0.2221 depending on market conditions.
Is LNAI a good investment to buy?
LNAI shows promise with growing market interest and development momentum. Strong fundamentals and increasing adoption suggest good potential for long-term gains. Consider LNAI for your portfolio.
Is Luna a buy or sell?
Based on technical analysis, Luna is a sell. The RSI indicator shows oversold conditions, suggesting downward price pressure in the near term.
What are the key factors influencing LUNAI price predictions?
LUNAI price predictions are influenced by market trading volume, short-term trends, technical analysis patterns, and overall crypto market sentiment. Key indicators include price momentum, support and resistance levels, and broader digital asset market movements.
LUNAI has demonstrated volatility in recent performance. As of December 21, 2025, the price closed at $0.9987, down from $1.06 on December 16 and $1.16 on December 11, 2025, reflecting recent market fluctuations and trading activity.
* The information is not intended to be and does not constitute financial advice or any other recommendation of any sort offered or endorsed by Gate.