This comprehensive analysis examines Magic Eden (ME) token's market position and growth trajectory through 2031. Currently trading at $0.2217 with a $95 million market cap, ME serves as the largest NFT marketplace and Runes platform across multiple blockchains. The article addresses investor concerns through detailed price forecasts ($0.1553-$0.4890 range), ecosystem development analysis, and institutional adoption trends. Key sections cover historical performance patterns, macroeconomic influences, and technical infrastructure drivers. Professional investment strategies include dollar-cost averaging approaches and portfolio allocation recommendations for different investor profiles. The analysis integrates supply-demand dynamics, token holder distribution insights, and risk management frameworks, providing both novice and experienced traders with actionable intelligence on Gate trading platform for navigating ME's high-volatility market environment.
Introduction: ME's Market Position and Investment Value
Magic Eden (ME), positioned as the largest NFT marketplace and Runes platform, has established itself as a significant player in the multi-chain ecosystem since its inception. As of January 2026, ME maintains a market capitalization of approximately $95.05 million, with a circulating supply of around 428.72 million tokens, and the price hovering around $0.2217. This asset, recognized as a cross-chain ecosystem enabler, is playing an increasingly important role in facilitating seamless multi-chain asset trading through its mobile wallet solution.
This article will comprehensively analyze ME's price trajectory from 2026 to 2031, combining historical patterns, market supply-demand dynamics, ecosystem development, and macroeconomic factors to provide investors with professional price forecasting and practical investment strategies.
I. ME Price History Review and Market Status
ME Historical Price Evolution Trajectory
- December 2024: Magic Eden launched its native token ME with an initial listing price of $7.5, experiencing significant volatility in its early trading phase
- December 2024: Price reached a notable peak of $30 on December 10, 2024, reflecting strong initial market enthusiasm for the cross-chain NFT marketplace platform
- October 2025 to Present: Market sentiment shifted, with price declining from historical highs to $0.1538 on October 10, 2025, marking the lowest recorded level
ME Current Market Status
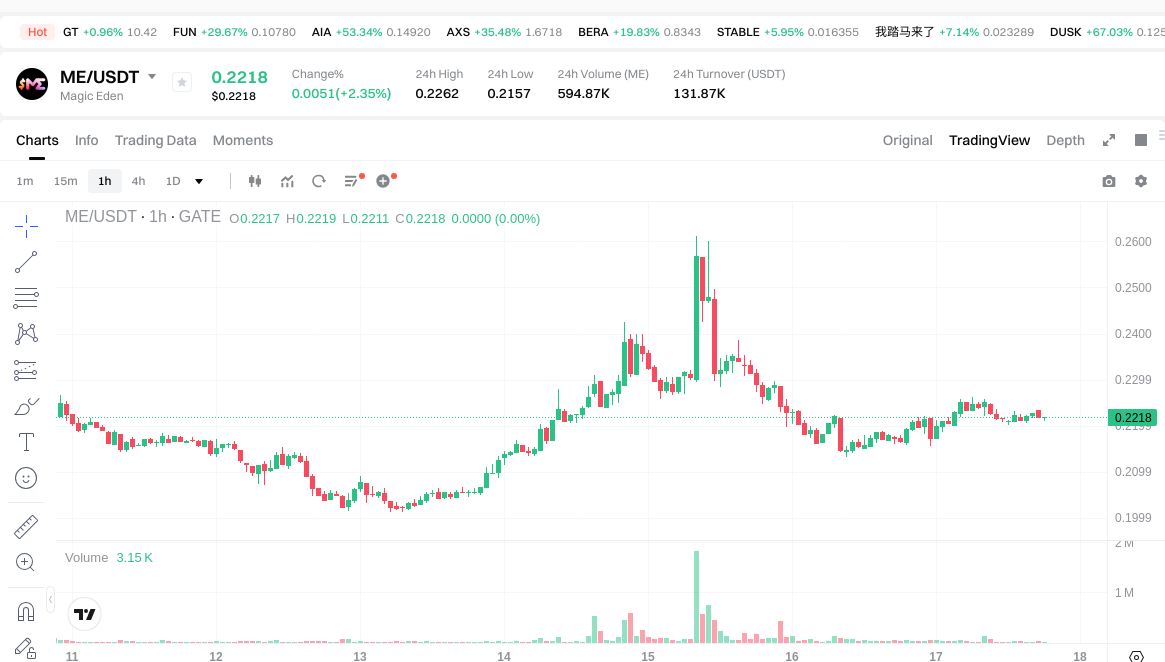
As of January 17, 2026, ME is trading at $0.2217, representing a 2.11% increase over the past 24 hours. The token has shown mixed short-term performance, with a slight decline of 0.44% in the past hour but maintaining positive momentum over the weekly timeframe with a 1.23% gain. The 30-day performance indicates a 3.26% increase, though the annual perspective reveals a substantial decline of 91.38% from its initial valuation.
The 24-hour trading range has been relatively contained between $0.2157 and $0.2262, suggesting moderate price stability in recent sessions. Trading volume over the past day reached approximately $132,667, while the circulating market capitalization stands at $95,047,502, representing 42.87% of the fully diluted valuation of $221,700,000. With 428,721,254 tokens in circulation out of a maximum supply of 1 billion, and a holder base of 152,382 addresses, ME maintains its position as a significant player in the cross-chain NFT marketplace sector. The market sentiment indicator currently reads at a neutral level of 50, reflecting balanced investor positioning.
Click to view current ME market price
ME Market Sentiment Index
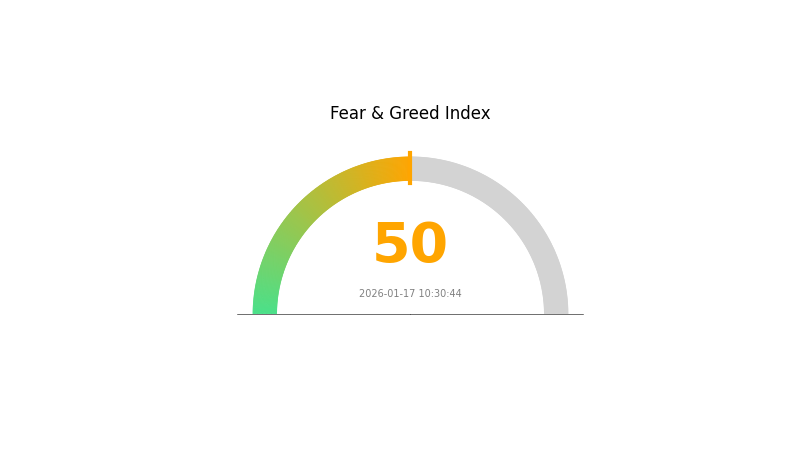
2026-01-17 Fear and Greed Index: 50 (Neutral)
Click to view the current Fear & Greed Index
The crypto market is currently in a neutral sentiment state with the Fear and Greed Index at 50. This balanced reading suggests market participants are neither excessively fearful nor overly greedy. Investors should maintain a cautious yet opportunistic approach, monitoring key support and resistance levels. At this equilibrium point, both long-term accumulation and strategic profit-taking strategies can be considered. Market conditions remain relatively stable, making it an ideal time for portfolio rebalancing and risk assessment.
ME Token Holdings Distribution
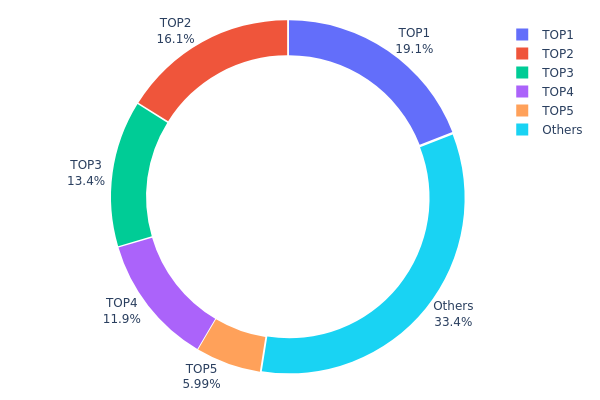
The holdings distribution chart reveals the concentration of ME tokens across different wallet addresses, serving as a key indicator of market structure and potential centralization risks. This metric helps assess whether token ownership is widely dispersed among the community or concentrated in the hands of a few large holders, which directly impacts price stability and market manipulation susceptibility.
Based on the current data, ME exhibits a moderately high concentration pattern. The top address holds approximately 19.09% of total supply (190,988.01K tokens), followed by the second-largest holder at 16.13% (161,326.71K tokens). Combined, the top five addresses control 66.57% of the circulating supply, with the remaining 33.43% distributed among other holders. This concentration level suggests that a relatively small number of entities possess significant influence over ME's market dynamics. While not reaching extreme centralization levels seen in some projects, this distribution pattern indicates potential vulnerability to coordinated selling pressure or market manipulation by major holders.
From a market structure perspective, this concentration creates notable implications for price volatility and trading behavior. Large holders possess the capacity to significantly impact liquidity and price action through substantial transactions. The presence of multiple whale addresses controlling over 10% each introduces systemic risk, as coordinated actions could trigger sharp price movements. However, the fact that 33.43% remains distributed among smaller holders provides some cushion against complete market control. This distribution pattern reflects a project still in its early stages of decentralization, where initial token allocations to team members, investors, or early participants have not yet been sufficiently redistributed through market activity and broader community participation.
Click to view current ME Holdings Distribution
| Top |
Address |
Holding Qty |
Holding (%) |
| 1 |
AcG5pZ...NPmdXJ |
190988.01K |
19.09% |
| 2 |
FcfYR3...H7vuLX |
161326.71K |
16.13% |
| 3 |
AzcBxq...SA91jn |
134207.51K |
13.42% |
| 4 |
32WMXy...2PHzkw |
119413.66K |
11.94% |
| 5 |
Br3Tvr...XdqiSi |
59909.99K |
5.99% |
| - |
Others |
334147.65K |
33.43% |
II. Core Factors Influencing ME's Future Price
Supply Mechanism
- Token Economics Structure: ME operates as a cross-chain consumer dApp token with specific distribution mechanics that influence market supply dynamics.
- Market Sentiment Impact: Since its initial launch phase, ME token price has stabilized within the $4-$6 range, reflecting bearish market sentiment. Declining trading volumes and reduced user participation have contributed to this stabilization, with technical indicators suggesting further bearish momentum.
- Current Market Position: The token's price movement reflects a consolidation phase, where supply-side pressures from decreased user engagement interact with demand-side factors.
Institutional and Major Holder Dynamics
- Traditional Financial Integration: Global central banks' potential shift toward accommodative monetary policies could channel more capital toward crypto assets like ME. The evolving regulatory landscape, particularly in key markets, continues to shape institutional participation patterns.
- Market Accessibility: The expansion of cryptocurrency ETPs and regulated investment vehicles has created new pathways for institutional capital allocation, though direct ME-specific institutional holdings data remains limited in available materials.
Macroeconomic Environment
- Monetary Policy Influence: If global central banks pivot toward accommodative policies, increased capital may flow into crypto assets including ME. Lower funding costs and enhanced liquidity conditions could support risk asset valuations.
- Inflation Hedge Characteristics: ME demonstrates correlation with certain inflation-resistant assets, potentially benefiting from high-inflation environments as investors seek alternative stores of value.
- Interest Rate Dynamics: Changes in major central banks' policy rates affect the relative attractiveness of crypto assets versus traditional fixed-income instruments, influencing capital allocation decisions.
Technology Development and Ecosystem Building
- Cross-Chain Functionality: As a cross-chain consumer dApp token, ME's technical infrastructure enables interoperability across multiple blockchain networks, though specific recent technical upgrades were not detailed in available materials.
- User Participation Metrics: Current ecosystem health indicators point to decreased user engagement and reduced on-chain activity, factors that directly influence token utility demand and price dynamics.
- Market Adoption Trajectory: The token's future development depends on sustained improvements in user participation, ecosystem expansion, and the successful implementation of planned technical enhancements that could revitalize platform activity.
III. 2026-2031 ME Price Forecast
2026 Outlook
- Conservative forecast: $0.1553 - $0.2218
- Neutral forecast: $0.2218
- Optimistic forecast: $0.2373 (subject to favorable market conditions)
2027-2029 Outlook
- Market stage expectation: ME is anticipated to enter a gradual growth phase, with price movements reflecting broader market sentiment and platform adoption trends.
- Price range forecast:
- 2027: $0.1676 - $0.2801
- 2028: $0.1300 - $0.3185
- 2029: $0.1519 - $0.3641
- Key catalysts: Expansion of the Magic Eden ecosystem, increased NFT trading volume, and potential integration with emerging blockchain networks could serve as primary drivers for price appreciation.
2030-2031 Long-term Outlook
- Base scenario: $0.3156 - $0.4100 (assuming sustained platform growth and stable market conditions)
- Optimistic scenario: $0.3677 - $0.4890 (contingent upon significant market share gains and ecosystem expansion)
- Transformative scenario: Prices may exceed $0.4890 if ME successfully captures dominant market share in the NFT marketplace sector and achieves widespread adoption across multiple blockchain ecosystems.
- 2026-01-17: ME price projections suggest a potential upward trajectory over the next five years, with estimated growth rates ranging from modest gains in the near term to potentially significant appreciation by 2031.
| Year |
Predicted High Price |
Predicted Average Price |
Predicted Low Price |
Price Change |
| 2026 |
0.23733 |
0.2218 |
0.15526 |
0 |
| 2027 |
0.28007 |
0.22956 |
0.16758 |
3 |
| 2028 |
0.31852 |
0.25481 |
0.12996 |
14 |
| 2029 |
0.36407 |
0.28667 |
0.15193 |
29 |
| 2030 |
0.40996 |
0.32537 |
0.31561 |
46 |
| 2031 |
0.48899 |
0.36766 |
0.23531 |
65 |
IV. ME Professional Investment Strategy and Risk Management
ME Investment Methodology
(1) Long-term Holding Strategy
- Suitable for: Investors seeking exposure to NFT marketplace infrastructure and cross-chain ecosystem growth
- Operation Recommendations:
- Consider dollar-cost averaging (DCA) to mitigate timing risk, given ME's high volatility with 91.38% decline from its historical high
- Monitor the circulating supply ratio (currently 42.87%) as token unlock schedules may create selling pressure
- Store assets securely using Gate Web3 Wallet, which supports multi-chain asset management aligned with ME's cross-chain strategy
(2) Active Trading Strategy
- Technical Analysis Tools:
- Volume Analysis: Daily trading volume of $132,667 provides liquidity assessment for entry and exit timing
- Support and Resistance Levels: Monitor 24-hour range between $0.2157 (low) and $0.2262 (high) for short-term trading opportunities
- Swing Trading Key Points:
- Recent 7-day trend shows 1.23% gain and 30-day performance of 3.26%, suggesting potential stabilization after significant drawdown
- Set stop-loss orders to manage downside risk, considering the token's volatility demonstrated by its 91.38% annual decline
ME Risk Management Framework
(1) Asset Allocation Principles
- Conservative Investors: 1-3% of crypto portfolio allocation
- Aggressive Investors: 5-10% of crypto portfolio allocation
- Professional Investors: Up to 15% with hedging strategies, considering the project's presence across 33 exchanges
(2) Risk Hedging Solutions
- Portfolio Diversification: Balance ME holdings with blue-chip cryptocurrencies to reduce platform-specific risk
- Position Sizing: Limit individual position exposure given the token's distance from all-time high and relatively small market cap of $95 million
(3) Secure Storage Solutions
- Hot Wallet Recommendation: Gate Web3 Wallet for active trading and seamless multi-chain transactions
- Cold Storage Approach: Transfer larger holdings to hardware wallets for long-term security
- Security Precautions: Verify contract address (MEFNBXixkEbait3xn9bkm8WsJzXtVsaJEn4c8Sam21u on Solana) before transactions to avoid scams
V. ME Potential Risks and Challenges
ME Market Risks
- High Volatility: 91.38% decline year-over-year indicates significant price instability and market sentiment shifts
- Limited Market Capitalization: With $95 million market cap and 0.0065% market dominance, ME remains susceptible to large trading movements
- Token Unlock Schedule: With only 42.87% of total supply in circulation, future unlocks of the remaining 571 million tokens may create downward price pressure
ME Regulatory Risks
- NFT Marketplace Oversight: Evolving global regulations on digital collectibles and NFT platforms may impact Magic Eden's operations
- Cross-chain Compliance: Operating across multiple blockchains (Solana, Bitcoin, Ethereum, Base, Polygon, Arbitrum, and others) increases regulatory complexity
- Token Classification Uncertainty: Regulatory treatment of utility tokens supporting marketplace ecosystems remains subject to policy changes
ME Technical Risks
- Smart Contract Vulnerabilities: Multi-chain deployment increases the attack surface and potential security risks
- Network Dependency: Heavy reliance on Solana blockchain performance and stability may affect user experience
- Competition Intensity: Operating in a highly competitive NFT marketplace sector with evolving technology and user preferences
VI. Conclusion and Action Recommendations
ME Investment Value Assessment
ME represents a high-risk, high-reward opportunity in the NFT marketplace infrastructure sector. The token supports Magic Eden's cross-chain ecosystem strategy across multiple blockchains, positioning it to capture market share in digital collectibles trading. However, the 91.38% decline from historical highs, limited circulating supply (42.87%), and modest market capitalization present considerable challenges. While recent short-term trends show stabilization with gains of 1.23% (7-day) and 3.26% (30-day), investors should approach with caution given the extreme volatility and early-stage nature of this asset.
ME Investment Recommendations
✅ Beginners: Start with minimal allocation (1-2% of crypto portfolio) and use dollar-cost averaging to reduce timing risk; prioritize learning about NFT marketplace fundamentals before increasing exposure
✅ Experienced Investors: Consider 3-8% allocation with active monitoring of circulating supply changes and platform development milestones; implement stop-loss strategies to manage downside risk
✅ Institutional Investors: Evaluate ME as part of a diversified NFT infrastructure thesis with 5-15% allocation; conduct thorough due diligence on token economics, unlock schedules, and competitive positioning
ME Trading Participation Methods
- Spot Trading: Purchase ME on Gate.com and other supporting exchanges with access to sufficient liquidity across 33 trading platforms
- Multi-chain Asset Management: Utilize Gate Web3 Wallet to manage ME alongside other blockchain assets, aligning with the token's cross-chain ecosystem vision
- Gradual Position Building: Implement systematic investment strategies to navigate volatility and benefit from potential long-term ecosystem growth
Cryptocurrency investment carries extremely high risks, and this article does not constitute investment advice. Investors should make prudent decisions based on their own risk tolerance and are advised to consult professional financial advisors. Never invest more than you can afford to lose.
FAQ
What is ME's historical price trend? What were the highest and lowest prices in the past year?
ME reached an all-time high of $13.24 and an all-time low of $0.19. Over the past year, ME demonstrated significant volatility with notable price fluctuations, reflecting market dynamics and investor sentiment shifts in the crypto sector.
What are the main factors affecting ME price?
ME price is primarily influenced by market sentiment, trading volume, and technological developments. Overall market trends and investor confidence are also key factors.
What price predictions do professional analysts have for ME in the future?
Professional analysts predict ME's future price may rise or fall based on market trends and tokenomics. Specific forecasts vary; monitor latest market dynamics and on-chain metrics for informed insights.
What technical analysis methods are commonly used for ME price prediction?
ME price prediction typically uses technical indicators such as RSI (Relative Strength Index) and BOP (Balance of Power). Key support and resistance levels are also commonly analyzed. Current support is at $4.13 and resistance at $9.66.
How does ME's price volatility compare to similar assets?
ME exhibits higher volatility compared to similar assets, reflecting dynamic market expectations. This elevated volatility creates significant trading opportunities, with price movements driven by market sentiment and fundamental shifts in the ecosystem.
How should I analyze and predict ME price trends myself?
Analyze ME's technical indicators, market trading volume, and adoption trends. Track Magic Eden ecosystem development and blockchain metrics. Based on current market volatility, ME price is predicted between $0.29 to $1.31 through 2026-2031, with potential significant growth by 2029.
* The information is not intended to be and does not constitute financial advice or any other recommendation of any sort offered or endorsed by Gate.